Life cycle assessment of roads: Material and process related energy savings
Teresa M. Gulotta1*, Marina Mistretta2, Filippo G. Praticò21 University of Palermo, Department of Energy, Information Engineering and Mathematical Models (DEIM), Viale delle Scienze, Building 9, Palermo 90128, Italy
2 Mediterranea University of Reggio Calabria, Department of Heritage, Architecture, Urbanism (PAU), Salita Melissari, Reggio Calabria 89124, Italy
Corresponding Author Email: [email protected] https://doi.org/10.18280/mmc_c.790313
Received: 13 May 2018 Accepted: 12 June 2018
ABSTRACT
The need for climate change mitigation calls for significant actions to match the sustainable development goals and, in this context, road construction and management play a relevant role (cf. EU Green Public Procurement Criteria for Road Design, Construction and Maintenance and Environmental Product Declarations - EPD).
In such a context, the role of the Life Cycle Assessment (LCA) methodology is broadly recognized as a tool to quantify sustainability of processes and systems.
This study aims at calculating the life-cycle energy and carbon footprint of a typical Italian urban road, including materials production, transportation, construction, maintenance, and rehabilitation.
The LCA approach is applied according to the ISO 14040 regulations series. Authors assess the life cycle energy and carbon footprint of several alternative scenarios based on mixture type and reuse/recycle of waste materials as well as developing dominance analyses. The main contribution of this study is to provide a systemic approach for energy and carbon footprint assessment for the sake of all stakeholders, in order to support the development of new models of low-energy consumption and innovative production models.
Keywords:
life Cycle Assessment (LCA), eco-design, life-cycle energy, road design
1. INTRODUCTION
The reduction of energy consumption and the mitigation of environmental impacts have become key targets of energy and environmental policies in different countries, to be matched by means of strategies aimed at tackling climate change. Road pavement construction has a relevant role in the transportation sector, in terms of energy consumption and material use. Nearly 90% of the roads all over the world are comprised of bituminous mixtures, while the remaining 10% are made of Portland cement concrete [1]. The construction of new roads requires a large amount of mineral aggregates [2] and fiber [3], which poses environmental concerns and calls for a careful consideration of reusing asphalt concretes and recycling plastics as a strategy to improve asphalt binder properties.
Due to the increasing amount of highway pavement constructions over the years, the reduction of energy consumption and greenhouse gas (GHG) emissions should be attentively addressed [2].
During the lifetime of a road, the energy consumption due to vehicle traffic accounts for about 95–98% of the total energy consumption, while the energy consumption in the construction, maintenance and operation steps represents less than 2–5% of the overall energy consumption [4].
Undertaking the energy and environmental assessment of a road is a complex matter, being it affected by several factors, such as pavement materials, final use, traffic, and lifetime.
Any construction activity, namely building road pavements, involves significant energy and environmental impacts, mainly
due to resource consumption, as well as environmental releases and waste generation. However, such effects on the environment continue during road operations, including maintenance and rehabilitation.
Nowadays, pavements projects' stakeholders are interested in evaluating energy burdens by considering different life cycle stages of roads. Hence, an exhaustive assessment of the energy and environmental impacts must take into account energy consumption in a life-cycle perspective. In such a context, the relevance of considering energy-related product information in terms of Life Cycle Assessment (LCA) is broadly recognised and it is becoming more important in the road sector.
It represents a suitable methodology to assess the global energy requirement of a road, including all the phases in which built structures and facilities are procured and erected (manufacturing and transportation of the construction materials and components to the construction site), operations, maintenance, rehabilitation, demolition, and waste management [5-6].
In summarising, based on the above, the motivations of this study refer to the following concurring instances and opportunities: 1) need for energy savings and carbon footprint reduction in the construction of transportation infrastructures; 2) need for reducing landfills, increasing the reuse of milled asphalt concretes (reclaimed asphalt pavements, RAP); 3) opportunity of recycling plastics, substituting the corresponding quantities of bitumen modifiers.
Consequently, in this paper, a life-cycle approach is applied
Modelling, Measurement and Control C
Vol. 79, No. 3, September, 2018, pp. 146-153 Journal homepage: http://iieta.org/Journals/MMC/MMC_C
to assess the life-cycle energy and climate change impacts pertaining to the production, transportation, and construction steps of a typical Italian urban road.
The outcomes of this study will show that the adoption of the life-cycle approach in road energy and environmental assessments allows for:
(1) the advice for designers and consultants to fulfil the targets above in early design and in renovation projects, by choosing among different design options and alternative materials;
(2) the assessment of the most effective actions addressed to minimize energy consumption along the whole road life-cycle. 2. CASE STUDY: LIFE CYCLE ENERGY ANALYSIS OF AN ITALIAN URBAN ROAD
Authors apply the life cycle approach according to the international standards of series ISO 14040 [7].
This study aims at assessing energy consumption and environmental impact, arisen from the life cycle of an Italian urban road case study, for which it is hypothesized that different types of bituminous mixtures are be employed for the formation of the pavement.
2.1 Goal and scope definition
The goal of this study is to assess the life-cycle energy and carbon footprint (CF) of the asphalt pavement of a typical South Italy urban road.
In detail, three alternative scenarios, based on different construction techniques of road pavement, are defined and compared, and a scenario analysis is carried out in order to identify the less impacting one from an energy and environmental point of view. The contribution of each life-cycle step to total energy consumption and CF are identified in order to identify suitable options of improvement.
2.1.1 Functional unit
To this end, the selected functional unit (FU), which represents the reference unit through which a system performance is quantified in an LCA, is 1 m2 of road pavement, as prescribed by the EPD Product Category Rules [8]. 2.1.2 System boundaries
It is assumed that the system boundaries of the LCA analysis include all processes and activities that encompass raw materials sourcing, composite materials production, construction operations and maintenance works during pavement service life.
In detail, the system boundaries include the following steps, according to UNI EN ISO 15978 [9]:
(1) Composite material production (which includes raw material and energy supply) and manufacturing, which involves handling and processing operations occurring in asphalt plants.
(2) Asphalt Paving Operations, which include all the processes for the construction of the road.
(3) Pavement resurfacing, which consist of milling and reconstruction of the upper layer of the pavement (friction course layer), in order to ensure functionality, in terms of bearing capacity, surface regularity and friction over the lifespan of the road infrastructure. Such a step includes the production of new materials, transport to the site and laying
processes, demolition and discard of removed materials. (4) Pavement rehabilitation, which usually includes milling and reconstruction of asphaltic layers.
(5) Transport, which takes into account the transport of raw materials from the extraction to the process site, as well as to the transport of the produced materials to the construction site. (6) End of life, which includes the final destination of the materials, in terms of disposal as waste.
The manufacturing of production equipment, buildings and other capital goods were not taken into account, because not included in the technical system.
The average lifetime of road pavements is assumed to be 20 years. Thus, for resurfacing (replacement of the top layer of the pavement, friction course), the authors assume a time given by half lifespan (10 years). To this end it seems crucial to underline what follows: 1) the fatigue life of RAP-added mixes does not increase monotonically. For RAP percentages higher than 35% the number of cycles to failure may tend to decrease; 2) low percentages of plastics can imply the modification of the asphalt binder, acting as a substitute of modifiers.
With regard to the end-of-life, the main activities related to this phase are demolition (milling) and transportation of materials, to be considered in terms of fuel consumption. 2.1.3 Impact assessment methods
The Cumulative Energy Demand method [10] is used to quantify the Global Energy Requirement (GER) in each life cycle step. Such a method allows the estimation of the consumption of energy from renewable (biomass, wind, solar, geothermal, water) and non-renewable (fossil, nuclear) sources.
Environmental impact is assessed in terms of CF, as contribution to global climate change, including emissions from fossil and biogenic carbon sources, emissions caused by land use change and carbon uptake by plants over a 100-year time horizon. To calculate carbon dioxide equivalents (CO2eq) of all non-CO2gases (CH4, N2O, SF6, HFCs and CFCs) the environmental characterization factor is based on the ILCD 2011 impact assessment method [11].
2.2 Scenario definition for the road pavement
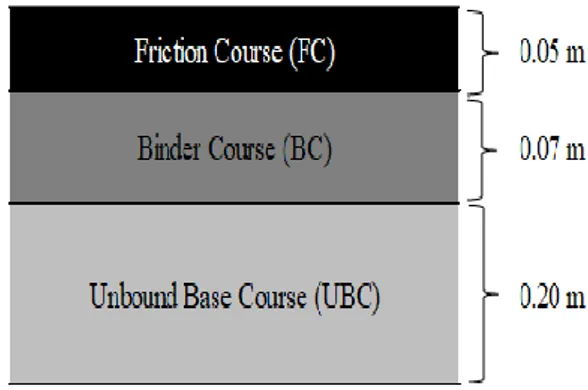
The case study under investigation refers to a two-lane single carriageway road, 1 km length and 11.4 m width (2·2.75+2·2.00+2·0.95), with a pavement thickness of 320mm (Figure 1).
The amount of material for each layer is determined considering a 1 km-long stretch of road Subgrade, embankment, drainages, and road markings are not included in the analysis.
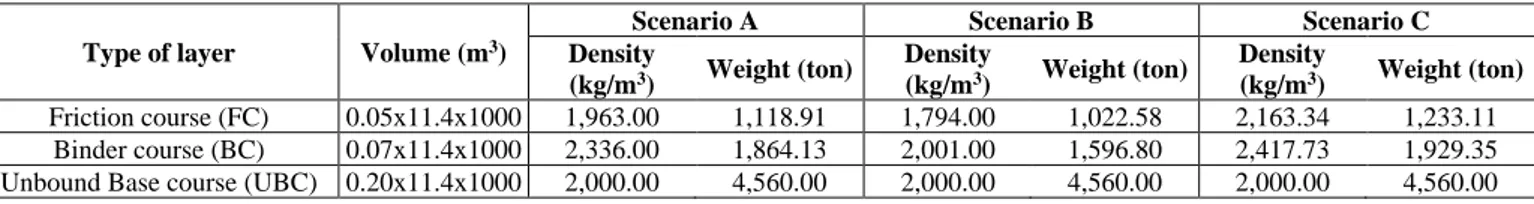
Table 1. Three scenarios: Main parameters
Type of layer Volume (m3)
Scenario A Scenario B Scenario C
Density (kg/m3) Weight (ton) Density (kg/m3) Weight (ton) Density (kg/m3) Weight (ton) Friction course (FC) 0.05x11.4x1000 1,963.00 1,118.91 1,794.00 1,022.58 2,163.34 1,233.11 Binder course (BC) 0.07x11.4x1000 2,336.00 1,864.13 2,001.00 1,596.80 2,417.73 1,929.35 Unbound Base course (UBC) 0.20x11.4x1000 2,000.00 4,560.00 2,000.00 4,560.00 2,000.00 4,560.00
The pavement structure, which lays on the subgrade, is composed of:
(1) Two bituminous layers (friction course, and binder course);
(2) Unbound base course (granular base course).
Table 1 shows the main parameters for the three scenarios, selected in order to identify the best alternative in terms of energy performance and CF.
In Scenario A, the friction course is a porous asphalt concrete, which includes: i) modified bitumen (5 percent by mix weight), containing the five percent of Styrene-Butadiene-Styrene Polymer (SBS); ii) quicklime (QL); iii) cellulose fibres, due to the need for avoiding the binder drainage (FB); iv) mineral filler (FI); v) mineral aggregates; vi) in-place residual air voids (18%). The binder course is a dense-graded asphalt concrete. It includes: i) neat bitumen (5 percent by mix weight); ii) mineral filler; iii) mineral aggregates; iv) in-place residual air voids (6%). The unbound base course includes a given gradation of mineral aggregates, compacted at a given moisture content.
In Scenario B, the friction course is a porous asphalt concrete layer characterized by: i) neat bitumen (with no modifiers); ii) quicklime; iii) cellulose fibres; iv) mineral filler; v) mineral aggregates; vi) waste plastics, containing Low-density polyethylene (LDPE), High-Low-density polyethylene (HDPE), Polyethylene terephthalate (PET), Polyvinyl chloride (PVC), Polycarbonates (PC), Polypropylene (PP), and Polystyrene (PS); vi) crumb rubber, CR (dry process); vii) in-place residual air voids (18%). In such a scenario it is assumed that the selected waste plastics derive from municipal solid wastes, as well as the crumb rubber, which derives from waste tyres, thus addressing at the same time issues that deal with land use reduction for disposal, non-renewable resource saving, and climate change. The binder course is a dense-graded asphalt concrete, which includes: i) neat bitumen (5 percent by mix weight); ii) mineral filler; iii) mineral aggregates; iv) waste plastics (WP), containing Low-density polyethylene (LDPE), high-density polyethylene (HDPE), Polyethylene terephthalate (PET), Polyvinyl chloride (PVC), Polycarbonates (PC), Polypropylene (PP), and Polystyrene (PS); vii) crumb rubber, CR (dry process); iv) in-place residual air voids (6%).
Crumb rubber and waste plastics low percentages concur to bitumen modification. However, when higher percentages are considered, both CR and WP work in part as bitumen compound, in part as inert materials, thus involving a smaller amount of aggregates in the mixture.
Scenario C is devoted to the use of reclaimed asphalt pavement (RAP) in friction and binder courses. As is well known, the use of RAP in bituminous mixtures leads to save virgin materials and to avoid impacts for landfill. The main phases involved for RAP-added mixtures are the following [12–14]:
(1) RAP in-place milling and transport to the crushing plant (or directly to the asphalt plant);
(2) RAP pre-processing or pre-treatment (crushing plant, sieving, transport, stockpiling);
(3) RAP processing at the asphalt plant (heating in the drum; mixing in the mixer).
The remaining processes of RAP-based mixtures are the same as per common mixtures (see Scenario A). The higher the RAP percentage, the lower the virgin aggregates and the virgin bitumen are.
In Scenario C, the pavement with RAP includes: i) modified bitumen (as for the Scenario A); ii) mineral aggregates and mineral filler (as in the Scenario A); iii) 30% of RAP; iv) rejuvenating agent, which amounts to 0.2 - 0.4% by weight of the RAP (REJ); v) a residual air voids content (18%).
2.3 Life Cycle Inventory and data quality
Life Cycle Inventory (LCI) analysis is performed to quantify the significant inputs and outputs of the examined system, by means of mass and energy balances of the selected FU for each scenario.
Data related to materials and construction activities are collected from the literature and through interviews with experts involved in road works.
Virgin aggregates are mainly sand and gravel and are assumed to be selected from crushed and sieved fractions from quarries.
Primary data concerning electricity consumption of equipment used in quarries and hot mix plants are collected from contractors in Calabria Region, which provided figures based on yearly averages. In the case of vehicles and machineries involved in construction and maintenance operations, calculations are based on average hourly fuel consumption data and on reference values of productivity and working hours, available in the literature. Data on machinery performance, diesel consumption, natural gas consumption, and electricity consumption are obtained from the literature and manuals of construction machinery.
In order to complete the data set and model the background system, reference is made to [10] and to information contained in [15] which provides from-cradle-to-gate LCIs of bituminous materials. With regard to the aggregates, the authors assume to derive data from Calabrian and Sicilian quarries.
The eco-profiles of energy sources, raw materials, transports, and waste treatments are included in the analysis based on international environmental databases [10].
The eco-profile of electricity is referred to the Italian electricity mix. The eco-profiles of input materials are mainly referred to the European context.
With regard to materials, they are selected, depending on pavement scenario. Primary data on the eco-profile of crumb rubber (Scenario B) are not available, thus information are derived from the literature [16].
With regard to plant operations, literature assumptions are made [17].
2.3.1 Raw materials
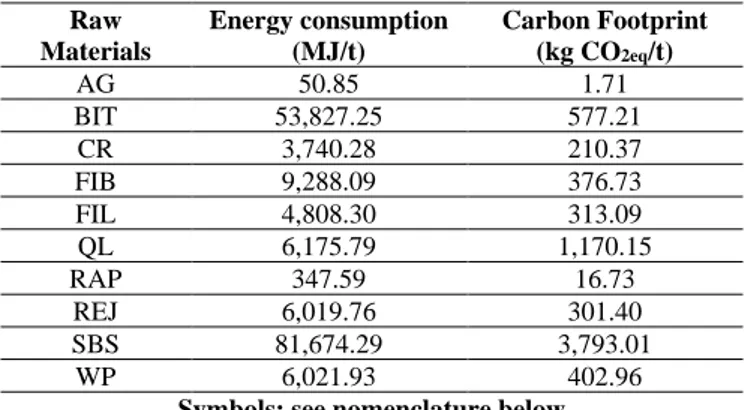
LCI is carried out starting from the creation of processes relative to raw materials, for which energy consumption and carbon dioxide emissions (expressed in terms of kg of CO2 produced) are calculated on the basis of equipment and vehicles employed for production and transport. Table 2 shows the conversion factors of energy consumption and CF for different raw materials.
Data on bitumen production, representative of the European scenario, are derived from an Eurobitume report [15] which defined the life cycle inventory associated to extraction, transport and refinement of crude oil.
Data on CR production are not available as primary data, thus the authors derive them from [17]. Fuel consumption due to transport of end-of-life tires is calculated considering the following distances:
(1) 75 km from the collection point of the end-of-life tires to the processing plant to produce CR.
(2) 100 km from the CR processing plant to the HMA plant. Further, the benefits derived from the avoided disposal of end-of-life tires are considered.
No assessment of CR co-products recycling (steel and textile) has been performed.
The Authors consider the saved energy and the avoided CF due to the waste plastics disposal.
Data on RAP are extracted from an available study on its use in road pavements [18].
The recycled asphalt concrete is assumed to derive from damaged layers of similar infrastructures. Recycled asphaltic materials is either separated per layer (in order to keep its initial homogeneity) or/and divided into gradations [14]. Special additives or rejuvenators (REJ) for restoring the properties of the aged RAP binder must be added.
Table 2. Conversion factors of energy consumption and GHG emissions for different raw materials. Raw Materials Energy consumption (MJ/t) Carbon Footprint (kg CO2eq/t) AG 50.85 1.71 BIT 53,827.25 577.21 CR 3,740.28 210.37 FIB 9,288.09 376.73 FIL 4,808.30 313.09 QL 6,175.79 1,170.15 RAP 347.59 16.73 REJ 6,019.76 301.40 SBS 81,674.29 3,793.01 WP 6,021.93 402.96
Symbols: see nomenclature below 2.3.2 Asphalt concrete
Table 3. Consumption of electricity (kWh/m2), natural gas (Nm3/m2) and water (m3/m2) of the plant during the production of asphalt, divided by material and process Consumption per 1 m2 of asphalt Scenario A Scenario B Scenario C Electricity (kWh/m2) 5.76 5.48 5.72 Natural gas (Nm3/m2) 5.30 5.04 5.44 Water (m3/m2) 0.0044 0.0042 0.0045 The process for asphalt concrete production requires
electricity to operate the whole plant and natural gas to heat the aggregates in the drum dryer (Table 3). Energy consumption of the milling machine used for RAP in Scenario C is taken into account, increasing the consumption of electricity by 0.6% and the consumption of the natural gas by 0.2%.
2.3.3 Transport, construction and maintenance
Analysis of pavement construction in the three assessed scenarios is performed on the basis of the data listed in Table 4, which shows the quantities per FU of the different component materials constituting the pavement layers and of the average transport distances of raw materials and composite materials, estimated from production/supply sites to the road construction site. These data are used together with the previously discussed LCI data to calculate the total energy consumption.
Table 4. Quantities and transport distances of employed component materials
Materials Scenario
A B C
kg/FU km kg/FU km kg/FU km
AG 557.9 196 504.3 196 491.44 196 BIT 12.43 348 10.01 348 10.04 348 CR - - 13.12 100 - - FIB 0.29 205 0.27 205 0.32 205 FIL 43.42 196 42.52 196 44.04 196 QL 7.33 460 6.43 460 7.78 460 RAP - - - - 83.22 100 REJ - - - - 0.25 348 SBS 0.29 348 - - 0.3 348 WP - - 13.12 100 - - WAT 40 40 40
With regard to transport, three transport steps in the pavement life-cycle are considered:
(1) transport of raw materials from the extraction site to the processing facility, such as the transport of crude oil to refinery;
(2) transport of processed materials to manufacturing plants, such as transport of asphalt from refinery to the hot-mix asphalt plant or transport of aggregate products from quarry to the mixing plant;
(3) transport of manufactured materials from the production site to the construction job site. The first transport stage was included in the life-cycle inventory of raw materials.
The placement of materials at the construction site depends on construction requirements on site and it is accomplished using different types of equipment.
In the construction phase, the environmental burdens are due to the combustion-related emissions from construction equipment usage.
Fuel consumption due to the transport of materials from the processing plant to the laying site is calculated taking into account an average distance of 100 km.
Laying operations are considered taking into account data shown in Table 5.
Hourly fuel consumption of construction equipment and water consumption are considered together with the operating time and haul distance of each operation involved in pavement construction and maintenance. In maintenance operations, fuel and water consumptions caused by the reconstruction of the
friction course are added to those deriving from milling of the old damaged surface layer and to transportation of the removed material to a landfill located at a distance of 100 km. The above considerations are valid also during maintenance.
Table 5. Equipment employed for the road construction Type of equipment Operating
time (h) Fuel (L/h) Water (L/h) Haul distance (km) Paver 26.60 26.00 40.00 100.00 Compactor 3.60 8.00 50.00 100.00 Dump truck 1.20 19.00 - 100.00 Milling equipment 9.00 100.00 287.00 100.00 Grader 0.28 30.00 - 100.00 3. RESULTS
The LCA model is employed to evaluate GER and CF, associated to the life-cycle steps of the road pavement, including the production of materials, construction of pavement, transport, maintenance and end of life, in the three assessed scenarios.
3.1 Life-cycle energy analysis: GER
Outcomes of life-cycle energy analysis are presented in Table 6, where life cycle GER is reported for each investigated scenario. Table 6 shows that the production stage involves the most significant contribution to GER (1,867 MJ/m2), accounting for about 52% in scenario A, 53% in scenario B and 51% in Scenario C, followed by the construction step, which shares 19% in all the scenarios.
The maintenance step is almost the same in all the scenarios, accounting for about 18% of the total GER in Scenarios A and B, and for 17% in Scenario C. For transport and end-of-life, GER is about 5% in all scenarios.
Scenario C determines the lowest GER, due essentially to the RAP use, which implies a reduction of virgin raw materials requirement.
In Scenario B, the use of CR e WP involves a reduction of GER equal to 5%, in comparison to Scenario A.
In Scenario C, the use of RAP implies a reduction of GER equal to 7%, with respect to Scenario A.
Table 6. GER in life-cycle of road pavement in the three assessed scenarios (MJ/m2)
Life-cycle steps Scenario
A Scenario B Scenario C Production 978.24 939.18 883.02 Transport 97.48 92.48 99.95 Construction 351.22 333.19 354.02 Maintenance 341.54 315.07 300.40 End-of-Life 98.26 93.21 100.74 Total 1,866.73 1,773.13 1,738.13
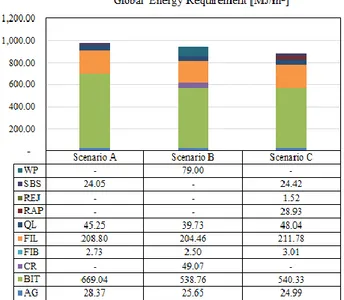
Figure 2 shows the GER of the production step in the assessed scenarios. The contribution of each material production is calculated. It can be highlighted that the lowest value of GER in Scenario C, due to the use of RAP, as previously observed, is due to the partial substitution of virgin raw materials with recycled ones.
In detail, virgin aggregate amount decreases of 32%, virgin bitumen of 24% and virgin SBS of 45%, in comparison with Scenario A.
The use of REJ additives involves a contribution of about 3% in the GER production.
As it may be observed from Table 6 and Figure 2, the bitumen production involves the highest contribution to GER in all the assessed scenarios. In Scenario A, it involves about 68% of GER, while in Scenarios B and C it is 57% and 61%, respectively. Such a reduction is due to the use of CR and WP in Scenario B and to the RAP use in Scenario C.
Symbols: see nomenclature below.
Figure 2. GER of materials production
Outcomes of GER, expressed in MJ per m2, are shown in Table 7. In detail, the contribution of each pavement layer to GER is presented in the three assessed scenarios.
Table 7. GER in production, transport and construction steps, shared per pavement layer (MJ/m2)
Layer Scenario A Scenario B Scenario C
Friction Course 753.92 694.88 677.84 Production 326.03 300.89 283.31 Transport 15.39 14.07 16.96 Construction 55.45 50.68 60.07 Maintenance 341.54 315.07 300.40 End-of-life 15.51 14.18 17.10 Binder Course 606.51 571.94 557.42 Production 462.64 448.71 410.14 Transport 25.64 21.96 26.54 Construction 92.38 79.13 94.00 Maintenance - - - End-of-life 25.84 22.14 26.75 Unbound Base Course 506.31 506.31 502.87 Production 189.58 189.58 189.58 Transport 56.45 56.45 56.45 Construction 203.38 203.38 199.95 Maintenance - - - End-of-life 56.90 56.90 56.90
From Table 7, it can be observed that in the production step the most significant contribution to GER arises from the binder
course production (Scenario A: 76%, Scenario B: 78%, Scenario C: 74%), while the production of friction course layer accounts for lower shares (Scenario A: 43%, Scenario B: 43%, Scenario C: 42%). To this end it is noted that the binder course layer accounts for 70 mm, while the friction course for 50 mm, which complies with the above. The unbound base course accounts for 37% in all the assessed scenario.
With regard to the construction step, the unbound base course layer shares for 40% in the total GER in each scenario. With regard to the maintenance step, as indicated in paragraph 2.1.2, it is foreseen once during pavement lifetime, taking into account the replacement of the friction course layer.
Such a step accounts for 45% of the total GER, including the transport from the pavement site to landfill and the waste asphalt management.
3.2 Life-cycle environmental impact: CF
The environmental impact of the investigated road pavement during its life cycle is assessed in terms of CF, expressed in kg of CO2equivalent per m2.
Table 8 shows the CF for each of the studied scenarios. The results are shown for each life-cycle step. Scenario A accounts for 80.7 kgCO2eq/ m2 , while Scenarios B and C account for 83.50 kgCO2eq/m2 and 82.10 kgCO2eq/m2, respectively (3.4% and 1.7% more, respectively). These outcomes are comparable to literature data [19].
From the results shown in Table 8, it can be highlighted that material production, which includes the extraction of raw materials and the production of materials used in the pavement construction, causes the highest share (about 40% in Scenario A and C, 43% in Scenario B).
Table 8. Carbon footprint for the whole life cycle of road scenarios
Life-cycle steps Scenario
A Scenario B Scenario C Production 31.52 35.64 32.25 Transport 6.41 6.1 6.58 Construction 22.45 21.3 22.66 Maintenance 9.95 10.66 10 End-of-Life 10.37 9.8 10.61 Total 80.70 83.50 82.10
With regard to transport, it accounts for nearly 8% in all the scenarios.
Figure 3 shows the contribution to CF from materials production. It can be highlighted that the highest share comes from the use of filler in HMA, with almost the same contribution in all the assessed scenarios.
The second highest contribution is involved by the production of modified bitumen, which is about 7 kgCO2eq/m2 in Scenario A, while it decreases to about 5.8 kgCO2eq/m2 in the remaining scenarios.
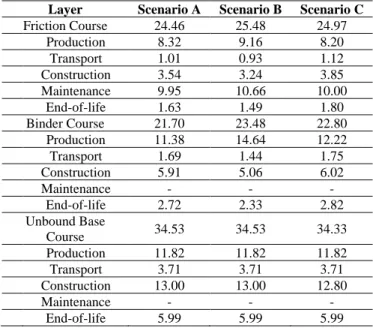
Outcomes of CF, expressed in kgCO2eq/m2, are shown in Table 9. In detail, the contribution of each pavement layer to CF is presented in the three assessed scenarios.
From Table 9, it can be observed that in each scenario the variation trend of CF is similar to the one of GER. In fact, in the production step the most significant contribution to CF arises from the binder course production, which accounts for 52% in Scenario A, 62% in Scenario B, and 54% in Scenario C).
The production of both friction and unbound base course layers accounts for 34-35% in all the assessed scenarios.
With regard to the construction step, the unbound base course layer accounts for 13% in all the scenarios.
Figure 3. CF of materials production
Table 9. Carbon footprint in production, transport and construction steps, shared per pavement layer (kgCO2eq/m2)
Layer Scenario A Scenario B Scenario C
Friction Course 24.46 25.48 24.97 Production 8.32 9.16 8.20 Transport 1.01 0.93 1.12 Construction 3.54 3.24 3.85 Maintenance 9.95 10.66 10.00 End-of-life 1.63 1.49 1.80 Binder Course 21.70 23.48 22.80 Production 11.38 14.64 12.22 Transport 1.69 1.44 1.75 Construction 5.91 5.06 6.02 Maintenance - - - End-of-life 2.72 2.33 2.82 Unbound Base Course 34.53 34.53 34.33 Production 11.82 11.82 11.82 Transport 3.71 3.71 3.71 Construction 13.00 13.00 12.80 Maintenance - - - End-of-life 5.99 5.99 5.99
With regard to the maintenance step, as indicated in paragraph 2.1.2, one replacement of the friction course layer is taken into account during pavement lifetime.
Such a step accounts for 45% of the total CF, including the transport from the pavement site to landfill and the waste asphalt management.
4. CONCLUSIONS
In this paper life-cycle approach is applied to assess energy consumption and carbon footprint of a typical Italian urban road. All the stages of the lifecycle have been considered, from
extraction of virgin materials to the end of life.
Three different scenarios, based on different construction techniques of road pavement, are defined, and a scenario analysis is carried out in order to identify the less impacting one from the energy and environmental point of view. The contribution of each life-cycle step on the total impacts and the energy and environmental hotspots are identified. Expected life implications were carefully considered. Indeed, percentages of RAP and plastics are consistent with negligible variations of the expected life, as per the boundary conditions set up above. This strengthens and enhances the soundness of the conclusions below.
Scenario A is essentially characterized by layers with hot mix asphalt, which contains modified bitumen, including SBS polymer, quicklime, mineral aggregates and filler.
In Scenario B the bituminous layers are characterized by neat bitumen, with quicklime, mineral aggregates and filler. SBS polymer is replaced by waste plastics and crumb rubber derived from end-of-life tires. Crumb rubber and waste plastics low percentages concur to bitumen modification. However, when higher percentages are considered, both crumb rubber and waste plastics work in part as bitumen compound, in part as inert materials, thus involving a smaller amount of aggregates in the mixture.
Scenario C is devoted to the use of RAP in the bituminous layers, in which recycled asphalt from decommissioned pavements is added to the bituminous mixture of new manufacturing.
In comparison with Scenario A, Scenario B and C present low values of GER. This is essentially due to the use of secondary raw materials in the production and maintenance steps, which involves a saving of virgin materials. Scenario B is characterized by the employment of waste plastics instead of virgin ones. In detail, the rationale behind such a scenario is to refer to the assumption that the selected waste plastics derive from municipal solid wastes, as well as crumb rubber from waste tyres are used into permeable bituminous mixtures, so addressing at the same time land use reduction for disposal, non-renewable resource saving, and climate change.
The results show that material production step, including the raw material extraction and resource supply, involve the highest energy consumption and carbon footprint, mainly due to the presence of bitumen, which a petroleum derivate with high energy and environmental impacts. In particular, although the binder course is the layer that accounts for the highest share in GER and CF, friction course implies the most significant life-cycle impacts, due to its replacement assumed for maintenance.
GER is slightly decreased in Scenario C, by employing reclaimed asphalt pavement material in partial substitution of virgin aggregates and bitumen, and in Scenario B, where crumb rubber and waste plastic replace SBS polymers.
Both in Scenario B and C the Authors take into account the benefits, in terms of saved GER and avoided CF, due to avoided disposal of crumb rubber, waste plastic, and RAP.
This result shows that waste plastic modified bitumen could represent an alternative recycling method for plastic waste management.
The analysis proposed in this paper marks the concept of providing a systemic approach for energy and carbon footprint assessment for the sake of all stakeholders, in order to support the development of new models of low-energy consumption and innovative production models in the road field.
Outcomes show that the adoption of the life-cycle approach
in road energy and environmental assessments could allow for: (1) the integration of energy and environmental performance criteria and targets into codes and policy strategies, which traditionally are mainly focused on costs, structure and safety items;
(2) the advice for designers and consultants to fulfil the above targets in early design and in renovation projects, by choosing among different design options and alternative materials;
(3) the assessment of the most effective actions addressed to save energy and to minimize environmental impacts along the whole road life-cycle.
REFERENCES
[1] Zapata P, Gambatese JA. (2005). Energy consumption of asphalt and reinforced concrete pavement materials and construction. Journal of Infrastructure Systems 11(1): 9– 20. https://doi.org/10.1061/(ASCE)1076-0342(2005)11:1(9)
[2] Birgisdóttir H, Pihl KAA, Bhander G, Hauschild MZZ, Christensen THH. (2006). Environmental assessment of roads constructed with and without bottom ash from municipal solid waste incineration. Transportation Research Part D: Transport and Environment 11(5): 358– 68. https://doi.org/10.1016/j.trd.2006.07.001
[3] Cardinale T, Sposato C, Feo A, Fazio D. (2018). Clay and fibers: Energy efficiency in buildings between tradition and innovation. Mathematical Modelling of
Engineering Problems 5(3): 183–9.
https://doi.org/10.18280/mmep.050308
[4] European Asphalt Pavement Association, National Asphalt Pavement Association. (2011). The Asphalt Paving Industry A Global Perspective - 2nd edition. [5] Beccali M, Cellura M, Fontana M, Longo S, Mistretta M.,
(2013). Energy retrofit of a single-family house: Life cycle net energy saving and environmental benefits. Renewable and Sustainable Energy Reviews 27: 283–93. https://doi.org/10.1016/j.rser.2013.05.040
[6] Gulotta TM, Guarino F, Mistretta M, Cellura M, Lorenzini G. (2018). Introducing exergy analysis in life cycle assessment: A case study. Mathematical Modelling of Engineering Problems 5(3): 139–45. https://doi.org/10.18280/mmep.050302
[7] UNI EN ISO 14040: 2006. (2006). Environmental Management-Life Cycle Assessment - Principles and Framework.
[8] EPD. (2018). EPD Environmental Product Declaration. Environmental Product Declaration.
[9] International Organization for Standardization. (2011). UNI EN 15978:2011 - Sustainability of construction works - Assessment of environmental performance of buildings - Calculation method. Sustainability of Construction Works - Assessment of Environmental Performance of Buildings - Calculation Method (November).
[10] Wernet G, Bauer C, Steubing B, Reinhard J, Moreno-Ruiz E, Weidema B. (2016). The ecoinvent database version 3 (part I): overview and methodology. The International Journal of Life Cycle Assessment 21(9): 1218–30. https://doi.org/10.1007/s11367-016-1087-8 [11] European Council. (2009). Directive 2009/125/EC of the
2009 establishing a framework for the setting of ecodesign requirements for energy-related products (recast). Official Journal of the European Union 10–35. https://doi.org/10.1016/j.cirp.2012.03.121
[12] Bonicelli A, Calvi P, Martinez-Arguelles G, Fuentes L, Giustozzi F. (2017). Experimental study on the use of rejuvenators and plastomeric polymers for improving durability of high RAP content asphalt mixtures. Construction and Building Materials 155: 37–44. https://doi.org/10.1016/j.conbuildmat.2017.08.013 [13] Pradyumna TA, Mittal A, Jain PK. (2013).
Characterization of Reclaimed Asphalt Pavement (RAP) for use in bituminous road construction. Procedia - Social and Behavioral Sciences 104: 1149–57. https://doi.org/10.1016/j.sbspro.2013.11.211
[14] Praticò FG, Vaiana R, Giunta M. (2013). Pavement sustainability: Permeable wearing courses by recycling porous European mixes. Journal of Architectural
Engineering 19(3): 186–92.
https://doi.org/10.1061/(ASCE)AE.1943-5568.0000127 [15] Blomberg T, Bernard F, Southern M. (2012). Life cycle
inventory: Bitumen.
[16] Santagata E, Zanetti MC. (2012). The use of products from end-of-life tyres in road pavements. ECOPNEUS, Milan, Italy (in Italian).
[17] Farina A, Zanetti MC, Santagata E, Blengini GA. (2017). Life cycle assessment applied to bituminous mixtures containing recycled materials: Crumb rubber and reclaimed asphalt pavement. Resources, Conservation
and Recycling 117: 204–12.
https://doi.org/10.1016/j.resconrec.2016.10.015
[18] Giani MI, Dotelli G, Brandini N, Zampori L. (2015). Comparative life cycle assessment of asphalt pavements using reclaimed asphalt, warm mix technology and cold in-place recycling. Resources, Conservation and
Recycling 104: 224–38.
https://doi.org/10.1016/j.resconrec.2015.08.006
[19] Miliutenko S, Björklund A, Carlsson A. (2013). Opportunities for environmentally improved asphalt recycling: The example of Sweden. Journal of Cleaner
Production 43: 156–65. https://doi.org/10.1016/j.jclepro.2012.12.040 NOMENCLATURE AG Mineral Aggregates BIT Bitumen BC Binder Course
CF Carbon Footprint [kg CO2eq]
CR Crumb Rubber
FC Friction Course FIB Cellulose Fibres FIL Mineral Filler
GER Global Energy Requirement [MJ] HDPE High-Density Polyethylene HMA Hot Mix Asphalt
LCA Life Cycle Assessment LCI Life Cycle Inventory
LCIA Life Cycle Impact Assessment LDPE Low-Density Polyethylene PC Polycarbonates
PET Polyethylene Terephthalate PS Polystyrene
PVC Polyvinyl Chloride
QL Quick Lime
RAP Reclaimed Asphalt Pavement REJ Rejuvenating Agent
SBS Styrene-Butadiene-Styrene Polymer UBC Unbound Base Course