* Corresponding author: [email protected]
Charting the Edges of Human Performance
Barry Kirwan1,*, Matthias Wies2, Rebecca Charles3, Charles-Alban Dormoy4, Theodore Letouze5, Alia Lemkadden6,
Nicolas Maille7, Jim Nixon3, Daniele Ruscio7, and Carsten Schmidt-Moll9
1EUROCONTROL, 2DLR, 3Cranfield University, 4CATIE, 5Bordeaux INP, 6CSEM, 7ONERA, 8Deep Blue, 9Lufthansa
Abstract. In the Horizon 2020 funded Future Sky Safety programme, the Human Performance Envelope project pushed airline pilots to the edges of their performance in real-time cockpit simulations, by increasing stress and workload, and decreasing situation awareness. The aim was to find out how such factors interact, and to detect the edges of human performance where some form of automation support should be employed to ensure safe continued flight. A battery of measures was used, from behavioural to physiological (e.g. heart rate, eye tracking and pupil dilation), to monitoring pilot performance in real time. Several measures – e.g. heart rate, heart rate variability, eye tracking, cognitive walkthrough, and Human Machine Interface (HMI) usability analysis – proved to be useful and relatively robust in detecting performance degradation, and determining where changes in information presentation are required to better support pilot performance in challenging situations. These results led to proposed changes in a prototype future cockpit human-machine interface, which were subsequently validated in a final simulation. The results also informed the development of a ‘Smart-Vest’ that can be worn by pilots to monitor a range of signals linked to performance.
1 The Human Performance Envelope
The concept of Human Performance Envelope (HPE) considers nine Human Factors that influence performance. The factors include attention, situation awareness, vigilance, teamwork, workload, communication, trust, fatigue, and stress. The aim of the HPE concept is to map how these factors work alone and in an interacting combination and how they lead to a Human Performance (HP) modification.
While several indicators, tests, metrics, and tools to measure individual Human Factors have been produced over the years, there is still a need to better assess how to offer precise ways to monitor the combination and interaction of multiple range of factors within a HPE framework. This consideration is especially relevant for complex Human Factors concepts like stress, fatigue and situation awareness.
In aviation research these factors are not always represented by univocal metrics, and are investigated by a series of behavioral indicators that mostly focus on cognitive concepts (disregarding the emotional aspects concerning perception and management) or by neurophysiological indexes that require additional analysis to better understand the combination of processes that they could reflect (e.g. autonomic nervous systems modulations).
To assess the HPE measurement, a series of experimental trials were set up in the course of the project. Different tasks designed to control and
manipulate the levels of three human factors (workload, stress and situation awareness) in a HPE framework, and different configurations of newly developed Human Machine Interfaces (HMI), were manipulated in order to provoke degradation of pilot performance and to measure the impact of the single and combined HPE factors on pilots’ performances.
2 Experimental set-up
Two experiments were set up in the project and conducted with professional airline pilots. The first experiment was conducted in an A320 full flight research simulator. The second experiments took place in a static advanced touch-screen concept-cockpit simulator, its flight mode and systems also based on an A320.
Various measurements were used in both experiments. They include questionnaires (ISA, NASA-TLX, SART, SACL), eye-tracking including pupil diameter, physiological sensors (electrocardiogram, respiration, body temperature, 3-axis acceleration, activity), performance curves, behavioural markers, video and voice recordings, simulator data, and benefits questionnaires. An analysis of mental representation and the use of a developed competency assessment tool provided further data for the analysis.
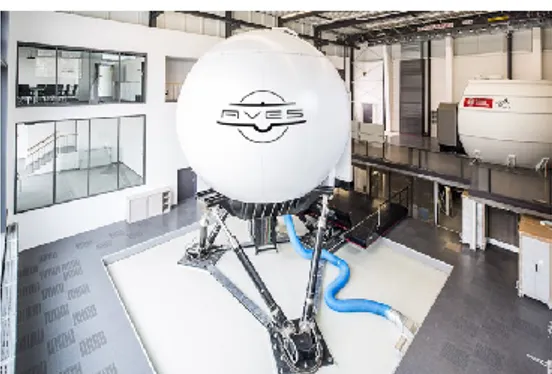
The first experiments were conducted in an A320 research simulator called AVES (Air VehiclE
Simulator). It is a motion simulator with six degrees-of- freedom using an electric 60-inch hexapod motion cueing system with a 14-ton capacity. The cockpit is a nearly complete replica of an Airbus A320-200 with IAE V2500 engines. It contains the full set of control and display elements in the glare shield, the pedestal and the front as well as the overhead panel. The maintenance panel and both circuit breaker panels are not included. The hardware of the visual system features 15-channel LED-projection with a field of view of 240°x 95°.
Fig. 1. The DLR AVES flight simulator.
The second experiment was conducted in an advanced cockpit simulator called AVIONICS 2020 COCKPIT. The flight model of the simulator is taken from X-Plane simulator A320 and some add-on functionalities. The scenery is taken from Prepared 3D (Lockheed Martin) simulator. The aircraft is piloted with sidesticks, no rudder pedals. This simulator is used as demonstrator and as tests bench and validation simulator. The cockpit interface is composed of four 17” touchscreens that represent the current state of product line for cockpits. A Flight Control Unit (FCU) is also available above the touchscreens to manage the flight parameters of the auto flight system.
Fig. 2. Thales future cockpit simulator.
Two scenarios where developed to measure and validate the HPE and to validate the newly developed HMI. Scenario 1 consisted of an ILS approach with manual control into the airports Frankfurt and Hannover. The levels of the different HPE factors were varied in a total of 8 runs. The first run was the baseline with no events happening and the factors a normal low level. In the second, third and fourth run the level of workload
was varied from medium to very high. In the fifth run the level of stress was set to high while in the sixth run the level of situation awareness was highly reduced. Within run seven and eight the three human factors were combined and their level varied from medium to high. Each run lasted around 15 to 20 minutes.
The events associated with the increase of workload were turbulence (medium or high), approach and runway change. Low fuel situation, delay vectors and loud noise were used to produce an increase in stress. The reduction of situation awareness was generated by the events low visibility, localiser interference and wind shift.
Scenario 2 consisted of an approach into the airport Bremen while the following events took place which increased the levels of the HPE factors to a maximum during the run. The levels were not individually and selectively varied as in scenario 1.
Approaching Bremen with standard fuel for 50 min remaining flight time
Preparation of CAT1 approach RWY 27
Go‐around during ILS approach RWY 27 due to slow preceding (VFR) traffic
During downwind ELEC AC BUS 1 FAILURE Constantly increasing workload due to the
procedure and the time needed
Decision making and handling of complexity under low fuel conditions
CAT2 ILS approach RWY 09
Possible engine flame‐out due to amount of fuel Scenario 2 lasted around 45 minutes.
Overall, 30 first officers from a major European airline flying A320 aircraft participated in the studies as test candidates. The flight crew was complemented by a briefed captain of the same airline. The captain flew all scenarios and runs with all 30 first officers. The 30 first officers (2 female, 28 male) were aged between 28 and 41 (M = 32, SD = 3.79). On average they had a total flight experience ranging from 2250 to 8500 hours (M = 4045, SD = 1706) and on average 3765 hours on the A320 (SD = 1585). Their current flight experience (flight hours within the last 12 month) was on average 640 hours (SD = 104).
Ten first officers took part in the first simulator experiments. As the second experiment consisted of two different HMI settings, 20 first officers participated in those experiments. This way 10 first officers flew with the basic (current) HMI of the cockpit simulator and the other 10 first officers flew with the advanced (newly developed) HMI. The different HMI settings in the second experiment were chosen in order to determine and control the differences between the A320 full flight research simulator (called Step 1) and the cockpit simulator with the basic A320 HMI set-up (called Step 2). This approach allowed a comparison of the advanced HMI set-up (called Step 3) with the set-up and conditions of Step 1 and Step 2, and enabled an evaluation of the new HMI.
3 Physiological Measures
The CSEM system [1] for monitoring the physiological parameters (smart vest) is based on the use of three cooperative sensors. The vest allows the measurements of the following signals:
Ͳ Two electrocardiograms (ECG) leads; Ͳ A transthoracic bio-impedance; Ͳ Skin temperature;
Ͳ Accelerometer;
Ͳ Multi-channel photoplethysmography (PPG).
Fig. 3. CSEM smart vest.
From these signals several physiological measures were estimated. However the most promising results were obtained with ECG derived features as also confirmed in a review study by Straussberger & Schaefer (2004):
Heart rate (HR), the number of contractions (beats)
of the heart per minute (bpm).
Heart rate variability (HRV), is the variation of
the NN intervals (normal R-R intervals). This variability can be estimated by utilizing different methods to extract in its turn different features. Two of these methods are:
Time-domain method:
o SDNN, standard deviation of the NN intervals and often described as the total variability;
o
Frequency-domain method; by analysing different frequency bands:
o HF, High frequency (0.15 – 0.4 Hz). Describes the parasympathetic modulation;
o LF, Low frequency (0.04 – 0.15 Hz). Describes the sympathetic modulation;
3.1 Results & Discussion
As demonstrated in previous studies [2], there was a clear increase of HR during the duration of the different runs (except Run 5). In particular when the HR values were normalized and when the analysis were constrained to the phase 2 period. The SDNN also showed a clear pattern of a decrease with an increase in workload which has also been shown in previous studies such as [2, 3]. Compared to the other measures, SDNN was not statistically different when runs with workload were compared to the runs with mixed factors.
As the literature have already shown [2, 3], the frequency domain HRV features also demonstrated a significant difference between the runs. However, the factor that exhibited the highest response was the run with high stress. The spectral analysis of the HRV consisted of first the HF, which measures fast variations in the frequency domain and reflects the parasympathetic (vagal) modulation. HF reached the highest significance when Run 5 was compared to the baseline in both the single and group analysis. The LF feature showed the same tendency as HF in the group analysis. However, in the single pilot analysis the LF response was almost the same when Run 5 was compared to the baseline and when Run 8 was compared to the baseline. This is not surprising, since LF expresses slower variations of the frequency domain that reflects both parasympathetic and sympathetic modulation in comparison to HF where only the parasympathetic modulation is taken into account.
The run that showed no clear pattern in this case is Run 6 (reduced SA) and it is therefore difficult to interpret it. There was always a tendency of a decrease, but it was not significant in the single pilot analysis and the same for HF in the group analysis. No literature was found so far describing whether degradation of SA has an effect on the physiological response. Run 8, which contains the mixed factors, showed to be highly significant when compared to Run 1 in the single pilot analysis and also did Run 5 (high stress alone). However, in the group analysis the distribution of Run 8 started to increase in width, but remained always significant with respect to Run 1.
3.2 Summary
The outcomes of this experiment have shown that physiological measures such as HR, SDNN, HF, LF and VLF can be sensitive to an increase in workload and/or stress. The runs with SA degradation on the other hand showed very often no clear pattern and remained therefore difficult to interpret. HR and SDNN were particularly sensitive to the increase in workload, while the HRV features derived from the spectral analysis (HF, LF and VLF) showed a significant response to the increase of stress as well. The single pilot versus group analysis showed the importance of normalizing HR values when conducting the group analysis (in particular the phase 2 analysis). This is not surprising since an “absolute” HR value is much more subject dependent than HRV that express a type of “variability” which results in HR being more sensitive to inter-subject
variability. In summary, the physiological measures employed in the simulations can measure changes in workload and stress, but not situation awareness.
Since the ultimate aim of this work was to improve cockpit support to the pilots, several approaches were utilised to understand and track what was happening to their situation awareness during the scenarios. These measures used, respectively, eye movement tracking, a cognitive walkthrough approach, and a questionnaire and interview method. The results of these approaches, and their impact on HMI evaluation, are described below.
4 Eye Movement Tracking Analysis
This section details two treatments of the eye-tracking data acquired in Scenario 1 of the two-week simulation conducted at DLR Braunschweig, in Germany, in May 2016. The aim of this work was two-fold. Firstly, to understand movement of point of regard in relation to scenario events and secondly, to begin to understand pilot situation awareness (SA) in response to scenario events through detailed analysis of gaze behaviour. In support of these twin aims, we provide a detailed analysis of pilot point of regard across a run.
In the run, pilots were required to fly an ILS approach with manual control landing at Frankfurt airport, runway 25L. The run starts with increased turbulence which remains throughout the whole run. Three events were introduced to challenge the pilots. These events were low fuel, delay vectors and the sudden introduction of a loud noise. The low fuel is an issue from the start of the run. Delay vectors occur from the beginning of the run during initial approach - between the intermediate approach fix (IAF) and the final approach fix (FAF). The loud noise occurs during final approach (between FAF and landing) and lasts for approximately one and a half minutes.
Low visibility is an issue throughout the whole run, localiser interference occurs during final approach (between FAF and landing), and there is a wind shift, from head to tail during the final approach (between FAF and landing). These runs were designed to decrease situation awareness.
The analysis of the eye tracking data and the cockpit dialogue was able to identify how SA was shared between the captain and FO (first officer) and how this was managed. In most cases, the Captain initiated cross checking with the FO. At a surface level this would indicate that the Captain had better SA than the FO. However, the FO spent the majority of their time focussed on their PFD, which may indicate a level of shared SA between the captain and the FO, with the FO being supported by their PFD. It was apparent in some situations that the FO was effectively ‘offloading’ their SA to the Captain, with the FO cross referencing information on their instruments when required. Although the eye tracking data cannot explicitly detect performance degradation or recovery strategy, it is able to indicate how the flight crew reacted at key points. For example, when the low fuel situation was realised. This resulted in a significant change in strategy for the flight
team, as they then had to manage the low fuel situation. The realisation of the limited fuel level led to the FO and captain working together to establish the future state of the aircraft: Explicit evidence of level 3 SA (anticipating the future) was captured when the FO was required to project the amount of time remaining given the amount of fuel. The proactive approach of the Captain was different to the reactive approach of the FO. This can be observed through the analysis of the dialogue, supported by the eye tracking data. They managed to recover the situation by sharing information and crosschecking. A certain amount of cognitive processing was also required in order to calculate the remaining fuel time. Their misalignment in views (the captain wanting to call emergency but the FO not agreeing) could have been due to a number of things; the Captain’s SA was being supported by external information being fed directly to him, in addition to observing the FO’s actions and monitoring the instruments. The FO’s SA was supported by the information being fed to him by the captain, along with his own instruments. They were using different information, which as a result built different mental models. It is difficult to envisage how this could be better supported by the interface, but this mismatch indicates that it could potentially be improved; whether this is by interface improvement or SOP changes will need additional analysis.
Fig. 4. Eye tracking in A320 simulator.
Evidence of comprehension was reached on more occasions, notably during the loud noise, when the FO was able to establish that there was nothing wrong with the aircraft and that the current situation was normal, by monitoring his instruments. In effect, the FO’s SA was being supported by the instruments. For the remainder of the run, the FO effectively offloaded his SA requirement to the captain, who, through communications with ATC and constant monitoring of the instruments may have had a more accurate, holistic view of the state of the aircraft than the FO.
This proof of concept has demonstrated that this type of approach to eye tracking analysis can be valuable in giving us an insight into the SA of the eye tracking wearer. This enables us to make certain inferences about the information that is important, and what is comprehended and carried forward.
Having established that eye tracking can help understand what information is used and when, the next step was to go deeper into the pilot’s cognitive
processes, to see how the pilot reasons about the information in order to make critical decisions.
5 Cognitive Analysis
Cognitive engineering is an interdisciplinary approach to analyse, design, and evaluation of complex sociotechnical systems [4]–[8]. There are a large number of methods for designing and evaluating interfaces [9]. Methods such as Cognitive Walkthrough (CWT), Cognitive Work Analysis [7] and Critical Decision Method, which allow the analysis of the activity through the cognitive processes associated with it. However, none of these methodologies creates a causal link between the user's cognitive process, their mental representation and the HMI used. Therefore, during the project we developed a method based on a cognitive walkthrough, observation of the activity and demographic data. This method makes it possible to collect the mental representation of the co-pilots who performed the scenario. We called this method MERIA, for Mental Representation Impact Analysis.
In a control room near the simulator two cognitive scientists observed the FO using two cameras placed in the cockpit. They identified the key elements of the FO’s performance. Just after completing the scenario, the FO underwent a cognitive debrief (CWT), with an aeronautical expert present to help understand the technical elements.
Fig. 5. Cognitive analysis during simulation.
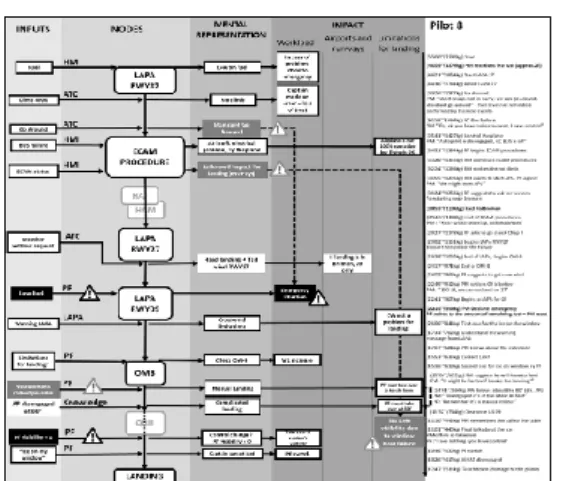
The results were represented through a matrix that includes in columns the chronological evolution of the events and in rows the link between interface and mental representation. This allows detection of interfaces that create good mental representations and those that do not. Mental misrepresentations are those that do not allow the co-pilot to understand the situation and therefore make good decisions.
Using these grids, workshops with the consortium's experts were able to determine HMI solutions that could solve the problems encountered by the co-pilots. As an example, for 6 of the 10 FOs, it was not easy to understand the technical failure in one of the scenarios and its impact on the choices to be made and landing.
Fig. 6. MERIA cognitive flowchart.
The solution chosen was to rank the list of inoperative systems according to the severity of the impact. In addition, an explanation of the impact of these inoperative systems was provided. This solution was then tested via a panel of 10 other FOs and all of them had a better mental representation of the failure and its consequences.
Fig. 7. Advanced HMI example.
6 Behavioural Measures
6.1 Pilot’s Acceptance and HPE Performance
The UX Acceptance Index, based on the adaptation of technology acceptance model [10], was deployed to systematically collect pilot’s “user experience” with the new HMI, administering 30 items that described five main dimensions (Perceived Ease of use, Perceived Usefulness, perceived impact on Workload, Situation Awareness and Decision Making). At the same time, the way the new HMI impacted on the pilot’s performance was investigated by the HPE Performance Curve (see figure below from one of the more challenging scenarios in Step 1). This allowed the Human-Factor experts to collect pilot’s narratives describing the variations in two HPE dimensions during four different moments of the flight scenario, enabling also a numerical representation of this experience.
Fig. 8. HPE curve example (Step1). 6.1.1 Ease of Use
Overall, the advanced HMIs used in Step 2 and Step 3, were considered more easy to use (Q3, Q6, Q7) than the current A320 cockpit F(1,20)=34.298, p<.001, ηp2=.985.
The browsing through flight detail information seemed to be easier thanks to the new NAV-Display and that impacted positively on the perceived performance efficacy. In the words of the pilots: “It was like comparing an I-Phone vs. an old Nokia model”. However, some negative remarks were provided for the touch-screen flaps: touchscreen flaps missed tactile feedback and that was foreseen to have negative impact on safety and to be more time consuming in performing task compared to physical flaps (that do not need additional visual attention to be manoeuvred).
6.1.2 Perceived Usefulness
The HMI in both steps was perceived more useful (Q5, Q8, Q9, Q17, Q22, Q24, Q25) than the current A320 interface F(1,20)=238.629, p<.001, ηp2=.993, especially
in supporting the pilots during the ECAM Procedure (M=4.35, SD=0.4) and also in reducing the likelihood of errors related to task-execution (M=4.60, SD=0.9). For general monitoring tasks (M=3.50, SD=1.1) and piloting tasks (M=3.20, SD=08), no particular improvement compared to the A320 interface were perceived in Step 2 and 3, mostly because there were “missing information in the present version of the HMI tested” (e.g. selected altitude on PFD, speed-bands for flap extensions, etc.). 6.1.3 Perceived Impact on Workload
Overall, the HMI in both steps was considered to better impact Workload (Q10, Q11) compared to the current A320 cockpit F(1,20)=289.360, p<.001, ηp2=.971,
especially in unexpected/abnormal situations (M=4.0; SD=0.8): “I like the presentation of INOPS system and resulting limitations. Everyone is seeing what is being done. You see what you have done without having constantly to keep it all in mind”.
6.1.4 Perceived Impact on Situation Awareness The HMI is considered to have an overall positive effect on Pilot’s Situation Awareness (Q12, Q13, Q19, Q20, Q21, Q28) compared to A320, but only for Step 3 pilots
F(1,20)=3.265, p=.035, ηp2=.601. The main difference
was mostly related to the contribution provided by the question on Tunnel Attention F(1,20)=6.785, p=.018, ηp2=.74 (“It showed me clearly that runway 27 was not
available, so it made me think about it: ‘Why not?”) and the question on Fuel Awareness F(1,20)=9.101, p=.007, ηp2=.336. Step 2 Pilots considered the new interface not
as effective for promoting fuel awareness, even compared to the regular A320 interface, while Step 3 Pilots, instead, considered the new HMI significantly more likely to increase their Fuel Awareness: “I was getting focused on repairing the failure, and I have this ‘fuel-circle’ closing in, it catches my attention on fuel immediately”.
Fig. 9. Advanced HMI solution. 6.1.5 Impact on Decision Making
Overall, the new HMI was perceived as more capable to support Pilot’s ability in some specific problem-solving situations (Q4, Q14, Q15, Q16, Q27, Q30) compared to current A320, but only for Step 3 pilots F(1,20)=6.000, p=.038, ηp2=.594. In particular, only one item was in the
main responsible for the statistical difference, that was the one referring to the “Decisions on Alternate Airports” (Q30) F(1,20)=5.444, p=.031, ηp2=.232: “In
the planning phase it will help for deciding alternate airport. You could look up at the information to do a real assessment, it is definitely something good...”
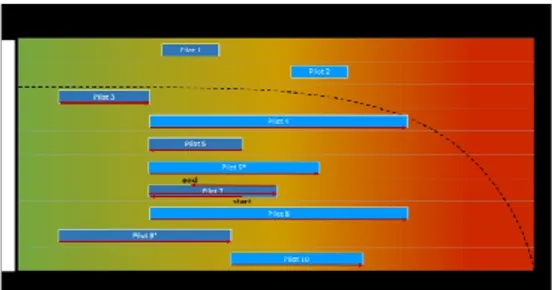
6.2 HPE Performance Curve Results
The overall scores of Performance x Load were calculated for all the 4 main points identified by the pilots. It appeared that all ten Step 2 pilots declared to be at the same starting point describing as relaxed and performing well (T1 M=54.00; SD=0.0), but all of them reached the worst levels of load in the sample towards the end of the scenario (T4 M=32.00; SD=11.3).
On the other hand, pilots in Step 3 already started to be more alerted since the beginning of the run (T1 M=47.70; SD=4.34), but without reaching the levels of critical Performance x Load levels reached on average by Step 2 pilots (Error! Reference source not found.).
The difference at T1 was statistically significant F(1,20)=21.000, p<.001, ηp2=.991. When asked to
describe the worst moments, in Step 2 four pilots reached their peak when making the decision on the airport to go to (pilots n. 21, 26, 27, 28). On the contrary, most of the Step 3 pilots reported to be already focused
from the beginning, because they had earlier the information on the “Fuel Situation” and that probably prevented them being caught off-guard when having to make the decisions about the alternate airport.
Fig. 10. Performance Curve Results : Step 2 on the left vs. Step 3 on the right
7 What have we learned?
The HPE concept, restricted to three factors, has been investigated, and the experiments demonstrated that the shape of this envelope evolves consistently with the events encountered within the scenarios. The HPE representation can be considered as a valid concept to assess the constraints that press on the crew: when the situation becomes more difficult to handle, the size of the envelope decreases. Nevertheless the dimensions used to represent the HPE space have to be coherently selected for the target scenario. They have to be as independent as possible while overlaying all the relevant facets of the target situation. As an example a factor related to fatigue should be used for a study about long range flights, while it was not necessary in the scenarios taken for this study.
The selection and evaluation of the contribution of relevant factors to the HPE concept is a decisive step and we recommend relying on experiments allowing a controlled manipulation of these factors. In our study, this part had been done thanks to pre-experiments and scenario 1 where events dedicated to modify one (or few) dimensions of the HPE were used. Controlling the influence of typical events on the shape of the HPE is a necessary step before designing more complex and realistic scenarios. As the HPE combines several connected dimensions it is highly recommended to apprehend how they evolve and combine in elementary situations before using this construct in a more complex scenario.
The assessment of the evolution of these factors can sometimes be done thanks to psycho-physiological measures. The study confirmed that the use of ECG and eye-tracking is relevant to track on time the evolution of this envelope. While the shape of the HPE at one time can be evaluated and used to better describe the pressure of the situation on the crew, it is more difficult to use it to predict performance, and the ‘edges’ of performance.
This HPE study confirms that there is not a linear relationship between HPE factors and performance. When task difficulty and operational pressure rise, the shape of the envelope is lowered, but the crew adapts
their behaviour as long as possible to maintain reasonable performance. Therefore it would be beneficial to conduct dedicated controlled experiments to assess if physiological measures could be used to detect when the crew reaches the edge of the HPE and performance really decreases.
The experiment also pinpoints the difficulty in assessing performance in a real flight. In many cases, there are no “continuous” performance indicators but rather adequate decisions which are or are not taken by the crew. So a key element is rather how the crew considers all the elements of the situation and makes decisions. Therefore it should be relevant to progress on methodologies and tools to better analyse eye tracking and electro-encephalography data. A combination of these elements could indicate which information is taken (eye-tracking) and how it is processed by the operator.
Finally, the study should also be extended to better apprehend the HPE and performances of the crew. This study has been made with a cooperative captain and the evaluation of the HPE was made on the first officer. This was necessary to develop and test the concept. Nevertheless, in a real flight, performances and decisions are always supported by both crew members, and it would be valuable to explore how these elements can be extended to a team.
8 What does it all mean for the pilot? A
word from a Captain
The life of a pilot is easy – when everything works fine. But whenever a technical abnormal occurs, the situation can change within seconds. Out of nowhere, an excellent collaboration and communication with the other pilot, air traffic control and the cabin crew is necessary. The quality of automation and the human machine interface during the abnormal define the amount of resources available to the pilots. The more resources, the better the pilot’s situational awareness and, in consequence, their decision making. In this study, and like on all of today’s air planes, pilots have two computers systems available. The ECAM system of the aircraft and an electronic device called EFB from the airline:
The ECAM (electronic centralized aircraft
monitoring system) is built into the aircraft and is part of the certification process of the manufacturer. It is usually in a middle screen so that both pilots can work with it. The interface is up to the manufacturer, as it is part of the certification process. As the certification process is very complex and time consuming, only minor changes may be conducted. During initial training, pilots learn to handle the ECAM abnormals and study its systems.
The EFB (electronic flight bag) is an add-on,
depending on the choice of the individual company. Usually it is a Microsoft or Apple tablet device that includes multiple additional functions and company documentation. It supports the pilots both in normal and in abnormal situations. In the normal operation, it helps to improve the processes and efficiency of the operation, and during abnormal operation it offers all kind of
information which helps the pilots to gather safety relevant information whenever needed.
There is a big security concern that a virus from an external device might take over control of the aircraft and its systems. Therefore, due to security reasons, both computers have a very limited interface.
Many abnormal handlings are already executed by computers. The new delivered Airbus A350 can perform an auto descent after detecting a high cabin altitude which requires an emergency descent. The further improvement of the flight control systems increases in cadence with the increase of computer processing power. Despite the constant training of abnormal situations in the simulator, the key to success will be the quality of support provided by the computers. As the aircraft systems may not be changed due to certification, the focus will be on an additional device like the EFB. Similar to the invention of the iPhone, the EFB has the opportunity to provide the pilot with all necessary information.
The quality of help will depend on the information it has available and on the ergonomic handling of the device. Computers that store relevant information like a library with alphabetic order are likely to fail the needs of pilots. During time pressure, cognitive computing is necessary. Cognitive computing may tell us where to land, how much fuel and time we have left, or point on something we might have forgotten: everything a pilot needs in that specific situation, with the right presentation given the situation’s context and priorities. Cognitive computing is by definition, “the ability of computers to simulate and complement human’s cognitive abilities of decision making”. The computer will not take over the decision making by the pilot. The responsibility and liability will still remain with the pilot and the computer may be considered as a guide to support the pilot’s decision making.
Artificial intelligence may only be incorporated if the pilot knows the basis of his decision and if he has the final decision. AI is expected to solve problems that people are not even aware of, or, in other words, to make decisions on their own, thus minimizing the role of humans. This is a common misunderstanding of what AI is supposed to do on board of an airplane. Due to the present liability issues and the exceptional high demand for safety in aviation, a computer will not any time soon be reliable for the safe conduct of a flight.
This study of Future Sky Safety points the way to defining the limits of human performance. The pilot must always be aware of their situational awareness and know the risk of the present flight situation. The EFB will be the only device able to support the pilot with necessary information. The path for a future single pilot operation will depend on the abilities of the EFB and its ergonomic interface with the pilot. Present research could clarify that autonomous flights with passengers and no pilots on board is still some way off in the future.
9 Conclusions
This study has found ways of influencing, measuring and tracking three key human factors in flight upset situations – workload, stress and situation awareness – in dynamic and realistic cockpit simulation experiments. The methods have also been used to identify and validate cockpit HMI changes to improve performance in demanding scenarios. The Human Performance Envelope approach therefore offers a new way to increase the safety and resilience of human performance in flight upset and other risk-based situations, and so could be considered as a means to improve pilot training and future cockpit design.
References
1. O. Chételat, et al. Clinical validation of LTMS-S: A wearable system for vital signs monitoring. 37th Annual International Conference of the IEEE Engineering in Medicine and Biology Society (EMBC), Milan, 2015, pp. 3125-3128. (2015) 2. B. Cinaz, et al. Monitoring of mental workload
levels during an everyday life office-work scenario. Personal and Ubiquitous Computing, 17(2), pp. 229-239 (2013)
3. D. M. Pendleton, et al. Mental engagement during cognitive and psychomotor tasks: Effects of task type, processing demands, and practice. International Journal of Psychophysiology, 109, pp.124-131, (2016)
4. J. Dowell and J. Long, ‘Target paper: conception of the cognitive engineering design problem’, Ergonomics, vol. 41, no. 2, pp. 126–139, (1998)
5. S. J. Andriole and L. Adelman, Cognitive systems engineering for user-computer interface design, prototyping, and evaluation. L. Erlbaum Associates Inc., (1995)
6. J. Rasmussen, A. M. Pejtersen, and L. P. Goodstein, ‘Cognitive systems engineering’, 1994.
7. K. J. Vicente, Cognitive work analysis: Toward safe, productive, and healthy computer-based work. CRC Press, (1999)
8. J. D. Lee and A. Kirlik, Eds., The Oxford handbook of cognitive engineering. New York: Oxford University Press, (2013)
9. N. A. Stanton, Human factors methods: a practical guide for engineering and design. Burlington, VT: Ashgate Publishing Company, (2013)
10. F. Biassoni, D. Ruscio, & R. Ciceri, Limitations and automation. The role of information about device-specific features in ADAS acceptability. Safety
science, 85, 179-186, (2016)
Funding and Disclaimer:
Future Sky Safety received funding from the European Union’s Horizon 2020 research and innovation program under grant agreement 640597. Any dissemination reflects the authors’ views only and the European Commission is not responsible for any use that may be made of information it contains.