ADOPTED: 13 September 2016 doi: 10.2903/j.efsa.2016.4578
Assessing the health status of managed honeybee
colonies (HEALTHY-B): a toolbox to facilitate
harmonised data collection
EFSA Panel on Animal Health and Welfare (AHAW)
Abstract
Tools are provided to assess the health status of managed honeybee colonies by facilitating further harmonisation of data collection and reporting, design of field surveys across the European Union (EU) and analysis of data on bee health. The toolbox is based on characteristics of a healthy managed honeybee colony: an adequate size, demographic structure and behaviour; an adequate production of bee products (both in relation to the annual life cycle of the colony and the geographical location); and provision of pollination services. The attributes ‘queen presence and performance’, ‘demography of the colony’, ‘in-hive products’ and ‘disease, infection and infestation’ could be directly measured in field conditions across the EU, whereas ‘behaviour and physiology’ is mainly assessed through experimental studies. Analysing the resource providing unit, in particular land cover/use, of a honeybee colony is very important when assessing its health status, but tools are currently lacking that could be used at apiary level in field surveys across the EU. Data on ‘beekeeping management practices’ and ‘environmental drivers’ can be collected via questionnaires and available databases, respectively. The capacity to provide pollination services is regarded as an indication of a healthy colony, but it is assessed only in relation to the provision of honey because technical limitations hamper the assessment of pollination as regulating service (e.g. to pollinate wild plants) in field surveys across the EU. Integrating multiple attributes of honeybee health, for instance, via a Health Status Index, is required to support a holistic assessment. Examples are provided on how the toolbox could be used by different stakeholders. Continued interaction between the Member State organisations, the EU Reference Laboratory and EFSA is required to further validate methods and facilitate the efficient use of precise and accurate bee health data that are collected by many initiatives throughout the EU. ©2016 European Food Safety Authority. EFSA Journal published by John Wiley and Sons Ltd on behalf of European Food Safety Authority.
Keywords: Honeybee, colony, health, field, attribute, indicator, toolbox Requestor: EFSA
Question number: EFSA-Q-2015-00047 Correspondence: [email protected]
Panel on Animal Health and Welfare (AHAW) members: Miguel Angel Miranda, Dominique Bicout, Anette Botner, Andrew Butterworth, Paolo Calistri, Klaus Depner, Sandra Edwards, Bruno Garin-Bastuji, Margaret Good, Christian Gortazar Schmidt, Virginie Michel, Simon More, Søren Saxmose Nielsen, Mohan Raj, Lisa Sihvonen, Hans Spoolder, Jan Arend Stegeman, Hans H. Thulke, Antonio Velarde, Preben Willeberg, Christoph Winckler
Acknowledgements: The AHAW Panel wishes to thank the HEALTHY-B working group members G!erard Arnold, Thomas David Breeze, Howard Browman, Magali Chabert, Margaret Couvillon, Gianni Gilioli, Pascal Hendrikx, Daniel Oberski, Chiara Polce, Marie-Pierre Rivi"ere, Ullrika Sahlin, Simone Tosi; the EFSA Panel on Plant Health (PLH); Claude Bragard, David Caffier, Thierry Candresse, Elisavet Chatzivassiliou, Katharina Dehnen-Schmutz, Gianni Gilioli, Jean-Claude Gregoire, Josep Anton Jaques Miret, Michael Jeger, Alan MacLeod, Maria Navajas Navarro, Bjoern Niere, Stephen Parnell, Roel Potting, Trond Rafoss, Vittorio Rossi, Gregor Urek, Ariena Van Bruggen, Wopke Van Der Werf, Jonathan West and Stephan Winter; the hearing experts: Ann Alix, Koos Biesmeijer, Etienne Bruneau, Martin Dermine, Franc!ois Diaz, Thierry Grollier, Walter Haefeker, Klemens Krieger, Hans Mattaar, Simone Tosi, Rom!ee Van der Zee, Geoffrey Williams for the preparatory work on this scientific opinion and EFSA staff members: Domenica Auteri, Edoardo Carnesecchi, Gilles Guillot, Eliana Lima, Agnes Rortais, Giorgio Sperandio, Franz Streissl, Frank Verdonck, Stefania Volani and Sybren Vos for the support provided to this scientific opinion.
Suggested citation: EFSA AHAW Panel (EFSA Panel on Animal Health and Welfare), 2016. Scientific opinion on assessing the health status of managed honeybee colonies (HEALTHY-B): a toolbox to facilitate harmonised data collection. EFSA Journal 2016;14(10):4578, 241 pp. doi:10.2903/j.efsa.2016.4578 ISSN: 1831-4732
©2016 European Food Safety Authority. EFSA Journal published by John Wiley and Sons Ltd on behalf of European Food Safety Authority.
This is an open access article under the terms of the Creative Commons Attribution-NoDerivs License, which permits use and distribution in any medium, provided the original work is properly cited and no modifications or adaptations are made.
The EFSA Journal is a publication of the European Food Safety Authority, an agency of the European Union.
Summary
The European Food Safety Authority (EFSA) asked the Panel on Animal Health and Welfare (AHAW) to generate a toolbox to facilitate data collection to support assessing the health status of managed honeybee colonies. The mandate requested identification of the main characteristics of a healthy honeybee colony, which data can be collected in field surveys across the European Union (EU), how to measure and report variables in a harmonised manner and how data on bee health could be analysed.
This scientific opinion aimed to provide an overview of tools that could be used in the assessment of bee health, which is an element of a larger process to achieve EFSA’s objective to evolve towards an integrated risk assessment approach for bees. Any analysis of bee health is recommended to start by defining the goals and purpose of the analysis, and then work backward to the analysis approach and data collection effort needed to achieve those goals. In this opinion, the objective of a bee health assessment is not specified in detail to enable any organisation involved in such activities to select tools from the generated HEALTHY-B toolbox according to their specific objectives. For instance, it is recommended to use the tools that are relevant across the EU (e.g. for Varroa quantification) and select some additional tools that are specific for a given area in the EU (e.g. for small hive beetle detection). The long-term objective is to improve test method validation, data collection, reporting and analysis across the EU, which will facilitate risk assessment on bee health by the national and the European risk assessment bodies. This guidance, in fact, provides a set of tools that are or could be harmonised, validated and suitable for data analysis and comparisons, without imposing too rigid a framework. More than one validated protocol might be used to measure an indicator or factor if the collected data can be merged in the analysis phase. Interaction between many stakeholders is required to bring test method validation and data collections forward. Beekeepers are an important target audience for this paper because they play a major role in collecting data in the field and their subsequent submission to the scientific community. In-depth training of beekeepers and bee inspectors is key as the quality of the analysis is dependent on the accuracy and precision of the collected data.
Bee health is considered in this opinion in its broader sense, meaning that it is dependent on several high-level characteristics that describe bee health in a holistic manner at the colony level. A colony of managed honeybees was defined as an Apis mellifera bee population kept by a beekeeper with the presence of a given queen. Replacement of the queen by a natural process or by a beekeeper is considered to result in a new colony because it changes the genetics of the population. Based on a scoping of the scientific literature and subsequent discussion by working group (WG) members and hearing experts representing different stakeholders, it was concluded that the characteristics of a healthy managed honeybee colony are: an adequate size, demographic structure and behaviour in relation to the annual life cycle of the colony and the geographical location; an adequate production of bee products in relation to the annual life cycle of the colony and the geographical location; and provision of pollination services. The identification of these characteristics served as the basis for the development of a hierarchical approach. The highest hierarchical level consists of three overarching concepts that reflect the multidimensional characteristics of: (i) a managed honeybee colony; (ii) its habitat and management; and (iii) its productivity from the perspective of human interest, referred to as ‘colony attributes’, ‘external drivers’ and ‘colony outputs’, respectively. The three overarching concepts can be assessed via multiple sets of abiotic or biotic components, called ‘indicators’ (associated with colony attributes and colony outputs) or ‘factors’ (associated with external drivers).
An overview of the identified indicators and factors from field surveys was made and was used as a basis to generate summaries presented in the form of mind maps on indicators and factors for colony attributes, external drivers or colony outputs. The indicators and factors were scored (high or low) for their relevance to the health status of a managed honeybee colony or the relevance to understanding the context of a managed honeybee colony, respectively; for their technical feasibility in the context of field surveys; and priority for inclusion in field surveys across the EU. The indicators and factors with an H-HH score (H-HH meaning High relevance, High technical feasibility and High priority) were further scrutinised to identify the most relevant variable(s) and method(s) to quantify them. The opinion provides detailed information on the available test methods, suggesting which of these are most suitable for implementation in field surveys across the EU and specifying the most appropriate reporting units. The identification, scoring, measurement and reporting of indicators and factors have been discussed by scientists, beekeepers, risk managers and representatives of other stakeholder groups during a workshop to collect scientific evidence that was not yet identified by the WG.
Indicators describing the colony attributes ‘queen presence and performance’, ‘demography of the colony’, ‘in-hive products’ (including their contaminants) and ‘disease, infection and infestation’ can be
measured in field surveys across the EU although efforts are required to implement these in a harmonised manner. In particular, the generation of detailed protocols and the validation of many test methods are necessary. The colony attribute ‘behaviour and physiology’ is difficult to measure in field surveys and the available technology is currently restricted to experimental studies, except for the detection of explicit atypical behaviour. External drivers of honeybee health consist of factors related to the resource providing unit (RPU; environmental components around the hive including contaminants), environmental drivers (weather and climate) and beekeeping management practices. Analysing the RPU, in particular land cover/use, of a honeybee colony is very important when assessing the health status of a colony, but it currently lacks tools that could be used at the apiary level in field surveys across the EU. Data on ‘beekeeping management practices’ and ‘environmental drivers’ can be collected via questionnaires and available databases, respectively. Some existing databases containing relevant (and validated) data to assess bee health are listed, but efforts are required to further increase the public accessibility of these data. For the attribute ‘colony outputs’, provisioning services can be analysed mainly for harvested honey, whereas technical limitations hamper the assessment of regulating services (such as the pollination of wild plants) in field surveys across the EU. Moreover, there is a significant lack of information that quantitatively links pollination services to colony health; however, using modelling approaches it is possible to link pollination services with other colony attributes and external drivers. In a multifactorial risk assessment of honeybees, the impacts on pollination services should be estimated.
Overviews of indicators and factors related to bee health are provided (Chapter 3) and a selection has been made of those that could be included in a field survey across the EU (Chapter 3 and summary in Chapter 4). It is clear that the design of detailed, harmonised protocols and the validation of several tools together with adequate training are required, before multiannual collection of data and their analysis would be possible in a harmonised manner at the EU level, in particular if accurate and precise quantitative data are required. The subsequent chapters provide guidance on key elements to consider when designing a field survey (Chapter 5) and analysis of bee health data (Chapter 6).
The key elements to consider in the stage of designing a field survey are: (i) carefully designing and implementing each aspect of the survey; (ii) ensuring that ample resources are dedicated to this aspect of the project; and (iii) ensuring in advance of any data collection that the design choices allow for the desired analyses. Reference is made to several guidance documents that are available in the public domain and that are recommended to consult whenever more detailed information is required.
As specified above, there are no a priori key variables representing unequivocally the health status of a honeybee colony because this is influenced by many variables and their interactions. Therefore, multiple indicators should be considered jointly in an analysis of bee health. Chapter 6 gives a short overview of sensible approaches to integrate data on bee health to provide an overall outcome. There are many suitable approaches available and four are described: (i) multivariate analysis, (ii) expert-driven classification, (iii) causal modelling and (iv) process-based modelling. These approaches are related to each other and can overlap. The first two approaches represent alternative ways to define a Health Status Index (HSI) in a way that the assessment is based on more than one indicator, whereas the third and fourth approaches describe ways to link factors to health and to model changes in health.
The information provided in this opinion is a basis to facilitate harmonised data collection across the EU, without predefining a specific objective. The latter was a decision made to allow use of the HEALTHY-B toolbox when bee health is assessed in relation to various objectives and analysis goals. However, not defining a specific objective and analysis goal made it difficult for the authors to be very precise in the selection of indicators, factors, methods and the formulation of recommendations. As a consequence, further actions will be required to translate the information provided in this document into a study protocol that can be implemented in practice and that is in line with a clearly defined objective. Chapter 7 provides some examples on the possible use of the HEALTHY-B toolbox by different stakeholder groups: monitoring and comparison of honeybee health over time and across geographical space, identification of possible factors and indicators that can predict changes in the health status of a managed honeybee colony, pesticide risk assessment in the context of multiple stressors.
Intensive data collections at a few places across Europe are required to develop an HSI and risk assessment models. In addition, an epidemiological study involving many apiaries across the EU is necessary to provide complementary information to analyse the relative importance of different stressors, which could then be incorporated in the HSI and/or used by relevant models. The required
precision and accuracy of the data will be important in the test method selection and defining the role of beekeepers and bee inspectors in the data collection.
The HEALTHY-B toolbox is currently used in EFSA’s Multiple Stressors in Bees (MUST-B) project, which aims to develop a predictive model that could be used as a tool by risk assessors and managers to determine risks of pesticides in honeybee colonies under different scenarios of exposure to multiple stressors. Several stakeholders could benefit by applying the toolbox, for instance via harmonisation of data collection/reporting, more efficient use of data collected across the EU, beekeeper involvement in bee health assessments, and a basis on which to develop online tools that are mutually beneficial to beekeepers, scientists and risk assessors/managers.
Table of contents
Abstract... 1
Summary... 3
1. Introduction... 8
1.1. Background and Terms of Reference as provided by the requestor... 8
1.2. Interpretation of the Terms of Reference... 9
1.3. Target audience... 10
2. Data and methodologies... 11
2.1. Hierarchical approach... 11
2.1.1. Identification of the overarching concepts of a managed healthy honeybee colony... 11
2.1.2. Identification of indicators and factors... 12
2.1.3. Identification of variables and methods... 12
2.2. Procedure for selection of indicators and factors... 12
2.2.1. Procedure and scoring system used... 12
2.2.2. Data collection in field surveys... 14
2.3. Workshop... 15
3. Assessment... 16
3.1. Identification of the colony attributes, external drivers and colony outputs (TOR1)... 16
3.1.1. Characteristics of a managed healthy honeybee colony... 16
3.1.2. Colony attributes... 16
3.1.3. External drivers... 16
3.1.4. Colony outputs... 17
3.2. Colony attributes reflecting the health status of a managed honeybee colony (TOR2–3)... 17
3.2.1. Queen presence and performance... 17
3.2.1.1.Identification of indicators related to queen presence and performance (TOR2)... 17
3.2.1.2.Methods and tools to measure indicators related to queen presence and performance (TOR3)... 18
3.2.2. Demography of the colony... 20
3.2.2.1.Identification of indicators related to demography of the colony (TOR2)... 20
3.2.2.2.Methods and tools to measure indicators related to demography of the colony (TOR3)... 22
3.2.3. In-hive products... 24
3.2.3.1.Identification of indicators related to in-hive products (TOR2)... 24
3.2.3.2.Methods and tools to measure indicators related to the in-hive products (TOR3)... 27
3.2.4. Behaviour and physiology of the bees... 29
3.2.4.1.Identification of indicators related to behaviour and physiology of the bees (TOR2)... 29
3.2.4.2.Methods and tools to measure indicators related to behaviour of the bees (TOR3)... 33
3.2.5. Disease, infection and infestation... 34
3.2.5.1.Identification of indicators and methods related to disease (TOR2 and TOR3)... 34
3.2.5.2.Identification of indicators related to infection or infestation (TOR2)... 35
3.2.5.3.Methods and tools to measure indicators related to infection or infestation (TOR3)... 38
3.3. External drivers affecting the health status of a managed honeybee colony (TOR2-3)... 40
3.3.1. Resource providing unit (TOR2)... 40
3.3.1.1.Relevance of the RPU factors to the bee health status of a colony... 41
3.3.1.2.Technical feasibility and priority to include RPU factors in field surveys... 42
3.3.1.3.Methods and tools to measure factors related to RPU (TOR3)... 43
3.3.2. Environmental drivers (TOR2)... 45
3.3.2.1.Relevance of the environmental drivers to the bee health status of a colony... 46
3.3.2.2.Technical feasibility and priority to include factors on environmental drivers in field surveys... 46
3.3.2.3.Methods and tools to measure factors related to environmental drivers (TOR3)... 46
3.3.3. Beekeeping management practices... 47
3.3.3.1.Relevance of the beekeeping management practices to the bee health status of a colony... 48
3.3.3.2.Technical feasibility and priority to include factors on beekeeping management practices in field surveys 49 3.3.3.3.Methods and tools to measure factors related to beekeeping management practices (TOR3)... 50
3.4. Colony outputs (TOR2-3)... 53
3.4.1. Relevance of colony outputs to the bee health status of a colony... 53
3.4.2. Technical feasibility and priority to include colony output indicators relevant to bee health status in field surveys... 54
3.4.3. Methods and tools to measure factors related to colony outputs... 54
4. Field data collection: which indicators and factors to include across the EU... 55
5. Field data collection: considerations during survey design (TOR4)... 57
5.2. Data management and analysis system... 59
6. Field data collection: options for data analysis (TOR4)... 59
6.1. Background... 59
6.2. Analysis output: goals of a bee health analysis... 60
6.2.1. Descriptive... 60
6.2.2. Explanatory (sometimes called ‘diagnostic’)... 60
6.2.3. Predictive... 61
6.2.4. Prescriptive... 61
6.3. Analysis production: approaches to modelling bee health... 62
7. Use of the toolbox for different objectives and by different stakeholder groups... 63
7.1 Example 1 – Monitoring and comparison of honeybee health over time and across geographical space... 64
7.1.1. Background and objective... 64
7.1.2. What is an HSI for managed honeybee?... 64
7.1.3. How does the HEALTHY–B toolbox help to generate an HSI?... 64
7.1.4. How could the HSI be used?... 65
7.2. Example 2– Identification of key predictors of change in honeybee health... 66
7.2.1. Background and objective... 66
7.2.2. How does the HEALTHY–B toolbox help to identify key health (status) predictors?... 66
7.2.3. How could prediction of changes in bee health status be used?... 66
7.3. Example 3– Pesticide risk assessment on honeybee health in the context of multiple stressors... 67
7.3.1. Background and objective... 67
7.3.2. How does the HEALTHY–B toolbox help to introduce a holistic perspective into pesticide risk assessment? 68 7.3.3. How could a holistic pesticide risk assessment be used?... 68
8. Conclusions and recommendations... 69
8.1. Overarching TORs 1-4... 69
8.1.1. Overarching conclusions... 69
8.1.2. Overarching recommendations... 70
8.2. TOR1: Identification of the colony attributes, external drivers and colony outputs... 70
8.2.1. TOR1-specific conclusions... 70
8.3. TOR2: Identification of indicators and factors relevant to measuring colony attributes, external drivers and colony outputs. TOR3: Methods and tools to measure indicators and factors relevant to measuring colony attributes, external drivers and colony outputs... 71
8.3.1. Specific conclusions and recommendations on ‘colony attributes’... 71
8.3.2. Specific conclusions and recommendations on ‘external drivers’... 72
8.3.3. Specific conclusions on ‘colony outputs’... 72
8.4. TOR4: Propose a methodological approach to allow robust and harmonised measurement and comparison of regional bee health status... 73
8.4.1. TOR4-specific conclusions... 73
References... 73
Glossary... 93
Abbreviations... 95
Appendix A– Examples of European studies monitoring bee health... 96
Appendix B– Categorisation of identified indicators and factors... 97
Appendix C– Measurement of selected indicators and factors... 165
Appendix D– Clinical signs of disease... 215
Appendix E– Contaminants in bee products... 219
Appendix F– Worker behaviour catalogue... 222
Appendix G– Protocol for data collection by the beekeeper on indicators scored as H–HH... 223
1.
Introduction
1.1.
Background and Terms of Reference as provided by the requestor
The way that stressors (mainly biological, chemical and environmental) affect honeybees (Apis mellifera) and contribute to losses in bee populations is poorly understood. The underlying mechanisms remain unclear due to the complex nature of the potential combinations and permutations of stressors acting simultaneously and the effects of interactions between them.
In 2008, the European Food Safety Authority (EFSA) conducted a survey of existing bee surveillance systems in the European Union (EU; EFSA, 2008). Subsequently, the European Commission established an EU Reference Laboratory (EURL) for honeybee health1 and funded an EU-wide monitoring programme on honeybee mortality events and the prevalence of specific bee pathogens in Europe (EPILOBEE2). However, given the large data set, high number of variables that are not yet fully analysed, and the absence of data on the monitoring of other bee stressors (i.e. chemical and environmental factors), the results from EPILOBEE must be considered preliminary.
EFSA seeks to develop, by 2018–2019, an integrated risk assessment approach for bees taking into account the multifactorial aspects of honeybee colony losses and weakening via the Multiple Stressors in Bees (MUST-B) project. In the present mandate, EFSA seeks to define: (i) what is meant by a ‘healthy honeybee colony’ and (ii) how can the health status of a honeybee colony be assessed in a robust and harmonised manner. The answers to these questions will provide guidance for designing studies that aim at systematically collecting data and analysing the health status of honeybee colonies in their natural environment at scales ranging from local through regional to international. Considered in a holistic sense, ‘health’ encompasses not only to the absence of pathogens and/or pests, but also, for instance, the capacity of the colony to produce honey and provide pollination services.
Information is already available on colony attributes that influence and/or determine the health status of a honeybee colony, as well as approaches and methodologies that assess honeybee health status. However, there is a need for a harmonised framework defining the indicators that should be measured when assessing the health status of a honeybee colony in large field surveys, which are agreed upon (and practical to implement) by stakeholders and feasible when applied at regional, national or international levels. This would result in more harmonised data collections in field surveys and hence facilitate meta-analysis and the inclusion of data in risk assessments. This framework should include indicators to measure the effects of the main biological, chemical and environmental stressors that affect the health status of a honeybee colony. In particular, the early signs of a deterioration in health need to be established. Harmonised frameworks have been developed for other multifactorial systems, such as the generation of an approach to assess animal welfare (EFSA Panel on Animal Health and Welfare, 2012; Welfare Quality Project3) and the environmental risk assessment of plant pests (EFSA Panel on Plant Health, 2011). It may be possible to apply elements of these methodologies – with appropriate modifications – to assess the health status of a honeybee colony. Although this mandate does not primarily aim to provide practical guidance to beekeepers on how to perform regular health checks of honeybee colonies, the framework could be used to assess the health status of one or a small number of colonies (e.g. within one apiary).
Once a framework is established, an inventory of available validated methods/tools that could be used to assess the health status of a honeybee colony in large-scale field surveys will be developed. This inventory should seek to identify gaps in our capacity to measure the health status of a large number of bee colonies in a relatively short time and hence recommend where method development and/or validation are required. Further, there is a need to provide guidance on how the data obtained from a survey could be analysed to ensure that data are collected appropriately, to allow for a harmonised interpretation across different ecosystems and to ensure applicability for future risk assessments. A colony of honeybees can cope with more stress than an individual honeybee, and this capacity might change seasonally and in relation to environmental conditions (to take into account regional differences across the EU Member States).
The output of this mandate is intended for use in two subsequent activities of the MUST-B project: (i) the design of protocols and field methods, and the calibration of tools, to allow robust and
1 Commission Regulation (EU) No 87/2011.
2 http://ec.europa.eu/food/animals/live_animals/bees/study_on_mortality/index_en.htm 3 http://www.welfarequality.net/everyone/26559/7/0/22
harmonised assessment of honeybee colony health status; and (ii) the design and completion of a multifactorial honeybee colony field survey.
Terms of Reference:
1) Identify and define the main colony attributes of a healthy honeybee colony.
2) Establish a framework that could be used to allow robust and harmonised measurement of the health status of a honeybee colony in field surveys.
3) Assess the availability of validated methods/tools for measuring indicators of honeybee colony health in field surveys.
4) Propose a methodological approach to allow robust and harmonised measurement and comparison of regional bee health status.
1.2.
Interpretation of the Terms of Reference
Bee health is considered in its broader sense, meaning that it is dependent on several high-level characteristics describing bee health in a holistic manner at the colony level. The characteristics that should be taken into account when assessing the health status of a managed honeybee colony are defined in Terms of Reference (TOR) 1. These are the basis of a hierarchical approach that has been developed. The highest hierarchical level consists of three overarching concepts that reflect the multidimensional characteristics of: (i) a managed honeybee colony; (ii) its habitat and management; and (iii) its productivity from the perspective of human interest, referred to as ‘colony attributes’, ‘external drivers’ and ‘colony outputs’, respectively (Table 1). The three overarching concepts can be assessed via multiple sets of abiotic or biotic components, called ‘indicators’ (associated with colony attributes and colony outputs) or ‘factors’ (associated with external drivers). The indicators and factors are considered to reflect the overarching concepts and can be derived by measuring one or more variables. For instance, ‘queen potential fecundity’ is an indicator describing the attribute ‘queen presence and performance’. This indicator could be informed by measuring one of the following variables: viable egg-laying by the queen, rate of drones being laid, number of new queen cells per swarming event, and mating success (number of patrilines). TOR2 describes the biological relevance of indicators and factors regarding the health status of a managed honeybee colony. A ranking is presented for technical feasibility and priority for inclusion of an indicator or factor in field surveys that could be implemented across the EU.
Each indicator or factor can be described by one or more ‘variables’, which are quantified using a specific ‘method’. TOR3 assesses the fitness for purpose and availability of methods to estimate the colony health status and that could be implemented in most Member States. However, it is clear that the generation of detailed protocols and the validation of many test methods are necessary before they can be implemented across the EU in a harmonised manner. Regarding data acquisition and analysis, the outputs of TOR2 and TOR3 should facilitate a comparison of data on the health status of managed honeybee colonies from different European regions. They should also assist the development of a harmonised data model, the merging of data sets and implementation of meta-analysis at the national and European level.
TORs 1–3 describes the current understanding of indicators and factors related to bee health, whereas TOR4 looks into the future and provides guidance on what to do when a field survey is planned. References are provided to documents giving guidance on the design of data collections. It also provides guidance to design the analysis and field data collection with respect to assessing the health status of managed honeybee colonies. This part of the scientific opinion describes that first the objective of a field survey should be defined (expected output), then the method(s) for data analysis should be selected and finally the collection of data should be designed and performed. Different types of outputs are presented and a description is provided of the main characteristics of some methods that might be relevant to analysis of the health status of honeybee colonies. It is intended to give an overview of some existing methods, explaining how they could be used and which important aspects have to be considered when designing a data collection.
1.3.
Target audience
Understanding the effects of indicators and factors on bee health requires information from several geographical areas, preferably collected at the same time. Collecting and comparing data between areas is a very complex task due to the heterogeneity of the European apicultural sector across the EU (Chauzat et al., 2013; Deloitte, 2013), let alone the environmental heterogeneity. This scientific opinion aims to provide an overview of tools that could be used for the assessment of bee health, which is an element of a larger process to achieve EFSA’s objective of evolving towards an integrated risk assessment approach for bees. Efforts to improve test method validation, data collection, reporting and analysis across the EU will facilitate risk assessment on bee health by national and European risk assessment bodies. This guidance, in fact, provides a set of tools that are harmonised and would allow data analysis and comparisons, without imposing a too rigid framework. More than one protocol might be used to measure an indicator or factor if these generate data that can be merged in the analysis phase. One could use tools that are relevant across the EU (e.g. for Varroa quantification) and select some additional tools that are specific for a given area in the EU (e.g. for small hive beetle detection). Beekeepers play a major role in collecting data in the field and are, therefore, an important target audience for this paper, in particular, guiding them on how data could be submitted to the scientific community. Chapters 5 and 6 cover key elements on the design of a field survey and provide some examples on how data on bee health could be analysed, as an introduction to anybody planning a field survey and to indicate the requirement of a multidisciplinary team when assessing bee health in a holistic manner. Furthermore, as illustrated in Figure 1, connecting new and existing open databases with information that is reliable and relevant to bee health would increase the openness and transparency of risk assessment and would facilitate using the data for other purposes, such as management and decision-making processes by beekeepers and/or officials at a regional, national or international level.
Table 1: Hierarchical approach– levels of assessment and definitions
LEVEL 1 External drivers Colony attributes Colony outputs Overarching
concepts
Multidimensional
characteristics of the colony habitat and management. Can only be assessed indirectly
Multidimensional
characteristics that are an integral part of a
health status of a managed honeybee colony. Can only be assessed indirectly
Multidimensional characteristics expressing the productivity of a managed honeybee colony from the perspective of human interest. Can be assessed both directly both indirectly
LEVEL 2 Factors Indicators Indicators
Abiotic or biotic components
A set of factors is used to assess the external drivers
A set of indicators is used to assess the colony attribute
A set of indicators is used to assess the colony outputs LEVEL 3 Variables
Measurable quantities identified for each indicator and factor. One or more variables are used to estimate each indicator or factor
LEVEL 4 Methods
Practical procedure to quantify the variable. One or more methods are available to estimate the same variable
DATA COLLECTION TOOLS FOR ASSESSMENT OBJECTIVE OF THE ASSESSMENT MANAGEMENT AND DECISION MAKING OPEN DATABASE
Figure 1: The objective of this scientific opinion is to provide an overview of tools that could be used for the assessment of bee health, which is part of a larger process to achieve EFSA’s objective to evolve towards an integrated risk assessment approach for bees to further facilitate science-based management and decision making
Definition of the objective will help identify which tools are selected for the assessment. In this scientific opinion, the aim is to facilitate harmonised data collection to assess the health status of a managed honeybee colony from a holistic perspective and following a framework that can be applied across the EU (see Section 2.2.2). The identified methods/tools will allow further harmonisation of data collections on bee health within Europe and should facilitate more robust data analysis in a context of simultaneous exposure to different stressors and continuously changing environmental conditions. Further actions will be required to translate the information provided in this document into a precise study protocol and to validate test methods that can be implemented in practice and are in line with a clearly defined objective.
The toolbox described in this scientific opinion can be consulted by everybody involved in measuring, reporting and analysing bee health in the EU. It will also be used by the EFSA MUST-B working group (WG) to: (i) select indicators and factors that could be included in a model assessing the effect of pesticides on bee health and (ii) design a field survey to collect data to inform the parameters of the model. In addition, the outcome of this opinion could also be used by risk assessors and scientists as a basis for epidemiological studies to identify associations between indicators and factors, particularly when data from a large area are required (e.g. to investigate the correlations between Nosema spp. and mortality, observed in the south of Europe, but not in the north). This paper also targets people beyond the scientific community. It is not a practical guide on how to keep a honeybee colony healthy. However, it explains how beekeepers could provide data on their colonies to facilitate scientific analysis. In fact, the provided guidance is another step towards involving beekeepers in science and risk assessment. It is clear that further actions are required to achieve its implementation in a practical and efficient manner. Several methods described in the opinion are time consuming, require in-depth training and/or efforts to assure standardised implementation of the protocol, which may limit the persons collecting the data to specifically trained beekeepers and/or bee inspectors.
Better knowledge on the drivers affecting bee health will result in improved assistance to beekeepers and farmers, hence optimising their outputs, such as honey production and/or pollination services. Therefore, the output of this scientific opinion is assumed to be useful for different stakeholder groups, each having different objectives. Chapters 3, 4, 5 and 6 describe the tools in the toolbox, whereas Chapter 7 explains how the toolbox could be used by different stakeholder groups. Beekeepers and bee inspectors are the key actors in collecting and reporting the data, whereas several other groups have interest in obtaining good quality data. Models, for instance, need as precise and accurate data as possible to generate outputs reflecting the field situation.
This scientific opinion provides arguments on the current scientific knowledge to assess the health status of managed honeybee colonies in Europe.4 Only managed honeybees (Apis mellifera) are considered here, because most knowledge and techniques are available for this bee species. It is believed that some of the tools in the ‘toolbox’ are applicable or adjustable to also suit other bee species. Expanding the analysis to other bee species would be a useful addition, as bee diversity is very important, for instance, for the delivery of pollination services (EFSA, 2013, 2014).
2.
Data and methodologies
2.1.
Hierarchical approach
2.1.1.
Identification of the overarching concepts of a managed healthy
honeybee colony
Similarly to the conceptual framework developed to assess the welfare status of farmed animals based on the five freedoms (EFSA, 2012b5), the Panel on Animal Health and Welfare (AHAW) developed in this scientific opinion a framework to assess the health status of a managed honeybee colony based on a few overarching concepts. A scoping6 of the scientific literature has been carried out in Web of Science using the following search strings:
4 This scientific opinion does not aim to review the current knowledge on bee health, or to provide guidance to the scientific
community on future research activities.
5
http://www.welfarequality.net/everyone/26559/7/0/22
6 This approach was considered to be an efficient manner to identify the overarching concepts, indicators and factors. Detailed
literature reviews were not performed since it is not the aim of this scientific opinion to provide an overview of all the available scientific evidence for each indicator or factor. A workshop with around 50 participants was organised to identify scientific evidence that was not identified by the WG using the approach described in this chapter (see Event Report at https:// www.efsa.europa.eu/sites/default/files/corporate_publications/files/1026e.pdf, last accessed 22 August 2016).
•
TITLE: ((bee OR bees) OR (apis AND mellifera) AND health) AND TITLE: (review) Timespan: 2000–2015. Search language=Auto•
TITLE: (‘honeybee’) or loss*) Timespan:2005–2015 Search language=Auto•
TOPIC: (bee) AND TOPIC: (ecosystem) AND TOPIC: (review) Timespan: 2000–2015. Search language=AutoThe main multidimensional characteristics of a healthy managed honeybee colony were listed and used as a basis for discussion by multidisciplinary groups of experts (HEALTHY-B and MUST-B working groups). A managed healthy honeybee colony has been described and three overarching concepts were identified (see Section 3.1).
2.1.2.
Identification of indicators and factors
To identify indicators and factors for which data have been collected in field surveys in addition to the expert contribution gathered in the context of the preparation of this paper, the following data sources were consulted:
•
national or international bee health monitoring programmes – EPILOBEE, BeeNet, APENET, German Bee Monitoring Project, COLOSS project (e.g. Bee Book), UK’s Bee Health programme7;•
publications identified using searches described in Section 2.1.1;•
Web of Science using the search string ‘honeybee*’ AND health AND monitoring, 2000–(March) 2015, English;•
publications and/or scientific reports of projects or working groups provided by experts, in particular papers published between March 2015 and June 2016.Beekeeping practices can differ between Europe and other continents (e.g. more intensive movement of colonies in the United States). Therefore, screening of the scientific documents to identify indicators and factors focused on the European situation and did not include reports from, for instance, the US monitoring programme BEEinformed. However, studies from outside the EU are taken into account when scoring indicators or factors (see Section 2.2) if the context of the study is relevant to the European situation.
An overview of the identified indicators and factors from field surveys was made and was used as a basis to generate overviews presented in the form of mind maps on indicators and factors for colony attributes, external drivers or colony outputs. The structure of the mind maps is based on the life-history theory (Fabian and Flatt, 2012) and considers the budget of energy and material as the key drivers of all the physiological processes within a colony. Indicators and factors that could be measured under experimental conditions were also included in the mind maps, creating a toolbox that will facilitate the selection of relevant indicators and factors for a given objective (e.g. field surveys, risk assessment or modelling).
2.1.3.
Identification of variables and methods
For selected indicators or factors, one or more variables were identified by consulting the published scientific literature, bee experts and experts from other relevant fields. The main methods were listed and experts identified the ‘preferred’ method depending on its suitability for harmonisation and use in multifactorial field surveys in most Member States.
2.2.
Procedure for selection of indicators and factors
2.2.1.
Procedure and scoring system used
After identifying the indicators and factors, a functional or operational definition was provided for each indicator and factor (Figure2). The indicators and factors were then scored (high or low) for their relevance to the health status of a managed honeybee colony or relevance an understanding of the context of a managed honeybee colony, respectively (see definitions in Table2). Only indicators and factors with a high score on ‘relevance’ were subsequently assessed for their technical feasibility in the context of multifactorial field surveys (high or low score) (see definitions in Table 2). Technical
feasibility is assessed in relation to the type of study considering: (i) the problem formulation and objectives of the study (e.g. development of a surveillance system based on monitoring of a minimum set of variables); (ii) the resources available; and (iii) the operators involved in the data gathering (beekeepers, inspectors, laboratories, etc.). Only the indicators and factors with high scores for technical feasibility in field surveys were assessed in terms of their priority for inclusion in field surveys (high, medium or low score) (see definitions in Table 2). The outcomes are described in the main text (TOR2 in Sections 3.2,3.3and3.4) and in detailed tables in Appendix B.
Indicators and factors with an H-HH score (H-HH8 meaning High relevance, High technical feasibility and High priority; Table 3) were considered in TOR3. Variables were identified to characterise each indicator or factor and how to measure and report these was analysed. For each indicator or factor, one variable was identified for preferential use in field surveys that could be applied in several Member States with the objective to facilitate harmonisation and comparison of data in time and space within Europe. The outcomes are described in the main text (TOR3 in Sections 3.2, 3.3and 3.4).
Identification of
indicator/factor
jndicator j
Functional
or
operational
definition
TOR2
TOR3
Scoring relevance,
technical
feasibility and
priority
Selected
indicator/factor i
Assessing
variables v(i)
Identified methods
m(v(i))
Analysis of method
characteristics
Criterion 1
Criterion 2
Criterion n
Figure 2: Approach followed to select indicators and factors (TOR2) and to identify and analyse methods that could be used to measure and report the selected indicators and factors (TOR3)
Table 2: Criteria and descriptions used in the assessment of bee health indicators/factors Criterion Expertjudgement Description
Relevance to assessing the health status of a managed honeybee colony (indicators)
Relevance to understanding the context of a managed honeybee colony (factors)
High There is robust scientific evidence suggesting an association of the indicator/factor with bee health Low There is no or little scientific evidence suggesting an
association of the indicator/factor with bee health
8 The hyphen differentiates the score on the relevance to bee health (which is independent of the study objective) from the
2.2.2.
Data collection in field surveys
In order to proceed towards a holistic risk assessment on bee health in the future (the objective of EFSA’s MUST-B project), it is required to promote EU-wide bee health monitoring covering all colony attributes, external drivers and colony outputs. This was one of the recommendations made by EFSA (2014), which could be achieved by: (i) a large-scale multifactorial field survey collecting data from different Member States over a few years, or (ii) combining data from smaller field surveys carried out in parallel in different Member States. Since it is unlikely that a new pan-EU bee health monitoring study will be launched in the near future and several Member States already have ongoing bee health field surveys (see some examples in Table A.1, Appendix A), it is probably more efficient to facilitate harmonisation of indicators, factors, variables and methods to allow the merging of several (national) data sets and subsequent meta-analyses. Every Member State can keep the specific objectives of its field surveys but the use of tools from a common toolbox should facilitate data exchange and comparison of (at least some) results, which is often not possible at the moment.
As described in the TORs of this mandate, the AHAW Panel focuses on large field surveys when selecting tools from the toolbox to guarantee that the tools are applicable across the EU. A field survey is seen as a basic (as simple as possible) procedure to collect data aimed at understanding the health
Criterion Expertjudgement Description
Technical feasibility in field survey High Measurement of the factor/indicator is or could be routinely applied by a beekeeper within the context of a field survey
Low Measurement of the factor/indicator cannot or could not be routinely applied by a beekeeper within the context of a field survey
NA Not applicable because not assessed Priority indicator/factor in field
survey
High Experts consider the ratio between the benefit of the data collected on the indicator/factor and the efforts in (terms of resources) to be high. In addition, the indicator/factor is highly relevant to most Member States and in most conditions(a)
Medium Experts consider the ratio between the benefit of the data collected on the indicator/factor and the efforts in (terms of resources) to be medium. In addition, the indicator/ factor is highly relevant to some Member States/regions or in some specific conditions
Low Experts consider the ratio between the benefit of the data collected on the indicator/factor and the efforts in (terms of resources) to be low. In addition, the indicator/factor is highly relevant to few Member States/regions or in very specific conditions
NA Not applicable because not assessed (a): Referring, among others, to geographical, climatic, environmental or beekeeping management conditions.
Table 3: Combinations of scores used for the selection of indicators/factors to be measured in a field survey
Score Relevance to assessing colony attributes (indicators) or external drivers (factors)
Technical feasibility in field survey
Priority indicator/ factor in field survey
H-HH(a) High High High
H-HM High High Medium
H-HL High High Low
H-L High Low Not assessed
L Low Not assessed Not assessed
(a): The score H-HH is highlighted in green as the indicators and factors with these score are taken forward in TOR3, whereas the other indicators and factors not.
status of a honeybee colony and its variation in time and space. It is carried out through the implementation of different types of methods including observations, measurements and interviews. In this opinion, the AHAW Panel does not provide a typology of field surveys nor performs a survey design. This is to allow the use of the toolbox in ongoing Member State field surveys that might have different objectives, available resources and/or sampling/analysis capacity. However, some of the Panel’s considerations are mentioned below in relation to the design and implementation of a survey. They are directly linked to:
•
the problem formulation: in general terms or from specific perspectives;•
the spatial and temporal extent and resolution of the study to develop;•
the variability of the sampling variables and the precision of the estimates required for the analyses.It is recommended that many indicators and factors are measured at least three times during a year: after winter (1–2 weeks after bees start foraging but before the first big nectar flow), during summer (active season) and before winter (when the colony is preparing for winter). The flowering of Salix spp. was suggested by the workshop participants in an attempt to guide when the ‘after winter’ inspection should take place although no publication was found to support this idea. An alternative could be to check whether ‘cumulative day degrees’ could be used to define the start of the beekeeping season in a more harmonised way across the EU. It is considered better than using fixed dates because the length of the beekeeping season is different in northern versus southern Europe. However, it is clear that more frequent data collection will enrich the data set and is recommended whenever possible. The exact timing of the measurements has to be defined based on the objectives of the field survey. More guidance on the ‘sampling frame’ is provided in Section 5. Furthermore, two people are required to collect information from a given hive, particularly for the indicators (one checking the hive and the other one documenting the observations).
Furthermore, special attention should be given to the different actors involved in the data collection linked to field surveys. They should be informed about the objectives and reasons for performing the field survey, about the survey protocol including frequency of the honeybee colony inspections, the use of preferably standardised sampling and measurement methods, reporting methods and data protection issues. At least two different actors should be involved:
•
Beekeepers are the people managing the colony throughout the year. They provide information and data required in a field survey. It is crucial that the beekeeper receives targeted training to accurately obtain and report data.•
Inspectors or operators are people assisting the beekeeper in collecting particular samples and/or data for the survey; they might also be involved in the sample collection and/or analysis depending on the questions to be addressed and the local and regional beekeeping task organisation. These people are usually appointed by the survey coordination team, are specifically trained for sampling and ensure harmonisation of data collection between different colonies, apiaries and regions.2.3.
Workshop
For TOR1–3, involvement of hearing experts and the organisation of a workshop on bee health were important to identify relevant scientific evidence that was not identified by the WG, to identify any that is not clear in the draft text and to discuss harmonisation of measurements and reporting. The workshop was announced on the EFSA website in December 2015 together with a call for interest for anyone with relevant expertise who wanted to participate in the workshop. Around 55 experts registered their interest in participating, and around 30 were selected who fulfilled the eligibility criteria. Around 20 other experts were invited directly by EFSA, including the WG members. The workshop took place on 13–14 April 2016 and was built around breakout sessions that covered the different chapters of TOR1–3. Detailed discussions took place on comments provided by the participants and selected by the WG for their relevance to be discussed by a broader expert group. An event report is available on the EFSA website.9 The collected information was considered by the WG when finalising the draft scientific opinion.
3.
Assessment
3.1.
Identification of the colony attributes, external drivers and colony
outputs (TOR1)
3.1.1.
Characteristics of a managed healthy honeybee colony
A colony of managed honeybees was defined as an Apis mellifera bee population kept by a beekeeper with the presence of a given queen. Replacement of the queen by a natural process or by a beekeeper is considered to result in a new colony because it changes the genetics of the population.
Based on a scoping of the scientific literature (see Section 2.1.1) and subsequent discussion by WG members and hearing experts representing different stakeholders, it was concluded that the characteristics of a healthy managed honeybee colony are:
•
an adequate10size, demographic structure and behaviour in relation to the annual life cycle of the colony and the geographical location;•
an adequate9 production of bee products in relation to the annual life cycle of the colony and the geographical location;•
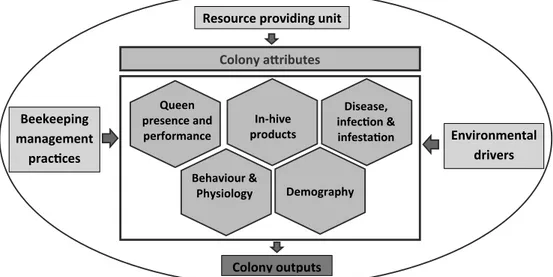
provision of pollination services.These are characteristics of a healthy honeybee colony (but should not be seen as a definition) that lead to the identification of three overarching concepts: colony attributes, external drivers and colony outputs (see definitions in Table 1, Section1.2). Colony attributes reflect the health status of a managed honeybee colony. External drivers that affect the health status and colony outputs express the productivity of a managed honeybee colony. Production of bee products and the provision of pollination services were included because these are the drivers for beekeepers to manage a honeybee colony. The concepts are further defined in Sections 3.1.2–3.1.4 below and the relationships between them are presented in Figure 3.
It is suggested that indicators, such as Varroa destructor, and molecular markers. such as vitellogenin, may be predictive markers for winter survival (Dainat et al., 2012b; Ravoet et al., 2013; Smart et al., 2015). Collecting information on such indicators is required to validate their use as a health marker across Europe and their possible future inclusion as a characteristic of a healthy managed honeybee colony.
3.1.2.
Colony attributes
Five colony attributes have been distinguished that should be analysed when assessing the health status of a honeybee colony (Figure 3):
•
queen presence and performance;•
behaviour and physiology;•
demography of the colony;•
in-hive products;•
disease, infection and infestation.Each colony attribute is described in Section 3.2and mind maps are presented to give an overview on all the indicators that were identified and scored for their relevance in relation to each colony attribute, as well as for their technical feasibility and priority for implementation in a field survey.
3.1.3.
External drivers
Three different external drivers have been distinguished (Figure 3):
•
environmental drivers;•
resource providing unit (RPU);•
beekeeping management practices (BMP).Each external driver is described in Section 3.3and mind maps are presented to give an overview on all the factors that were identified and scored for their relevance in relation to each external driver, as well as for their technical feasibility and priority for implementation in a field survey.
3.1.4.
Colony outputs
The colony outputs are considered in terms of service provision of the managed honeybees to the ecosystem. Only two of the main ecosystem services directly provided by the managed honeybees are addressed in this opinion (Figure 3):
•
the pollination services provided by the honeybee colony in terms of regulating ecosystem services (= regulating service);•
the products harvested by the beekeeper, the hive rental service and the live honeybees extracted from the honeybee colony in terms of provisioning ecosystem services (=provisioning service).The colony outputs are described in Section 3.4 and a mind map is presented to give an overview on all the indicators that were identified and scored for their relevance in relation to the colony outputs, as well as for their technical feasibility and priority for implementation in a field survey.
3.2.
Colony attributes reflecting the health status of a managed
honeybee colony (TOR2
–3)
3.2.1.
Queen presence and performance
3.2.1.1. Identification of indicators related to queen presence and performance (TOR2) An assessment of the health status of a managed honeybee colony should include analysis of the presence and performance of the queen because this influences the size, structure and survival of the colony (see Section 3.1.1). The indicators measuring queen presence and performance were identified using the methodology described in Section 2.1.2. All indicators are presented in Figure 4and detailed information is provided in Appendix B, Table B.1. The paragraph below briefly describes indicators, in particular those with high scores.
(i) Relevance of queen presence and performance indicators to the bee health status of a colony The colony will not survive without the presence of (or the ability of the colony to produce) a queen (Winston, 1991). Excessive queen mortality or replacement of the queen by the colony (e.g. a supersedure queen) could indicate that the colony is not healthy and/or the queens being produced are of chronically low quality (Page and Peng, 2001). The longevity of the queen, as measured by her age, affects her reproductive capacity and, therefore, the likelihood that she will be replaced (Tarpy et al., 2000). For example, her potential fecundity should be sufficient to lay viable fertilised and unfertilised eggs, with appropriate worker/drone proportions and a rate that is typical for the season
Queen presence and performance
Resource providing unit
Environmental drivers Colony outputs Colony a<ributes Demography Behaviour & Physiology Disease, infecAon & infestaAon In-hive products Beekeeping management pracAces V V
Figure 3: Colony attributes (elements in blue), external drivers (elements in green) and colony outputs (elements in orange) to be considered in a multidimensional assessment of the health of a managed honeybee colony
(Fyg, 1964). Lastly, included in potential fecundity is a consideration of whether or not the queen mated with sufficient males on her mating flight (mating success), as this is known to affect the vigour and survival of the colony (Tarpy et al., 2013; Mattila and Seeley, 2014).
(ii) Technical feasibility and priority to include queen presence and performance indicators relevant to bee health in field surveys
For the indicators linked to bee health, the technical feasibility and priority for inclusion in a field survey were assessed. Direct analysis of queen mortality is considered to have too low a feasibility to be included routinely in field surveys as it is often very difficult to find a dead queen in a colony and because it is a common practice for beekeepers or for the colony to replace a queen before ‘normal’ mortality occurs. The presence of a queen and the potential fecundity are very important indicators of queen bee health and, likewise, colony health, as they determine the demography, survival and strength of the colony. They can both be assessed by a beekeeper during routine hive inspections. Additionally, information on the longevity of the queen, as determined by her age, is relevant when assessing the potential fecundity of the queen and, indirectly, queen mortality, and can easily be provided by beekeepers, particularly when the queen is marked and records are kept. Keeping records of the queens per hive within an apiary facilitates the beekeeper to assess the natural queen replacement (supersedure), which could be an early signal of impaired health if it occurs at abnormally high frequencies.
3.2.1.2. Methods and tools to measure indicators related to queen presence and performance (TOR3)
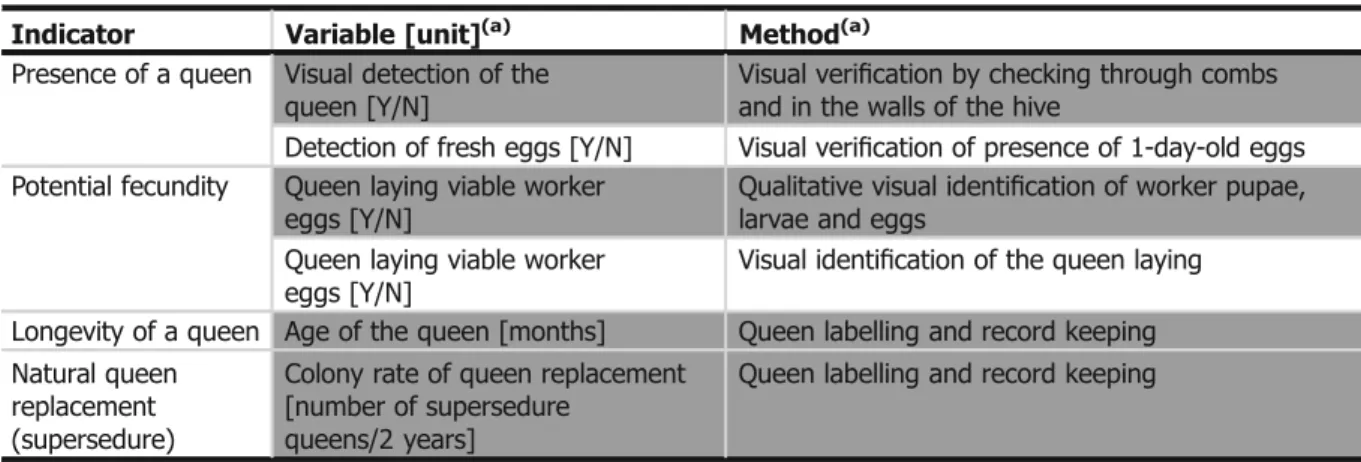
Table 4 provides an overview of different variables and methods to measure the indicators ‘presence of a queen’, ‘potential fecundity’, ‘natural queen replacement (supersedure)’ and ‘longevity of a queen’. All the methods can be implemented by a beekeeper during every routine inspection of a hive. Labelling the queen facilitates monitoring of its age and replacement. It is recommended that data on these indicators are collected at least three times a year: after wintering, during the active beekeeping season and before wintering. The text below compares the variables and corresponding methods per H-HH indicator and suggests which variable/method is considered most suitable for implementation in field surveys. Detailed information on the suggested methods is provided in Appendix C(TablesC.1–C.3), aiming to further facilitate their harmonisation across the Member States. Presence of a queen
It is recommended to detect visually the queen in a colony by checking through the hive combs, because seeing the queen is the ultimate proof that she is present and alive. A marked queen is easier to detect, and for this reason, this practice of marking is highly recommended, as mentioned H-HH, indicators with a High link with bee health, High technical feasibility and High priority; H-HL, indicators with a High link with bee health, High technical feasibility and Low priority; H-L, indicators with a High Link with bee health and Low technical feasibility; !, recommended variable to assess the corresponding indicator. The score H-HH is highlighted in green as the indicators with this score are taken forward in TOR3, whereas the other indicators not.
previously. In case the queen cannot be seen, visual detection of young (e.g. 1–3-day-old) eggs can be used as an indication that she is present. Ideally, a beekeeper would both detect the queen visually and see young eggs.
Potential fecundity of a queen
It is recommended to assess the potential fecundity of the queen by observing in a qualitative fashion an amount of all the stages of worker brood (eggs, larvae and pupae) in the hive that is expected for the time of year because it indicates that the queen is fertile and the colony is successfully rearing viable eggs (e.g. has sufficient resources) through all the stages of development. Visually identifying the queen laying the eggs is a less preferred method because a beekeeper is less likely to spot this when the hive has been opened. Determining the mating success of the queen, which would require microsatellite analysis, is considered possible only in a research setting. However, it should be noted that a sufficiently mated, healthy queen should be laying viable eggs, and that the brood pattern should be solid (see ‘brood consistency’ in Section3.2.2).
Longevity of a queen
Labelling the queen in conjunction with record keeping is the only method available to determine her age. Marking the queen takes only a few minutes once a new, unlabelled queen is found, and can be done by a beekeeper using either number tags or paint pens. Using international code colours can facilitate the process of determining queen age (Human et al., 2013); otherwise the beekeeper can rely on his/her own record keeping. Every time the hive is inspected, it should be assessed whether the queen identified and marked during the last visit is still present or whether she has been replaced by a new (unmarked) queen. If the beekeeper has replaced the queen, this should be noted. If regular queen replacement by the beekeeper takes place regardless of status/performance/age of current queen, this variable is no longer meaningful.
Natural queen replacement (supersedure)
Similar to the assessment of queen longevity, labelling the queen in conjunction with record keeping is the only method available to determine the rate of natural queen replacement, which is when the colony ‘decides’ that a queen needs to be replaced. Natural queen replacement (supersedure) should be reported as the number of new queens detected in 2 years and does not include those queens that were introduced into the colony by the beekeeper. New queens are recommended to be labelled as explained in the previous paragraph. As stated above, if the beekeeper has replaced the queen, this should be noted. If regular queen replacement by the beekeeper takes place, then the hive never has the opportunity to express queen supersedure, making this variable no longer meaningful.
Table 4: Measurement of selected indicators on queen presence and performance
Indicator Variable [unit](a) Method(a)
Presence of a queen Visual detection of the queen [Y/N]
Visual verification by checking through combs and in the walls of the hive
Detection of fresh eggs [Y/N] Visual verification of presence of 1-day-old eggs Potential fecundity Queen laying viable worker
eggs [Y/N]
Qualitative visual identification of worker pupae, larvae and eggs
Queen laying viable worker eggs [Y/N]
Visual identification of the queen laying Longevity of a queen Age of the queen [months] Queen labelling and record keeping Natural queen
replacement (supersedure)
Colony rate of queen replacement [number of supersedure
queens/2 years]
Queen labelling and record keeping
(a): Variables, methods, implementation and timing most suitable for implementation in field surveys across the EU are highlighted in green. They can all be performed by beekeepers, preferably at least three times a year: after winter (e.g. 1–2 weeks after bees start foraging, but before first big nectar flow), during summer (active season) and before winter (when the colony is preparing for winter) (see Section2.2.2). However, it is clear that more frequent data collection will enrich the data set and is recommended whenever possible (see ‘sampling frame’ in Section5). The exact timing of the measurements has to be defined based on the objectives of the field survey. Details on these methods are given TablesC.1–C.3.