Proteomic Identification of
LASP-1 Down-regulation After
RNAi Urokinase Silencing
in Human Hepatocellular
Carcinoma Cells
1,2Alessandro Salvi*, Italia Bongarzone†, Francesca Miccichè†, Bruna Arici*,
Sergio Barlati* and Giuseppina De Petro*
*Division of Biology and Genetics, Department of Biomedical Sciences and Biotechnology, IDET Centre of Excellence, University of Brescia, viale Europa 11, Brescia 25123, Italy;†Proteomics Laboratory, Department of Experimental Oncology, Fondazione IRCCS Istituto Nazionale dei Tumori, Via G. Venezian 1, 20133 Milan, Italy
Abstract
In human hepatocellular carcinoma (HCC), the high expression of urokinase-type plasminogen activator (uPA) is an unfavorable prognostic factor and a therapeutic target. To identify the downstream effects of uPA silencing by RNA interference, we studied proteome modifications of uPA-inhibited SKHep1C3 cells, an HCC-derived cell line.
The study with two-dimensional difference gel electrophoresis and matrix-assisted laser desorption/ionization–
time of flight–mass spectrometry showed Lim and SH3 protein 1 (LASP-1), cytokeratin 1 (CK-1), cytokeratin 10
(CK-10), and heterogeneous nuclear ribonucleoprotein H1 down-modulation after uPA inhibition. LASP-1, CK-1, and CK-10 are involved in cytoskeleton dynamics as heterogeneous nuclear ribonucleoprotein H1 takes part in the mRNA processing and stability. We first confirmed the proteomic data by Western blot and immunoflores-cence and then explored the link between uPA and LASP-1. The ectopic expression of uPA and LASP-1 supported the proteomic results and showed that uPA up-regulation increased LASP-1 expression and that both were impli-cated in SKHep1C3 motility. siRNA LASP-1 inhibition showed that LASP-1 was involved in actin microfilaments organization of SKHep1C3 cells. The disruption of the actin microfilaments after LASP-1 depletion increased uPA secretion and SKHep1C3 motility. Our results would suggest the hypothesis that uPA and LASP-1 expression may be coordinated in HCC-derived cells. In summary, the proteomic identification of a set of uPA downstream proteins provides new insight into the function of uPA in HCC cells.
Neoplasia (2009) 11, 207–219
Introduction
Hepatocellular carcinoma (HCC) is one of the most frequent liver malignancies often with unfavorable prognosis. Its onset is related to hepatitis B and C virus infections, cirrhosis, alcoholism, and ex-posure to aflatoxin [1]. Until now, the best treatment is surgery, but survival is still poor owing to the high incidence of recurrences or intrahepatic metastasis [2]. New therapies also based on new thera-peutic targets are urgently needed [3]. The disregulated genes in-volved in HCC include the urokinase-type plasminogen activator (uPA) and its GPI-anchored receptor (uPAR) [4]. uPA is a serine pro-tease secreted by numerous cell types and is responsible for plasmino-gen conversion into plasmin. Proteolytic activity of uPA activates or releases several growth factors, vascular fibrinolisis, and extracellular ma-trix degradation. Independent of its proteolytic activity, the uPA-uPAR
Abbreviations: 2D-DIGE, two-dimensional difference gel electrophoresis; CK-1, cytokeratin 1; CK-10, cytokeratin 10; HCC, hepatocellular carcinoma; HNRPH1, het-erogeneous nuclear ribonucleoprotein H1; LASP-1, Lim and SH3 protein; PI3-K, phosphoinositide-3 kinase; uPA, urokinase-type plasminogen activator (PLAU); uPAR, uPA receptor
Address all correspondence to: Prof. Giuseppina De Petro, Division of Biology and Ge-netics, Department of Biomedical Sciences and Biotechnology, University of Brescia, Viale Europa n.11, 25123 Brescia, Italy. E-mail: [email protected]
1This work was supported by the Ministero dell’Istruzione, dell’Università e della Ricerca
(MIUR), the Centro Eccellenza IDET, Fondazione Cariplo, Consiglio Nazionale delle Ricerche, and MIUR within the context of the Progetto Strategico Oncologia and Alleanza contro il Cancro (ACC):“Fosfoproteomica e terapie antitumorali target specifiche”.
2
This article refers to supplementary materials, which are designated by Table W1 and Figure W1 and are available online at www.neoplasia.com.
Received 1 September 2008; Revised 11 November 2008; Accepted 12 November 2008 Copyright © 2009 Neoplasia Press, Inc. All rights reserved 1522-8002/09/$25.00 DOI 10.1593/neo.81076
system governs several biologic processes including cellular adhesion, differentiation, proliferation, migration, and invasion under physio-logical (embryogenesis, tissue remodeling, and repair) and pathologic conditions (i.e., cancer). Because uPAR lacks a cytosolic domain, to ini-tiate intracellular signaling, it needs transmembrane coreceptors such as vitronectin/integrins and caveolin [5–9].
The overexpression of uPA (and its receptor) is an unfavorable prog-nostic factor for various types of tumors and is a target for innovative anticancer therapies [10,11]. Intratumoral injections of a plasmid vector expressing shRNA for uPA and uPAR have been able to regress pre-established subcutaneous human meningioma tumors in mice [12]. An in vivo assay system of experimental metastasis in athymic mice model using HCT116 colon cancer cells transfected with antisense uPAR mRNA-expressing plasmids inhibited pulmonary metastasis [13]. The selective diaryl phosphonate inhibitors for uPA have dis-played in vivo antimetastatic properties in a BN-472 rat mammary car-cinoma model [14]. In the case of HCC, we previously found the essential role of uPA in the cellular processes of migration, invasion, and proliferation by an RNA interference (RNAi) down-modulation gene approach based on the stable expression of shRNA against uPA in the HCC-derived SKHep1C3 cell line [15]. Furthermore, uPA in-hibition led to the limited growth of HCC xenografts induced in nude mice by transfected cells [16]. Recently, RNAi has become a powerful tool in studies of gene function and in therapeutic applications to treat disease, including cancer [17–20]. Among the different strategies that have been used to investigate the downstream effects after gene si-lencing, approaches such as proteome profiling or cDNA microarray could offer an overall view inside the proteome or the transcriptome [21,22]. For the first time, we investigated the effects of uPA silencing in SKHep1C3 cells using proteomic analysis. Among the proteins that were differentially expressed after uPA silencing, we focused on the actin-binding protein, Lim and SH3 protein 1 (LASP-1), and its inter-play with uPA expression.
LASP-1 is an actin-binding and zyxin-binding scaffolding protein, which has been reported to be localized within multiple sites of actin assembly (i.e., focal contacts, focal adhesion, lamellipodia, pseudo-podia). Although the biologic role of this protein has not been clarified, evidence has shown the essential role of LASP-1 in actin cytoskeleton organization at the leading edges of migrating cells [23–25].
Here we found that LASP-1 could be a mediator of uPA in SKHep1C3 cell migration likely by taking part in the cytoskeletal changes that occur during such processes. Describing and identifying uPA downstream proteins could help to better understand the role of uPA in HCC and find a more successful experimental schedule of target gene therapy in vitro and/or in experimental animal models. Materials and Methods
Reagents
Sodium orthovanadate, [(3-cholamidopropyl)-dimethylammonio]-1-propane sulfonate (CHAPS), bromophenol blue, Bradford reagent, and colloidal Coomassie were supplied from Biorad (Milan, Italy); urea, Tris, SDS, and glycerol from Sigma Fluka-Aldrich, Chemical Co. (Milan, Italy); thiourea, lysine, and phenylmethylsulfonyl fluoride from Sigma Fluka-Aldrich. CyDyes DIGE Fluors, IPG buffer, pH 3 to 10 NL, Immobiline DryStrip gel, 3 to 10 NL, dithiothreitol (DTT), iodo-acetamide, and 2D Clean-Up Kit were purchased from Amersham Bio-sciences (Milan, Italy). Trypsin, Taq polymerase, and the ECL kit were supplied from Promega (Milan, Italy); siRNA were from Ambion (Milan,
Italy). Earle’s minimum essential medium (MEM), fetal bovine serum (FBS), Lipofectamine 2000, Novex Nu-PAGE Bis-Tris gels, TRIzol, de-oxyribonucleotide triphosphates, random hexamers, the plasmid pEF6/ V5-His TOPO vector, and chemically competent Escherichia coli were all purchased from Invitrogen (Milan, Italy). Primers were purchased from Sigma Genosys (Milan, Italy). Rabbit polyclonal anti-uPA and plasmino-gen were from Technoclone (Wien, Austria); mouse monoclonal anti-GAPDH and rabbit polyclonal anti–LASP-1 were from Chemicon (Milan, Italy) International; rabbit polyclonal anti-heterogeneous nu-clear ribonucleoprotein H1 (HNRPH1) was from Bethyl Laboratories (Montgomery, TX); mouse monoclonal anti–CK-1 and anti–CK-10 were from AbCam (Cambridge, UK); antimouse IgG, antirabbit IgG HRP, and fluorescein isothiocyanate–labeled phalloidin were supplied by Sigma-Aldrich, Chemical Co. Finally, LY294002 was from Calbiochem (Milan, Italy), and transwells were purchased from Corning (Turin, Italy).
Protein Extraction
A total of 1 × 10⁷cells were used for each protein sample: cells were washed three to four times with cold PBS containing 0.1 mM sodium orthovanadate and were collected by scraping into a further 1 ml of cold PBS before centrifuging (2000g for 5 minutes at 4°C). The supernatant was discarded, and the cell pellet was solubilized in two-dimensional difference gel electrophoresis (2D-DIGE) sample buffer: 7 M urea, 2 M thiourea, 4% CHAPS, 30 mM Tris, buffered to pH 8.5, supplemented with 1 mM sodium orthovanadate and 2 mM phenylmethylsulfonyl fluoride. After incubating for 10 minutes at room temperature, the pellet was intermittently sonicated on ice until the cells were lysed. After centrifuging the cell lysate for 10 minutes at 12,000g to remove any cells debris, the protein concentration in the supernatant was determined using a Bradford reagent.
To eliminate all salts and nonprotein contaminants, the cell lysate samples were precipitated with a 2D Clean-Up Kit. The air-dried pro-tein pellets were solubilized in a 2D-DIGE sample buffer.
2D-DIGE Experiments
Cell lysate proteins were labeled with the CyDyes DIGE Fluors developed for 2D-DIGE technology (GE Healthcare, Milan, Italy), ac-cording to the manufacturer’s instructions. Briefly, 50 μg of SKHep1C3 and 50μg of siRNA uPA SKHep1C3 lysates were minimally labeled by incubating with 400 pmol of Cy5 for 30 minutes on ice, in the dark. The reactions were then quenched by incubating with 1μl of 10 mM lysine for 10 minutes on ice, in the dark. Labeling was per-formed from two biologic replicates.
In parallel, to obtain a pooled reference sample, 100μg of two bio-logic replicates of pS and pS shRNA uPA lysates were mixed, and the resulting 400μg of proteins were labeled with 3200 pmol of Cy3. Next, we made eight gels in four 2D-DIGE experiments using 50μg of each Cy5-labeled sample in combination with 50μg of the Cy3-labeled ref-erence sample, adjusting the volume to 350μl with 2D rehydration buffer: 8 M urea, 4% CHAPS, 0.2% DTT, 0.8% IPG buffer, pH 3 to 10 NL, and 0.002% bromophenol blue. First dimension isoelectric focusing was carried out on an IPGphor system (GE Healthcare). The sample was then loaded onto an 18-cm Immobiline DryStrip gel (pH 3 to 10, NL) by passive rehydration for a minimum of 12 hours. After rehydration, the DryStrip gel was transferred to Ettan IPGphore and isoelectric focused by applying 30 V h for 6 hours, 200 V h for 3 hours, 1000 V h for 2 hours in gradient, 3500 V h for 2 hours in gradient, 3500 V h for 2 hours, 8000 V h for 3 hours in gradient, and 8000 V h until a total of 70,000 V h was achieved. After isoelectric focusing, the
IPG strip was allowed to settle in the SDS equilibration buffer (6 M urea, 30% glycerol, 2% SDS, 0.05 M Tris-HCl, pH 8.8, 0.002% bro-mophenol blue) containing 2% DTT in a first incubation for 15 min-utes at room temperature and, subsequently, 3% iodoacetamide for 15 minutes at room temperature in the dark. After equilibration, each strip was applied to the top of 10% isocratic SDS-PAGE handmade gel between low-fluorescence glass plates and was run at 40 mA per gel at 15°C on the SE600 Ruby (GE Healthcare) separation unit, until the blue dye front reached the bottom of the gel. A total of eight gels were run for four 2D-DIGE experiments. After the protein separation, each gel was scanned at two different wavelengths using a Typhoon 8600 variable mode imager (GE Healthcare) in the fluorescence mode. The Cy3 images were scanned with a 532-nm laser, using a 580-nm emis-sion filter; and Cy5 images were scanned with a 633-nm laser, using a 670-nm emission filter. The laser power was chosen so that there was no saturated signal. All gels were scanned at a resolution of 100μm (pixel size). Gel images were processed with DeCyder software 2D V6.5 (GE Healthcare), which allowed quantification, gel matching, and statistical analysis. The normalized spot ratio was calculated by di-viding the volume of the Cy5 spot by that of the corresponding Cy3 spot on each gel.
We used the Student’s t test for the statistical analyses. Only spots with at least 1.5-fold change in volume with P < .05 after normali-zation were considered differential, and only proteins found modu-lated in all four 2D-DIGE experiments were considered significant.
Protein Identification
Proteins were identified after excision of spots from a colloidal Coomassie-stained gel using matrix-assisted laser desorption/ionization– time of flight–mass spectrometry (MALDI-TOF MS) as previously described [26].
Cell Cultures
SKHep1Clone3 (SKHep1C3) [27], selected from undifferenti-ated human HCC-derived cells [SKHep1 (No. HTB-52; American Type Culture Collection, Manassas, VA)], SKHep1C3.69.2 cells, ob-tained from SKHep1C3 cells by double selection in nude mice [16] and SKHep1C3-transfected cells, were maintained in Earle’s MEM (Invitrogen) supplemented with 10% FBS, 100 IU/ml penicillin, and 100μg/ml streptomycin (Sigma-Aldrich) at 37°C in a 5% CO2 incu-bator. AB2 human dermal fibroblasts were also cultured under the same conditions [28]. Differentiated human HCC-derived cells [HepG2 (No. HB-8065; American Type Culture Collection) and HuH-6] and Ha22T/VGH undifferentiated HCC-derived cells [29] were main-tained in RPMI 1640 supplemented with 10% of FBS at 37°C in a 5% CO2incubator. HuH-6 and Ha22T/VGH cells were kindly pro-vided by Prof. Natale D’Alessandro (University of Palermo, Italy).
Overexpression of uPA and LASP-1
cDNA fragments encoding the uPA coding sequence (CDS; National Center for Biotechnology Information (NCBI) Accession Number: NM_002658) and the LASP-1 CDS (NCBI Accession Number: NM_006148) were isolated by polymerase chain reaction (PCR) using respectively the uPA cl FOR sense (5′-GACCTCGCCACCA-TGAGAG-3′) and uPA cl REV antisense (5′-CCCTGGGGAC-CCTCAGAG-3′) primers and the LASP-1 cl FOR sense (GGA-ACCATGAACCCCAACTGC-3′) and LASP-1 cl REV antisense (5′-GGCGCTCCGGGTTCAGAT-3′) primers. The cDNA
frag-ments encoding uPA CDS (1320 bp) and LASP-1 CDS (804 bp) were directly ligated into the pEF6/V5-His TOPO vector (Invitrogen). The orientation and sequence of the insert were confirmed by auto-mated sequencing.
Stable and Transient Transfection of SKHep1C3 Cells
For stable transfections, SKHep1C3 cells were seeded in the com-plete medium at 80% of confluence in a six-well Costar plate (8 × 10⁴cells per well). Twenty-four hours after seeding, the cells were transfected in serum-free Earle’s MEM using 4 μg of each plasmid (pEF6, pEF6 uPA, and pEF6 LASP-1) and Lipofectamine 2000 as a transfection agent. The selection started 48 hours after transfection by adding 6 μg/ml blasticidine (Invitrogen). The selection medium was changed every 4 days until all nonresistant cells died (SKHep1C3 pEF6: cell was transfected with empty vectors; SKHep1C3 pEF6 uPA: cells were transfected with uPA-expressing construct; SKHep1C3 pEF6 LASP-1: cells were transfected with LASP-1–expressing constructs).For transient transfections, SKHep1C3 cells were seeded in the complete medium at 80% confluence in a 24-well Costar plate (8 × 10⁴cells per well). Twenty-four hours after seeding, the cells were transfected in serum-free Earle’s MEM at 50 and 100 nM of siRNA LASP-1 or at 100 nM of the scramble sequence (scr LASP-1) using Lipofectamine 2000 (Invitrogen) transfection reagent according to the manufacturer’s instruction. Transfection mixtures were replaced, 24 hours after transfection, with Earle’s MEM supplemented with 10% FBS. The conditioned media (CM) and the cell extracts (CE) were prepared for analysis 48 and 72 hours after transfection as pre-viously described [30].
Reverse Transcription
–PCR Analysis and Genomic PCR
The DNA and total RNA were extracted with Trizol reagent (Invitrogen) according to the manufacturer’s instruction and were quan-tified using a NanoDrop ND-1000 Spectrophotometer (NanoDrop Technologies, Wilmington, DE).The DNA was used to verify the integration of the plasmid sequence into cell genomes using the insert-specific forward primers uPA cl FOR or LASP-1 cl FOR and the plasmid-specific reverse primer V5 (5′ GCGTAGAATCGAGACCGAG 3′). The total RNA of transfected and nontransfected cells (1μg) was reverse-transcribed using random hexamers (Invitrogen). Reverse transcription (RT)–PCR was performed using glyceraldehyde-3-phosphate–specific primers (NCBI Accession Number: NM_002046), namely, GAPDH FOR, 5′ GTCAGTGGT-GGACCTGACCT 3′, and GAPDH REV, 5′ TGAGGAGGGGAGA-TTCAGTG 3′, to verify the integrity of RNA and adequate cDNA synthesis. The expression levels of the constructs were monitored using the plasmid-specific primers T7 (forward, 5′ TAATACGACTATA-GGG 3′) and V5 (reverse). Endogenous uPA expression was detected using uPA1- and uPA2-specific primers, and the endogenous LASP-1 mRNA expression was examined using the following primers: LASP-1 a (forward), 5′ GAAGAAGCCCTACTGCAACG 3′; and LASP-1 b (reverse), 5′ GTGTCTGCCACTACGCTGAA 3′.
Western Blot Analysis, Zymography, and Immunoprecipitation
The CM and CEs were collected from nontransfected and trans-fected cells cultures as previously described [30]. Constant amounts of proteins were loaded—under nonreducing conditions—onto Novex NuPAGE (4%-12%) Bis-Tris gels (Invitrogen) or in 8% SDS poly-acrylamide gels, which was blotted onto a nitrocellulose membrane.For total proteins from CM (not containing fetal calf serum; loaded at 9.72 μg per lane), nitrocellulose membranes were immunore-acted using the primary rabbit antihuman uPA antibodies (1:1000 in 1% bovine serum albumin, BSA; Technoclone) and the secondary HRP-conjugated antirabbit IgG (1:5000 in 0.3% BSA) antibodies or overlaid onto casein agar containing 2 μg/ml human plasminogen (Technoclone) to evaluate uPA activity [30]. For total proteins from the CE (69.9 μg per lane), the immunoreactions were performed using rabbit antihuman LASP-1 (1:500 in 0.3% BSA), antihuman HNRPH1 (1:30,000 in 1% BSA) antibodies, and HRP-conjugated antirabbit IgG (1:5000 in 0.3% BSA) antibodies or mouse monoclonal antibodies antihuman GAPDH (1:300 in 1% BSA), CK-1 (1:500 in 0.3% BSA), CK-10 (1:500 in 0.3% BSA), and HRP-conjugated anti-mouse IgG [1:5000 in 0.3% BSA; anti-GAPDH and anti–LASP-1 (Millipore, Billerica, MA); anti-HNRPH1 (Bethyl Laboratories); anti– CK-1 and anti–CK-10 (AbCam); anti–mouse/rabbit IgG (Sigma)].
The immunoreaction results were detected using the ECL substrate kit (Celbio, Milan, Italy). The bands were scanned and analyzed by a digital system (Gel-Pro Analyzer 3.1; MediaCybernetics, Bethesda, MD), and the integrated optical density values were expressed in pixels. The expression percentages were normalized with respect to GAPDH. For immunoprecipitation (IP), cells were lysed in ice-cold lysis buffer containing 50 mM HEPES (pH 7), 150 mM NaCl, 10% glycerol, 1% Triton X-100, 1.5 mM MgCl2, 1 mM EGTA, 10 mM Na4P2O7, 100 mM NaF, and 1 mM sodium orthovanadate in the presence of protease inhibitors for 20 minutes with gentle rocking at 4°C. Lysates were pooled and were cleared by centrifuging (13,000 rpm for 10 minutes); their protein concentration was found using BCA reagent (Pierce, Rockford, IL). The samples were incubated for 45 minutes by gentle rocking at 4°C with Protein A–Sepharose 4B (100 μl of a 42% solution). Extracts were immunoprecipitated by incubating for 3 hours with gentle rocking at 4°C with antibodies plus Protein A– Sepharose 4B (50 μl of a 42% solution). The immunoprecipitates were washed five times with 1 ml of buffer containing 20 mM HEPES pH 7.5, 150 mM NaCl, 10% glycerol, 0.1% Triton X-100, supplemented with a mixture of protease inhibitors, boiled in SDS loading buffer (125 mM Tris-HCl pH 6.8, 5% SDS), and the eluted proteins were resolved by SDS-PAGE and immunoblotted with anti– LASP-1 and anti-HNRPH1.
Immunofluorescence
For the immunofluorescence (IF) detection of LASP-1, HNRPH1, and uPA, transfected and nontransfected cells were seeded and cul-tured (75,000 cells/22 × 22-mm glass coverslips in 3 cm Φ Petri dishes) in growth medium until 90% confluence. The cultures were then fixed in cold methanol × 20 minutes at 4°C. After one wash in PBS (1 × 3 minutes) and one treatment with 0.3% BSA in PBS (1 × 3 minutes), the cells were immunoreacted with the first antibodies, polyclonal anti–LASP-1, anti-HNRPH1, and anti-uPA antibodies (1:100 in 0.3% BSA; 1:300 in 1% BSA; 1:100 in 1% BSA, respec-tively) for 30 minutes at room temperature and washed 3 × 5 minutes in PBS.
The cells were then immunoreacted with the secondary fluorescein-conjugated antirabbit IgG (1:100 in 0.3% BSA) for 30 minutes at room temperature. The coverslips were mounted on glass slides in mounting medium and photographed with a Leitz fluorescence micro-scope (original magnification, ×63; Hicksville, NY). The density levels of 100 pS and 100 pS siRNA uPA cells were carried out on the cells after anti–LASP-1 and HNRPH1 staining. Ten randomly chosen fields
were analyzed for each cell type. All corresponding images were ana-lyzed by a specific program (MCID), which evaluates the integrated optical density level of each immunofluorescent cell.
Actin Microfilaments Detection
For actin microfilaments analysis, cells were seeded on 14 × 14-mm glass coverslips, and after 24 hours, the cells were transiently trans-fected with siRNA LASP-1 as described previously. Seventy-two hours after transfection, they were fixed in 3% paraformaldehyde in PBS for 5 minutes followed by permeabilization with 0.5% Triton X-100 in PBS for 5 minutes. After three washes with PBS, the specimens were incubated with fluoresceine-conjugated phalloidin (Sigma) for 30 min-utes. The actin staining of actin was observed under a fluorescence microscope (original magnification, ×63; Zeiss, Milan, Italy).
Cell Migration Assays
For the motility assays, cells (1 × 10⁵cells per well) were loaded on transwell 8.0-μm polycarbonate membrane inserts in triplicate wells using a 24-well transwell chamber (Costar, Bodenheim, Germany). Cells were seeded in the upper chamber in 100-μl serum-free Earle’s MEM; 0.6 ml of AB fibroblasts CM was loaded into the bottom chamber as chemoattractant. The plates were incubated at 37°C in a 5% CO2incubator. After 24 hours, the cells that migrated in the lower chamber were trypsinized and counted using a Burker’s chamber.
Treatment of SKHep1C3 Cells with LY294002, a Specific
Inhibitor of Phosphoinositide-3 Kinase Complex
SKHep1C3 cells were seeded in 24-well Costar plates (80,000 cells per well) in complete medium containing 10% FBS in triplicate wells. After 24 hours, the medium was removed, and after three washings with PBS, the medium without fetal calf serum was added. After 24 hours, 20μM LY294002 was added for 30 minutes then the me-dium was changed with a fresh meme-dium containing 10% FBS. At 4, 8, and 24 hours, CE and CM were collected as described [30]. Cell ex-tracts were submitted to Western blot (WB) detection of LASP-1; CM were submitted to zymographic detection of uPA.
Statistical Analysis
Each experiment was carried out at least twice (the histograms show mean values, the bars indicate SD). The statistical significance of the results was determined using Student’s t test. Data were con-sidered significant with P≤ .05.
Results
Proteomics Identification of Differentially Expressed Proteins
in uPA Down-modulated SKHep1C3 Cells
Two-dimensional difference gel electrophoresis was used to analyze the effects on protein expression of the uPA inhibition by RNAi in SKHep1C3 tumor cell line (pS cells, SKHep1C3 transfected with the empty vector; pS shRNA uPA, SKHep1C3 cells transfected with plasmids expressing shRNA against uPA [15]). Details of the 2D-DIGE experimental design are reported fully in the Materials and Methods section.
Imaging analysis performed by DeCyder software demonstrated that among 3995 total spots, there were 2281 matched protein spots and 4 were significantly downregulated in pS shRNA uPA-transfected cells.
These spots were selected, and proteins were unambiguously identified using MALDI-TOF MS. The Swiss-Prot accession number and other MS data are shown in Table W1. The down-modulated spots cor-responded to LASP-1, HNRPH1, CK-1, and CK-1/CK-10 proteins. The differential expression in spot volume ratio (pS shRNA uPA/pS) and relative P values are shown in Figure 1. Remarkably, a very con-sistent change in protein expression, of at least three-fold, was observed for each of the four proteins.
LASP-1, HNRPH1, CK-1, and CK-10 Are Downregulated
After uPA Silencing by RNAi in SKHep1C3 Cells
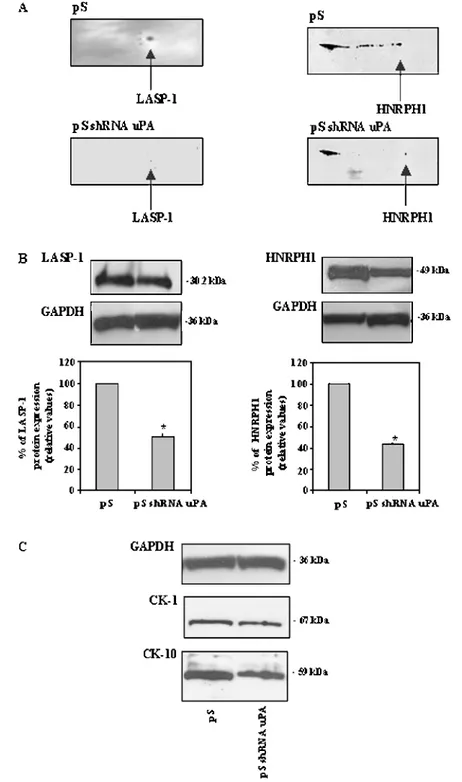
To validate the proteomic results, WB analyses were performed on the CE of transfected cells. Two-dimensional WB confirmed the LASP-1 and HNRPH1 protein expression inhibition found by the 2D-DIGE experiments in pS shRNA uPA cells (Figure 2A, left and right). In particular, LASP-1 (Figure 2B, left) and HNRPH1 (Figure 2B, right) expression decreased by 49% and 57%, respectively,
in pS shRNA uPA cells compared with the pS cells. In addition, CK-1 and CK-10 were inhibited as shown in Figure 2C, agreeing with the 2D-DIGE results.
LASP-1 and HNRPH1 Did Not Coimmunoprecipitate with
the uPA-uPAR System
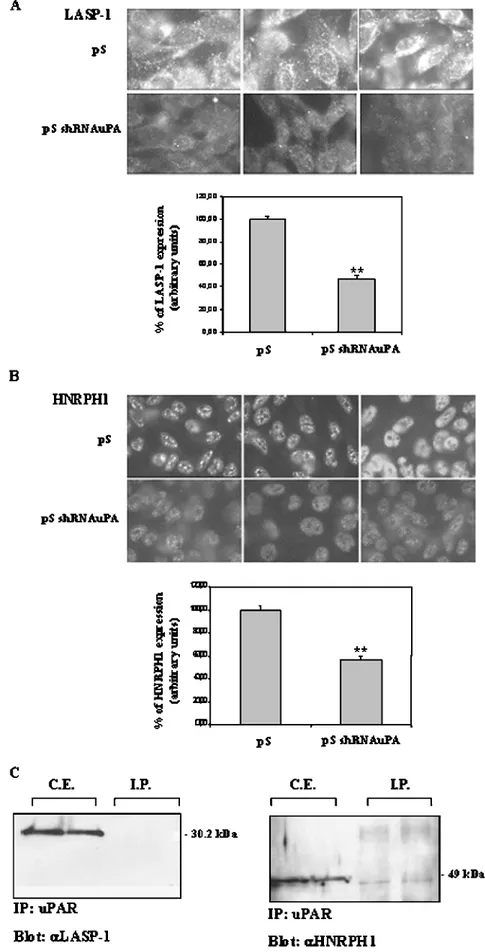
To highlight the cellular localization of LASP-1 and HNRPH1 and their possible interaction with the uPA-uPAR system, IF and IP analyses were carried out. The IF detection revealed a cytoplasmic staining of LASP-1 and a nuclear staining of HNRPH1. The cyto-plasmic staining of LASP-1 detected by specific antibodies showed a LASP-1 expression that had decreased by 53% (P < .01) in pS shRNA uPA cells (Figure 3A). The nuclear staining of HNRPH1 revealed a protein inhibition of 43% (P < .01) in pS shRNA uPA cells compared with the pS control cells (Figure 3B). LASP-1 and HNRPH1 did not coimmunoprecipitate with anti-uPAR antibodies. The WB analysis of the IP from pS and pS shRNA uPA-transfected
Figure 1. Differential proteomic analysis. Differentially expressed proteins, HNRPH1, LASP-1, CK-1, and CK-1/CK-10 that were found downregulated in pS shRNA uPA-transfected cells are highlighted in red in the corresponding panels. Changes in volume after normali-zation and relativeP value are indicated (P = .0053, P = .01, P = .0045, and P = .011 for LASP-1, HNRPH1, CK-1, and CK-1/CK-10, respectively). Note that CK-1/CK-10 indicates the presence in the spot of both CK-1 and CK-10 proteins.
cells would exclude direct interaction of the uPA-uPAR system with LASP-1 and HNRPH1 proteins. As controls, WB analysis of LASP-1 and HNRPH1 was carried out on total CE from pS and pS shRNA uPA cells (Figure 3C ).
Stable Expression of uPA Leads to LASP-1 Up-regulation
in SKHep1C3
The possible relation between uPA and LASP-1 expression was first tested in some HCC-derived cell lines. Data obtained from the WB and zymographic detection of uPA protein and its enzymatic
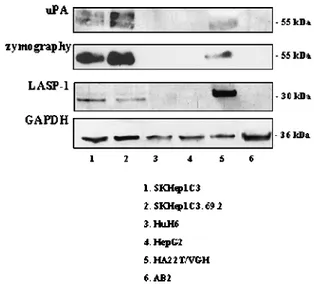
activity and from the WB detection of LASP-1 (conducted on con-stant total protein amounts from the CM and CEs, respectively, of the cell lines) showed a direct trend of uPA and LASP-1 expression in undifferentiated HCC-derived cells, SKHep1C3, SKHep1C3.69.2, and HA22T/VGH cells (Figure 4). The same analysis carried out on differentiated HCC-derived cells, HuH-6 and HepG2 and AB2 nor-mal human dernor-mal fibroblasts, did not reveal either uPA or LASP-1 expression (Figure 4).
Secondly, the possible relation between uPA and LASP-1 expres-sion was studied using plasmid-based ectopic overexpresexpres-sion of uPA
Figure 2. Validation of LASP-1 and HNRPH1 down-modulation by Western blot (WB). Two-dimensional WB (A) and monodimensional WB (B) confirmed the LASP-1 and HNRPH1 protein expression inhibition found by 2D-DIGE experiments in pS shRNA uPA cells. Validation of CK-1 and CK-10 down-modulation by WB (C). The GAPDH was used as a control. Histograms represent mean values; bars, SD. *P < .05.
Figure 3. Cellular localization of LASP-1 (A) and HNRPH1 (B) by IF analysis. Panels A and B show the cytoplasmic staining of LASP-1 and the nuclear staining of HNRPH1, respectively. LASP-1 and HNRPH1 were clearly decreased in pS shRNA uPA cells (A and B; original magnification, ×63). Furthermore, the WB analysis conducted on IP from pS and pS shRNA uPA-transfected cells (C) showed that LASP-1 and HNRPH1 did not coimmunoprecipitate with anti-uPAR antibodies. As control, WB analysis of LASP-1 and HNRPH1 was carried out on total CEs from pS and pS shRNA uPA cells. Histograms represent mean values; bars, SD. **P < .01.
and LASP-1 in SKHep1C3 cells, the same cells that were examined for the proteomic identification of LASP-1.
After verifying the presence of plasmid constructs in SKHep1C3 cell genomes by PCR and the effective construct expressions by RT-PCR (Figure W1), we then assessed the expression level of uPA and LASP-1 mRNA in the transfected cells. As expected, RT-PCR showed uPA mRNA overexpression by 1.58 ± 0.18-fold in SKHep1C3 pEF6 uPA cells (cells transfected with uPA-expressing constructs; Fig-ure 5A, lane 2) and overexpression of LASP-1 mRNA by 2 ± 0.37-fold in SKHep1C3 pEF6 LASP-1 cells (cells transfected with LASP-1– expressing constructs; Figure 5B, lane 3). These results showed that ectopic overexpression of uPA and LASP-1 mRNA were successful.
Next, we verified whether the uPA and LASP-1 proteins were also upregulated in transfected cells. Immunofluorescence analysis showed uPA protein up-regulation in SKHep1C3 pEF6 uPA cells compared with SKHep1C3 pEF6 control cells (Figure 6A). The WB analysis conducted on CM from transfected cells showed that the uPA protein levels and its enzymatic activity in SKHep1C3 pEF6 uPA increased by approximately 1.5 ± 0.036- and 1.6 ± 0.21-fold, respectively (Fig-ure 6B, lane 2). The uPA expression levels in SKHep1C3 pEF6 LASP-1 cells were comparable to those in SKHep1C3 pEF6 cells (Figure 6A and B). Immunofluorescence analysis displayed LASP-1 up-regulation in SKHep1C3 pEF6 LASP-1 cells and also a high level of LASP-1 in SKHep1C3 pEF6 uPA cells compared with that in the SKHep1C3 pEF6 control cells (Figure 6C ). The WB analysis con-ducted on CE from transfected cells showed that the LASP-1 protein levels increased by approximately 3 ± 0.26- and 1.4 ± 0.026-fold in the SKHep1C3 pEF6 LASP-1 and SKHep1C3 pEF6 uPA cells, respec-tively (Figure 6D). This result shows that uPA ectopic up-regulation probably led to LASP-1 overexpression.
Overexpression of uPA and LASP-1 Increased the Motility
of SKHep1C3 Cells
It is well known that uPA plays a relevant role in motility for sev-eral tumor cells and that uPA down-modulation also inhibits the cell migration in SKHep1C3 cells. It has been shown that LASP-1 is im-plicated in cell migration processes, but its role in HCC cells has not yet been investigated. Therefore, to study the contribution of uPA and LASP-1 in SKHep1C3 motility, we carried out migration assays on SKHep1C3 pEF6, SKHep1C3 pEF6 uPA, and SKHep1C3 pEF6 LASP-1 cells. Ectopic overexpression of uPA and LASP-1 enhanced SKHep1C3 migration at comparable levels (1.31 ± 0.19 ÷ 1.37 ± 0.21-fold at T = 24 hours; 1.55 ± 0.07 ÷ 1.68 ± 0.031-fold at T = 48 hours from seeding) suggesting a relevant but not an additive effect of uPA and LASP-1 on SKHep1C3 cell motility (Figure 6E).
siRNA LASP-1 Silencing Is Associated with uPA Up-regulation
and Increased Migration Ability
Our second strategy to investigate the interplay between uPA and LASP-1 was the LASP-1 gene silencing. LASP-1 was silenced by transient transfection of siRNA in SKHep1C3 cells. The LASP-1 protein expression detected in transfected CE was inhibited by more than 96% at 100 nM siRNA LASP-1, 72 hours after transfection (Figure 7A). The uPA expression levels detected in the CM col-lected from siRNA LASP-1–transfected cells were upregulated by
Figure 4. Protein expression analysis of uPA and LASP-1 in human normal and HCC-derived cells. The WB and zymographic detection of uPA, as well as the WB analysis of LASP-1 and GAPDH reported in the correspondent panels, were carried out as follows: in un-differentiated HCC-derived cells, SKHep1C3, SKHep1C3.69.2 and HA22T/VGH cells (lanes 1, 2, and 5); in differentiated HCC-derived cells, HuH-6 and HepG2 (lanes 3 and 4); in AB2 human dermal fibroblasts (lane 6). The most aggressive HCC cells (SKHep1C3, SKHep1C3.69.2, and HA22T/VGH) showed a direct trend of uPA and LASP-1 expression, whereas the others did not express either uPA or LASP-1.
Figure 5. Plasmid-based overexpression of uPA and LASP-1 in SKHep1C3 cells. Reverse transcription–PCR showed uPA mRNA overexpression in SKHep1C3 pEF6 uPA cells (A, lane 2) and over-expression of LASP-1 mRNA in SKHep1C3 pEF6 LASP-1 cells (B, lane 3). Histograms represent mean values; bars, SD. **P < .01.
more than 1.8 ± 0.5- and 2.17 ± 0.75-fold, respectively, at 50 and 100 nM siRNA LASP-1, 72 hours after transfection (Figure 7B). The corresponding enzymatic activity was upregulated by more than 3.3 ± 0.55- and 2.99 ± 0.38-fold at 50 and 100 nM siRNA LASP-1, 72 hours after transfection (Figure 7C ). The down-regulation of LASP-1 protein expression led to an increased migration ability of siRNA LASP-1 SKHep1C3-transfected cells. The increases were by
2.6 ± 0.51- and 2.2 ± 0.57-fold, respectively, at 50 and 100 nM siRNA LASP-1 (Figure 7D).
siRNA LASP-1 Silencing Caused Changes in Actin
Filaments Organization
Because LASP-1 plays an important role in cytoskeleton organiza-tion, we then looked at microfilaments reorganization in parental and
Figure 6. uPA and LASP-1 protein expression levels’ evaluation of SKHep1C3 pEF6 (cells transfected with empty plasmid), SKHep1C3 pEF6 uPA (cells transfected with uPA-expressing constructs), SKHep1C3 pEF6 LASP-1 (cells transfected with LASP-1–expressing con-structs) by IF and WB analyses. Immunofluorescence analysis (A), WB and zymography (B) displayed uPA protein up-regulation in SKHep1C3 pEF6 uPA cells and LASP-1 up-regulation in SKHep1C3 pEF6 LASP-1 cells (C and D) compared with SKHep1C3 pEF6 control cells. Immunofluorescence analysis (C) and WB (D, lane 2) conducted on CE showed LASP-1 up-regulation also in SKHep1C3 pEF6 uPA. Migration assay (E). The cells that ectopically overexpressed uPA and LASP-1 displayed and increased migration ability atT = 24 and 48 hours after seeding. Histograms represent mean values; bars, SD. *P < .05.
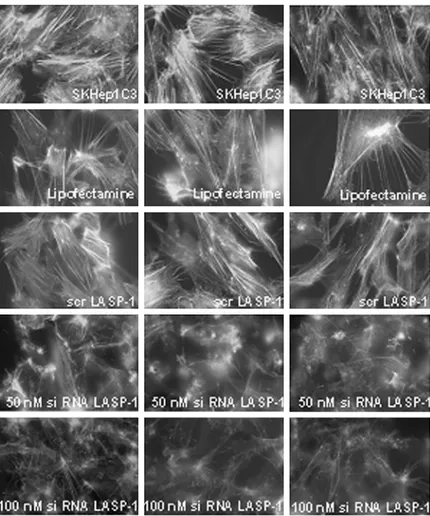
siRNA LASP-1–transfected cells. This was to verify whether up-regulation of uPA after LASP-1 silencing could depend on cytoskeleton rearrangements as described elsewhere. In siRNA LASP-1 transfec-tants, microfilaments of actin were severely disrupted compared with parental and scramble transfectants (Figure 8), supporting the fun-damental role of LASP-1 in cytoskeleton structure and probably in-creasing uPA secretion.
Expression of uPA and LASP-1 Might Depend on
Phosphoinositide-3 Kinase Signaling
To identify candidate mediators involved in the control of uPA and LASP-1 expression, we started to draw attention to the phos-phoinositide-3 kinase (PI3-K) complex. The cells were treated with LY294002, a specific inhibitor of PI3-K, for 30 minutes and sub-sequently serum-stimulated for 4, 8, and 24 hours. LY294002 led to uPA down-modulation at each time examined. The inhibition levels were 66%, 47%, and 57%, respectively, 4, 8, and 24 hours after treatment (Figure 9A). Eight hours after LY294002 treatment, LASP-1 protein expression was decreased by 50% in SKHep1C3 cells. The levels of the housekeeping protein GAPDH were com-parable at each time analyzed (Figure 9B). These results, showing the uPA and LASP-1 down-modulation after cell treatment with LY294002, suggest that uPA and LASP-1 expression might be par-tially PI3-K–dependent in SKHep1C3.
Discussion
Here, we have studied the proteome of RNAi-based uPA down-modulated HCC cells to identify uPA-associated downstream pro-teins in HCC cells. This is the first comprehensive proteome profile of uPA down-modulated cells, at least to our knowledge. Four pro-tein spots were found expressed differentially (downregulated) in shRNA uPA knockdown HCC cells compared with the unaffected ones. They corresponded to LASP-1, CK-1, CK-10, and HNRPH1. They take part directly or indirectly in the cytoskeleton structure and/ or organization of several cells [25,31]; HNRPH1 is implicated in mRNA metabolism and stability [32]. The validation experiments assessed by WB (all) and IF (LASP-1 and HNRPH1) showed the ef-fective inhibition of these four proteins. LASP-1 and HNRPH1 were not directly associated to the uPA-uPAR system not being present in the uPAR immunoprecipitate. HNRPH1 was found differentially expressed (down-modulated) in another proteomic profile of HCC cells in which silencing of a given gene was achieved by RNAi [33]. Whether HNRPH1 could be generally deregulated during the RNAi process into the cells (causing frequently mRNA degradation) is an interesting point that should be investigated further.
We then considered the information available on the proteins in-volved in cytoskeleton structure and/or organization, namely, LASP-1, CK-1, and CK-10, before looking at how the expression levels of these proteins (identified by proteomics) were related to uPA.
Cytokeratins, as intermediate filament components, were known as structural stabilizers of epithelial cells, and they have been shown to be expressed in a regulated tissue- and differentiation-specific man-ner. Mainly for this reason, the protein detection of CKs has been and is presently used as a specific marker of certain types of cancer of epithelial origins [31,34]. Much information are available in the litera-ture (as well as two catalogues of human CKs proposed in 1982 and in 2006), but, at a molecular level, little is known on the biologic and/ or signaling function of CKs in biologic processes, such as migration and proliferation. CK-1 and CK-10, mainly considered as skin disease markers [31], have started to appear in CKs profiles of hepatic tumor cells. But only very recently that the CK-10 detection has been as-sessed as a predictive marker for prognosis in HCC patients [35].
LASP-1 was reported as a ubiquitously expressed protein, with actin- and zyxin-binding properties, firstly isolated in 1995 from a breast cancer–derived metastatic lymph node cDNA library [23– 25]. It was also characterized as a component of the pseudopodium,
Figure 7. LASP-1 silencing by transient transfection of siRNA. In-hibition of LASP-1 protein expression by specific siRNA (A) is as-sociated to uPA overexpression both at protein (B) and enzymatic activity (C) levels. (A and B) Western blot analysis. (C) Zymography. The uPA up-regulation led to an increased migration ability in SKHep1C3 cells (D). Histograms represent mean values; bars, SD. *P < .05, **P < .01.
and evidence has shown its role in cell migration and in actin cyto-skeleton organization at the leading edges of migrating cells of stimu-lated normal cells or cultured tumor cells (i.e., breast cancer cells). Because the uPA-uPAR system can induce directional proteolysis at the leading edges of motile and invasive cells [6,7], we have preferred to first design a study on the relation between uPA and LASP-1. The aim of this design was to contribute to research on the motility of cancer cells, in particular of HCC-derived cells, and to add knowl-edge to a protein identified 13 years ago [23–25]. To carry out this study, our first approach was gene overexpression. The results from the stable expression of uPA and LASP-1 in SKHep1C3 cells sup-ported our proteomic data; in fact, uPA ectopic overexpression led to 1.5-fold LASP-1 up-regulation, whereas LASP-1 ectopic overexpres-sion did not alter uPA expresoverexpres-sion. This would suggest that uPA plays a role in controlling the level of LASP-1 expression but not vice versa. Our second approach was the LASP-1 knockdown. The strong si-lencing of LASP-1 led to enhanced uPA secretion at both protein and enzymatic levels and, consequently, to SKHep1C3 increased mi-gration ability. uPA induction after LASP-1 down-modulation could be considered a surprising result as the proteomic data might indicate that LASP-1 inhibition would go with uPA knockdown. We should take into account that 1) in the case of shRNA targeting uPA, LASP-1 silencing was obtained after uPA down-modulation, whereas the LASP-1 silencing by siRNA was direct and specific. It is likely that in the former case, uPA may influence LASP-1 expression using as
yet unknown mediators; 2) LASP-1 silencing by siRNA was very high (up to 96%, 72 hours after transfection), whereas LASP-1 si-lencing after shRNA uPA inhibition was 49% to 53%. We suppose that LASP-1 inhibition after siRNA transfection may have gen-erated different effects compared with those after uPA silencing. Indeed, the different levels of LASP-1 down-modulation could vari-ably contribute to cellular phenotypes. LASP-1 is an actin-binding protein; it is localized in the membrane extension during epithelial cancer cell motility and it participates in the modifications of the cytoskeleton in migratory cells [23–25]. Indeed, in siRNA LASP-1 SKHep1C3-transfected cells, there was a severe disruption of the stress fibers. We therefore hypothesize that in SKHep1C3 cells, a strong LASP-1 silencing by siRNA could influence actin filament dy-namics, thus promoting cytoskeleton rearrangements that could in-crease uPA secretion. This result differs from that in ovarian cancer SKOV-3 cells in which LASP-1 silencing did not promote changes in the actin stress fibers [36] suggesting LASP-1’s different roles in different tumor cells. It is well known that cytoskeleton rearrange-ments can influence gene expression including uPA induction in cer-tain cell types [37–39]. Therefore, the increased migration ability of SKHep1C3 cells probably caused by uPA induction after LASP-1 si-lencing should not be considered unexpected. Indeed, uPA plays a rele-vant role in the migration of many tumor cells [6,7]. Moreover, we previously showed that uPA silencing causes migration inhibition of SKHep1C3 cells [15,30].
Figure 8. Actin cytoskeleton organization in SKHep1C3 siRNA LASP-1 transfected and parental cells. In SKHep1C3 siRNA LASP-1 trans-fectants, microfilaments of actin showed by fluorescein isothiocyanate–labeled phalloidin were severely disrupted compared with con-trol (parental and scramble) transfectants (original magnification, ×63).
A very interesting point is whether uPA collaborates with LASP-1 in SKHep1C3 migration. Although LASP-1 has been found to be im-plicated in cell migration [24], its role is not completely clear. For instance, in the BT-20 breast cancer cell line, both LASP-1 down-modulation and overexpression lead to migration inhibition [40]; in nonneoplastic PTK2 cells, LASP-1 overexpression leads to increased migration [36]. In our system, both LASP-1 overexpression and si-lencing increased its migrational ability. It is likely that the deregula-tion of LASP-1 expression level might determine changes in tumor cell migration. We believe that LASP-1 may be a mediator of uPA in SKHep1C3 migration by playing a role in the cytoskeletal change that occurs in cell motility. Moreover, we found CK-1 and CK-10 ex-pression inhibition after uPA silencing. CK-1 and CK-10 are proteins of the intermediate filaments essential for cytoskeletal structure and maintenance [34]. Cytokeratins have been involved in HCC malig-nancy, and their overexpression has been associated with unfavorable
diagnosis in several tumors including HCC [41,42]. Taken together with our results, this would suggest that down-modulation of LASP-1, CK-1, and CK-10 expression due to uPA knockdown could interfere with cytoskeleton organization and therefore with SKHep1C3 migra-tion. Nevertheless, we could not exclude changes in subcellular reloca-lization of LASP-1, as reported very recently in breast cancer cells after uPA inhibition by ectopic expression of the transcription factor PDEF (prostate-derived epithelial factor) [43].
As mentioned above, uPA and LASP-1 expression seems to be closely related in SKHep1C3 cells. This is not SKHep1C3-specific because we found that LASP-1 and uPA expression is coordinated in other undifferentiated HCC-derived cells, HA22T/VGH and SKHep1C3.69.2 cells, and that human normal cells, AB2 dermal fibroblasts, do not express either LASP-1 or uPA. Finally, to identify candidate mediators of uPA and LASP-1 expression, we examined the involvement of the PI3-K complex. This was because uPA ex-pression in several tumor cell types depends on PI3-K/Akt signaling [44,45]. In breast cancer, LASP-1 expression could be induced by IGF-IR in a PI3-K pathway-dependent manner [46]. Our data from PI3-K inhibition by specific LY294002 inhibitor showed the first evidence that uPA and LASP-1 expression might be partially PI3-K– dependent in SKHep1C3 cells. Whether uPA controls the LASP-1 expression level by PI3-K and/or by other kinase systems is open to further investigation.
In conclusion, we identified a new set of uPA-related proteins that were down-modulated after uPA RNAi. In all probability, LASP-1 (and perhaps CK-1 and CK-10) is a mediator of uPA for SKHep1C3 migration. HNRPH1 probably plays a role during mRNA degrada-tion on uPA silencing by RNAi [15] and/or in uPA mRNA stabil-ity. These findings shed light on the role of uPA in HCC cells and may help to find a more successful experimental uPA target therapy in vitro and/or in experimental animal models.
Acknowledgments
The authors thank Dott. Robert Coates (Centro Linguistico, University of Brescia), Medical Writer, for his linguistic revision and correction of the manuscript.
References
[1] Thorgeirsson SS and Grisham JW (2002). Molecular pathogenesis of human hepatocellular carcinoma. Nat Genet31, 339–346.
[2] Pawlik TM, Esnaola NF, and Vauthe J (2004). Surgical treatment of hepato-cellular carcinoma: similar long-term results despite geographic variations. Liver Transpl10, 74–80.
[3] Hwang LH (2006). Gene therapy strategies for hepatocellular carcinoma. J Biomed Sci13, 453–468.
[4] De Petro G, Tavian D, Copeta A, Portolani N, Giulini SM, and Barlati S (1998). Expression of urokinase-type plasminogen activator (u-PA), u-PA receptor, and tissue-type PA messenger RNAs in human hepatocellular carcinoma. Cancer Res 58, 2234–2239.
[5] Irigoyen JP, Munoz-Canoves P, Montero L, Koziczak M, and Nagamine Y (1999). The plasminogen activator system: biology and regulation. Cell Mol Life Sci56, 104–132.
[6] Stepanova VV and Tkachuk VA (2002). Urokinase as a multidomain protein and polyfunctional cell regulator. Biochemistry (Mosc)67, 109–118.
[7] Blasi F and Carmeliet P (2002). u-PAR: a versatile signalling orchestrator. Nat Rev Mol Cell Biol3, 932–943.
[8] Danø K, Beherendt N, Høyer-Hansen G, Johnsen M, Lund LR, Ploug M, and Rømer J (2005). Plasminogen activation and cancer. Thromb Haemost93, 676–681.
[9] Hildenbrand R, Gandhari M, Stroebel P, Marx A, Allgayer H, and Arens N (2008). The urokinase-system—role of cell proliferation and apoptosis. Histol Histopathol23, 227–236.
Figure 9. Treatment of SKHep1C3 cells with the LY294002–PI3-K inhibitor. LY294002 inhibited the uPA and LASP-1 expression in SKHep1C3 cells. LY294002 led to uPA down-modulation verified by zymography at each time analyzed (A). LASP-1 protein expres-sion assessed by WB was decreased 8 hours after LY294002 treatment of SKHep1C3 cells (B). Data from a representative ex-periment are shown in this figure.
[10] Schmitt M, Harbeck N, Thomssen C, Wilhelm O, Magdolen V, Reuning U, Ulm K, Höfler H, Janicke F, and Graeff H (1997). Clinical impact of the plas-minogen activation system in tumor invasion and metastasis: prognostic rele-vance and target for therapy. Thromb Haemost78, 285–296.
[11] Muehlenweg B, Sperl S, Magdolen V, Schmitt M, and Harbeck N (2001). In-terference with the urokinase plasminogen activator system: a promising therapy concept for solid tumours. Expert Opin Biol Ther1, 683–691.
[12] Kondraganti S, Gondi CS, McCutcheon I, Dinh DH, Gujrati M, Rao JS, and Olivero WC (2006). RNAi-mediated downregulation of urokinase plasminogen activator and its receptor in human meningioma cells inhibits tumor invasion and growth. Int J Oncol6, 1353–1360.
[13] Wang Y, Liang X, Wu S, Murrell GA, and Doe WF (2001). Inhibition of colon cancer metastasis by a 3′-end antisense urokinase receptor mRNA in a nude mouse model. Int J Cancer92, 257–262.
[14] Joossens J, Ali OM, El-Sayed I, Surpateanu G, Vander Veken P, Lambeir AM, Setyono-Han B, Foekens JA, Schneider A, Schmalix W, et al. (2007). Small, po-tent, and selective diaryl phosphonate inhibitors for urokinase-type plasminogen activator with in vivo antimetastatic properties. J Med Chem50, 6638–6646. [15] Salvi A, Arici B, De Petro G, and Barlati S (2004). Small interfering RNA
uro-kinase silencing inhibits invasion and migration of human hepatocellular carci-noma cells. Mol Cancer Ther3, 671–678.
[16] Salvi A, Arici B, Alghisi A, Barlati S, and De Petro G (2007). RNA interference against urokinase in hepatocellular carcinoma xenografts nude mice. Tumour Biol 28, 16–26.
[17] Fire A, Xu S, Montgomery MK, Kostas SA, Driver SE, and Mello CC (1998). Potent and specific genetic interference by double-stranded RNA in Caenorhabditis elegans. Nature39, 806–811.
[18] Agami R (2002). RNAi and related mechanisms and their potential use for ther-apy. Curr Opin Chem Biol6, 829–834.
[19] Tuschl T (2002). Expanding small RNA interference. Nat Biotechnol20, 446–448. [20] Dorsett Y and Tuschl T (2004). siRNAs: applications in functional genomics
and potential as therapeutics. Nature Rev3, 318–329.
[21] Ahmed N, Oliva K, Wang Y, Quinn M, and Rice G (2003). Proteomic profiling of proteins associated with urokinase plasminogen activator receptor in a colon cancer cell line using an antisense approach. Proteomics3, 288–298. [22] Ma W, Chen J, Xue X, Wang Z, Liu H, Wang T, Bai Y, Tang SC, and Zhou Q
(2008). Alteration in gene expression profile and biological behavior in human lung cancer cell line NL9980 by nm23-H1 gene silencing. Biochem Biophys Res Commun371, 425–430.
[23] Schreiber V, Moog-Lutz C, Régnier CH, Chenard MP, Boeuf H, Vonesch JL, Tomasetto C, and Rio MC (1998). Lasp-1, a novel type of actin-binding protein accumulating in cell membrane extensions. Mol Med4, 675–687.
[24] Lin YH, Park ZY, Lin D, Brahmbhatt AA, Rio MC, Yates JR, and Klemke RL (2004). Regulation of cell migration and survival by focal adhesion targeting of Lasp-1. J Cell Biol165, 421–432.
[25] Grunewald TG and Butt E (2008). The LIM and SH3 domain protein family: structural proteins or signal transducers or both? Mol Cancer7, 31.
[26] Gorla L, Modellini P, Cuccuru G, Miccichè F, Cassinelli G, Cremona M, Pierotti MA, Lanzi C, and Bongarzone I (2008 Aug 28). Proteomics study of medullary thyroid carcinomas expressing RET germ-line mutations: identifica-tion of new signaling elements. Mol Carcinog [Epub ahead of print]. [27] Barlati S, Zoppi N, Copeta A, Tavian D, De Petro G, and Colombi M (1999).
Quantitative in situ hybridization for the evaluation of gene expression in asyn-chronous and synchronized cell cultures and in tissue sections. Histol Histopathol 14, 1231–1240.
[28] De Petro G, Copeta A, and Barlati S (1994). Urokinase-type and tissue-type plasminogen activators as growth factors of human fibroblasts. Exp Cell Res 213, 286–294.
[29] Notarbartolo M, Poma P, Perri D, Dusonchet L, Cervello M, and D’Alessandro N (2005). Antitumor effects of curcumin, alone or in combination with cisplatin or
doxorubicin, on human hepatic cancer cells. Analysis of their possible relationship to changes in NF-κB activation levels and IAP gene expression. Cancer Lett 224, 53–65.
[30] Tavian D, Salvi A, De Petro G, and Barlati S (2003). Stable expression of anti-sense urokinase mRNA inhibits the proliferation and invasion of human hepato-cellular carcinoma cells. Cancer Gene Ther10, 112–120.
[31] Moll R, Divo M, and Langbein L (2008). The human keratins: biology and pathology. Histochem Cell Biol129, 705–733.
[32] Singh OP (2001). Functional diversity of hnRNP proteins. Indian J Biochem Biophys38, 129–134.
[33] Chen Y, Lin MC, Wang H, Chan C, Jiang L, Ngai SM, Yu J, He M, Shaw P-C, Yew DT, et al. (2007). Proteomic analysis of EZH2 downstream target proteins in hepatocellular carcinoma. Proteomics7, 3097–3104.
[34] Strnad P, Stumptner C, Zatloukal K, and Denk H (2008). Intermediate fila-ment cytoskeleton of the liver in health and disease. Histochem Cell Biol129, 735–749.
[35] Yang X-R, Xu Y, Shi G-M, Fan J, Zhou J, Ji Y, Sun H-C, Qiu S-J, Yu B, Gao Q, et al. (2008). Cytokeratin 10 and cytokeratin 19: predictive markers for poor prognosis in hepatocellular carcinoma patients after curative resection. Clin Cancer Res14, 3850–3859.
[36] Grunewald TG, Kammerer U, Winkler C, Schindler D, Sickmann A, Honig A, and Butt E (2007). Overexpression of LASP-1 mediates migration and prolifera-tion of human ovarian cancer cells and influences zyxin localisaprolifera-tion. Br J Cancer 96, 296–305.
[37] Botteri FM, Ballmer-Hofer K, Rajput B, and Nagamine Y (1990). Disruption of cytoskeletal structures results in the induction of the urokinase-type plasmino-gen activator plasmino-gene expression. J Biol Chem265, 13327–13334.
[38] Irigoyen JP and Nagamine Y (1999). Cytoskeletal reorganization leads to induc-tion of the urokinase-type plasminogen activator gene by activating FAK and Src and subsequently the Ras/Erk signaling pathway. Biochem Biophys Res Commun 262, 666–670.
[39] Degryse B, Orlando S, Resnati M, Rabbani SA, and Blasi F (2001). Urokinase/ urokinase receptor and vitronectin/alpha(v)beta(3) integrin induce chemotaxis and cytoskeleton reorganization through different signaling pathways. Oncogene 20, 2032–2043.
[40] Grunewald TG, Kammerer U, Schulze E, Schindler D, Honig A, Zimmer M, and Butt E (2006). Silencing of LASP-1 influences zyxin localization, inhibits proliferation and reduces migration in breast cancer cells. Exp Cell Res312, 974–982.
[41] Uenishi T, Kubo S, Yamamoto T, Shuto T, Ogawa M, Tanaka H, Tanaka S, Kaneda K, and Hirohashi K (2003). Cytokeratin 19 expression in hepatocellular carcinoma predicts early postoperative recurrence. Cancer Sci94, 851–857. [42] Ding SJ, Li Y, Shao XX, Zhou H, Zeng R, Tang ZY, and Xia QC (2004).
From proteomic analysis to clinical significance: overexpression of cytokeratin 19 correlates with hepatocellular carcinoma metastasis. Mol Cell Proteomics3, 73–81.
[43] Turner DP, Findlay VJ, Kirven AD, Moussa O, and Watson DK (2008). Global gene expression analysis identifies PDEF transcriptional networks regulating cell migration during cancer progression. Mol Biol Cell19 (9), 3745–3757 [Epub 2008 Jun 25].
[44] Kusch A, Tkachuk S, Haller H, Dietz R, Gulba DC, Lipp M, and Dumler I (2000). Urokinase stimulates human vascular smooth muscle cell migra-tion via a phosphatidylinositol 3-kinase–Tyk2 interacmigra-tion. J Biol Chem 275, 39466–39473.
[45] Chandrasekar N, Mohanam S, Gujrati M, Olivero WC, Dinh DH, and Rao JS (2003). Downregulation of uPA inhibits migration and PI3k/Akt signaling in glioblastoma cells. Oncogene22, 392–400.
[46] Loughran G, Huigsloot M, Kiely PA, Smith LM, Floyd S, Ayllon V, and O’Connor R (2005). Gene expression profiles in cells transformed by over-expression of the IGF-I receptor. Oncogene24, 6185–6193.
Spot Number Score Hits AC ID DE Mw pI Cov 2750 113.12 18 P31943 HNRH1_HUMAN (C_1) Heterogeneous nuclear ribonucleoprotein… 49 5.9 38 2753 78.15 14 Q14847 LASP1_HUMAN (C_1) LIM and SH3 domain protein 1. 30 6.6 39 2633 49.9 12 P13645 K1C10_HUMAN (C_1) Keratin, type I cytoskeletal 10. 60 5.1 22 2748 31.64 14 P04264 K2C1_HUMAN (C_1) Keratin, type II cytoskeletal 1. 66 8.2 33 23.31 15 P13645 K1C10_HUMAN (C_1) Keratin, type II cytoskeletal 10. 60 5.1 24 2747 23.59 10 P04264 K2C1_HUMAN (C_1) Keratin, type II cytoskeletal 1. 66 8.2 21 AC indicates SwissProt Accession Number; Cov, sequencw coverage (%); DE, description; ID, identified protein; Mw, molecular weight; pI, isoelectric point.
Figure W1. Presence of plasmid constructs in SKHep1C3 cell genomes and construct expressions. The main features of the pEF6/ V5-His TOPO vector used to clone uPA and LASP-1 CDS are presented (A). PCR detection of plasmid DNA in SKHep1C3 genomes, using insert-specific forward primers (T7) and plasmid-specific reverse primers, displayed the expected bands of 1429 and 913 bp for uPA- and LASP-1–expressing constructs, respectively (B, left and right). The insert expression was analyzed by RT-PCR using plasmid-specific primers (T7 and V5). The bands obtained were 1520, 1004, and 200 bp for uPA, LASP-1, and empty constructs, respectively (C).C− indicates PCR-negative control;C+, plasmid DNA;M, marker VIII.