subjects, independent of cultural differences, traffic density, and geographical area.[2‑4] A recent multicentric study demonstrated that a treatment with continuous positive airway pressure (CPAP) in patients with OSA can solve EDS.[5] Therefore it is important to evaluate sleepiness in these subjects. Currently the most used screening test for the evaluation of sleepiness is the Epworth Sleepiness Scale (ESS).[6] This is a validated operator‑independent test, conceived for the assessment of the symptom of sleepiness independently from the undergoing pathology.[7] It is based on eight self‑administered questions designed
INTRODUCTION
Sleepiness is a complex phenomenon characterized by both neurovegetative and cognitive aspects. Sleep‑related disorders (SRD) and in particular obstructive sleep apnea (OSA) are the most frequent causes of excessive daytime sleepiness (EDS) in the presence of adequate sleeping time.[1] Falling asleep behind the wheel is one of the most relevant consequences of OSA. A number of studies throughout the world showed a significant increase of road accidents among patients with OSA compared to healthy
Background: Falling asleep behind the wheel is one of the most relevant consequences of obstructive sleep apnea (OSA).
We created a new screening questionnaire, named the Driver Sleepiness Score (DSS), aiming to assess sleepiness in
drivers with suspected OSA. The primary aim of our study was to evaluate sleepiness in drivers with a suspicion of OSA by the DSS in order to assess its correlation with the apnea‑hypopnea index (AHI), oxygen desaturation index (ODI), and total sleep time with oxyhemoglobin saturation below 90% (TST90). We also aimed to assess the diagnostic accuracy of DSS for three different cutoffs of AHI (AHI = 5, AHI = 15, AHI = 30), which allow stratification of the severity of OSA. Materials and Methods: Seventy‑three driving patients at risk for OSA participated in the study. DSS and the
Epworth Sleepiness Scale (ESS) were both administered in operator‑dependent modality and in randomized sequence.
Results: The DSS showed higher accuracy in screening patients with mild OSA [area under curve (AUC): 0.88 vs
0.74] and moderate OSA (AUC: 0.88 vs 0.79), whereas ESS showed higher accuracy in screening patients with severe OSA (AUC: 0.91 vs 0.78). A DSS score ≥ 7 is the optimal cutoff for distinguishing true positives from false positives for the presence of OSA and for its different severity levels. The administration of both questionnaires increases the accuracy for the detection of all OSA severity levels. Conclusions: If validated, DSS may qualify as a new screening
tool specifically for drivers with the suspicion of having OSA, in combination with the ESS. KEY WORDS: Obstructive sleep apnea (OSA), road accidents, screening questionnaires
A new approach for the assessment of sleepiness and
predictivity of obstructive sleep apnea in drivers: A pilot study
Vitaliano Nicola Quaranta, Silvano Dragonieri, Pierluigi Carratù, Vito Antonio Falcone, Elisa Carucci, Teresa Ranieri, Valentina Ventura, Onofrio RestaDepartment of Respiratory Diseases, University of Bari, Bari, Italy
ABSTRACT
Address for correspondence: Dr. Silvano Dragonieri, Department of Respiratory Diseases, University of Bari, Piazza Giulio Cesare 11, Bari ‑ 70100, Italy. E‑mail: [email protected]
Access this article online
Quick Response Code:
Website:
www.lungindia.com
DOI:
10.4103/0970-2113.173061
Original Article
How to cite this article: Quaranta VN, Dragonieri S, Carratù P,
Falcone VA, Carucci E, Ranieri T, et al. A new approach for the assessment of sleepiness and predictivity of obstructive sleep apnea in drivers: A pilot study. Lung India 2016;33:14-9.
This is an open access article distributed under the terms of the Creative Commons Attribution-NonCommercial-ShareAlike 3.0 License, which allows others to remix, tweak, and build upon the work non-commercially, as long as the author is credited and the new creations are licensed under the identical terms.
to discern the possibility that a patient may fall asleep in eight different situations. An ESS score ≥10 is considered as the cutoff for pathologic sleepiness.[6,8] However, only one question out of eight on the ESS investigates sleepiness behind the wheel (12.5% of the total ESS score). Moreover, the ESS has no explicit mention of falling asleep behind the wheel, which is the worst consequence of daytime sleepiness. Based on the above, our center created a new operator‑dependent screening questionnaire named the Driver Sleepiness Score (DSS), with the aim of assessing sleepiness in drivers with suspected OSA and to detect in this specific group of individuals those with OSA, regardless of the presence of other symptoms.
Therefore the primary aim of our study was to evaluate sleepiness in drivers with a suspicion of OSA by the DSS in order to assess its correlation with the apnea‑hypopnea index (AHI), oxygen desaturation index (ODI) and total sleep time with oxyhemoglobin saturation below 90% (TST90). We also aimed to assess the diagnostic accuracy of DSS for three different cutoffs of AHI (AHI = 5, AHI = 15, AHI = 30), which allowed stratification of the severity of sleep apnea.[9]
MATERIALS AND METHODS
Patients
A total number of 73 patients volunteered to participate in the study. Patients were selected from among those attending the sleep outpatient clinic of the Pulmonology Unit of the Ospedale Policlinico, Bari, Italy in the period from January 2012 to April 2013. All patients had a positive medical history for the presence of OSA‑related symptoms, including sudden arousals with the sensation of suffocation, snoring, nycturia/ and worsening of daytime performance. Moreover, the anthropometric data, body mass index (BMI), neck circumference, and Mallampati score were measured. We considered patients to be at risk for OSA if they had at least two of the symptoms above and at least one of the following conditions: Neck circumference >43 cm in men and >41 cm in women, BMI >28, Mallampati score ≥2. Moreover, all patients had driving licenses and were regular drivers. The study was approved by the local Ethics Committee and all patients were asked to sign their informed consent.
Study design
We conducted a prospective longitudinal study. The measurements were performed in 2 days within a 10‑day period. On day 1 the patients were screened for the presence of OSA‑related symptoms. The DSS and the ESS were both administered in operator‑dependent modality. Questionnaires were administered by the same medical operator, and patients were randomized into two groups for the sequence of administration: One group of 36 patients first received the DSS and then the ESS, whereas the other group of 37 patients first received the ESS and then the DSS. On day 2 the patients were admitted to our ward and undertook cardiorespiratory nocturnal monitoring.
DSS
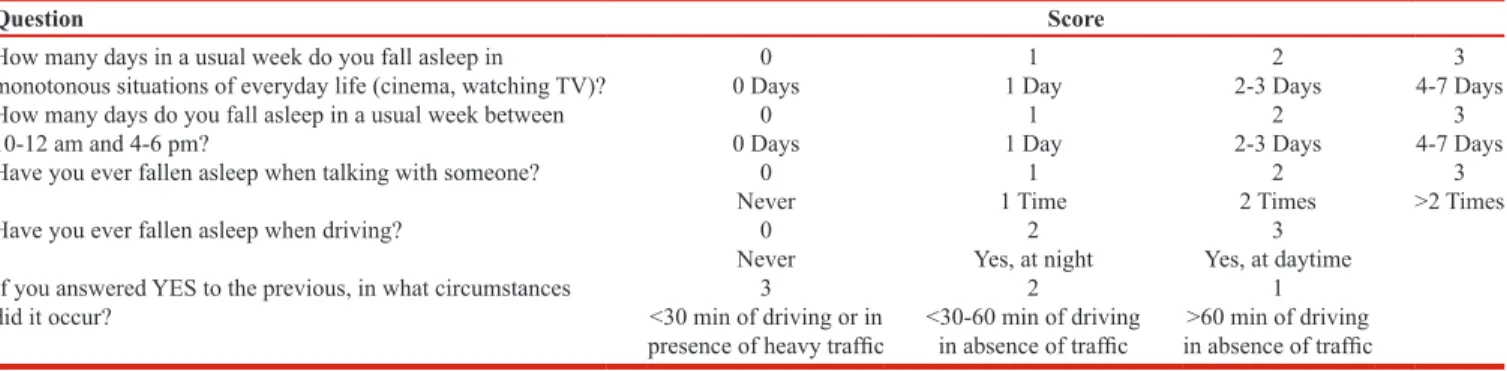
The new operator‑dependent DSS questionnaire has a total of five questions. The operator assigns a score between 0 and 3 for each of the questions [Table 1]. The DSS questionnaire has been specifically designed to evaluate sleepiness in drivers. In fact, two questions out of five (40% of the total score) investigate the presence of sleepiness behind the wheel and their circumstances in detail – DSS question number 1 investigates with a semiquantitative criterion the likelihood of the patient falling asleep during a monotonous situation in 1 week. DSS question number 2 assigns a semiquantitative score according to the likelihood of falling asleep in specific time frames (10–12 AM and 4–6 PM). This choice was due to the circadian rhythm that has led to the concept of “sleep gates” preceded by the “forbidden zones.”[10] DSS question number 3 investigates the probability of falling asleep during a conversation. This is a severe condition of sleepiness because all the attentive stimuli that inhibit sleep are active when one is talking. For this reason we applied a different semiquantitative criterion from that of questions 1 and 2, and falling asleep more than two times in total during a conversation was sufficient for assigning a score of 3. In the DSS the presence of only one instance of nodding off at the wheel assigned to question number 4 a minimum score of 2 instead of 1, due to the severity of the occurrence. Moreover, we assigned a score of 2 if it occurred at night and a score of 3 if during daytime, which reflects the higher severity of the disturbances. Similarly, DSS question number 5 assigns a score of 1 if sleepiness occurred after 1 h of driving in absence of traffic, a score of 2 if it occurred between 30 min and 60 min without traffic, and a score of 3 if it occurred before 30 min without traffic or in heavy traffic conditions. This is due to the fact that sleepiness after a short time driving and/or in heavy traffic is a more severe condition.
Cardiorespiratory nocturnal monitoring
Cardiorespiratory nocturnal monitoring was done in ambient air and spontaneous breathing using a portable 4‑channel/8‑track polygraph (Somnea, Assago, Italy). Oxyhemoglobin saturation, heart rate, body posture, oronasal air flow, snoring sounds, and thoracic and abdominal movements were recorded in detail. AHI, ODI, and TST90 were calculated. OSA was defined by AHI ≥5 in the presence of hypnagogic symptoms or by AHI ≥15 without symptoms.[9] We further divided our study population into three groups according to their AHI (mild OSA: 5≥AHI≥15; moderate OSA: 15≥AHI≥30; severe OSA: AHI ≥30) [Table 2].[9]
Data analysis
The correlation between each of the nocturnal cardiorespiratory indices (AHI, ODI, TST90) and the ESS and the DSS was calculated. The Spearman correlation coefficient was used to assess the correlation between the DSS and the ESS in the entire study population and in different risk groups. Moreover, a correlation between ESS and DSS values was assessed.
Subsequently, a receiver‑operator characteristic curve (ROC curve) was created for determining the accuracy of both the DSS and the ESS, assuming AHI ≥5, AHI ≥15, and AHI ≥30, respectively as values of positivity for the test, according to the OSA severity grading. Finally, we detected the cutoff value of the DSS, which predicts the presence of AHI ≥5, AHI ≥15, and AHI ≥30, respectively, with the highest accuracy.
We calculated sensitivity, specificity, positive predictive value (PPV), and negative predictive value (NPV) of both the ESS and the DSS for the presence of AHI ≥5, AHI ≥15, and AHI ≥30. We used a ESS ≥11 for cutoff[6,8] as well as the DSS cutoff detected in the previous statistical analysis. Moreover, in order to determine whether the DSS improved the screening ability of the ESS, we calculated sensitivity, specificity, PPV, and NPV of the combination of the two questionnaires (positivity for ESS or DSS). According to the parallel strategy, the combination is positive if at least one test is positive. It is negative if all tests are negative.[11]
Furthermore, a separate bivariate logistic regression model was used to determine the odds ratio (OR) in predicting OSA.
Finally, we calculated the sensitivity, specificity, PPV, and NPV for the presence of nodding off behind the wheel on both the ESS (cutoff ≥10) and the DSS (cutoff detected by previous statistical analysis). A P < 0.05 was considered statistically significant.
RESULTS
The subject characteristics of the two groups are described in Table 2. Directly proportional positive correlations between the DSS and the ESS (r = 0.661, P = 0.000, Figure 1), between the ESS and the AHI (r = 0.610, P = 0.000), and between the DSS and AHI (r = 0.638, P = 0.000, Figure 2) were shown. The DSS and the ESS also positively correlate with both ODI (r = 0.581, P = 0.000; r = 0.610,
P = 0.000, respectively) and TST90 (DSS: r = 0.265, P = 0.000; r = 0.431, P = 0.000, respectively). The DSS
showed significantly higher accuracy in screening patients with mild OSA (AUC: 0.88 vs 0.74, P < 0.05, Figure 3) and moderate OSA (AUC: 0.88 vs 0.79, P < 0.05, Figure 4), whereas the ESS had higher accuracy in screening patients with severe OSA (AUC: 0.91 vs 0.78, P < 0.05, Figure 5). A DSS score ≥7 is the optimal cutoff for discriminating true positives from false positives for the presence of OSA and for its different severity levels.
Table 3 shows that sensitivity, specificity, PPV, and NPV are higher in the DSS compared to ESS in predicting patients with mild and moderate OSA. However, the ESS is more powerful than the DSS in detecting patients with severe OSA. Therefore, the administration of both questionnaires increases accuracy for the detection of all OSA severity levels.
DISCUSSION
In the present study we proposed a new questionnaire for evaluating sleepiness specifically designed for drivers with a suspicion of OSA. To the best of our knowledge this is the first study applying such a screening method for this specific category of patients. The choice of drivers as a study group was due to the high diffusion in terms of
Table 1: The DSS questionnaire (translated from the Italian)
Question Score
How many days in a usual week do you fall asleep in
monotonous situations of everyday life (cinema, watching TV)? 0 Days0 1 Day1 2-3 Days2 4-7 Days3 How many days do you fall asleep in a usual week between
10-12 am and 4-6 pm? 0 Days0 1 Day1 2-3 Days2 4-7 Days3
Have you ever fallen asleep when talking with someone? 0 1 2 3
Never 1 Time 2 Times >2 Times
Have you ever fallen asleep when driving? 0 2 3
Never Yes, at night Yes, at daytime If you answered YES to the previous, in what circumstances
did it occur? <30 min of driving or in 3 2 1
presence of heavy traffic <30-60 min of driving in absence of traffic in absence of traffic>60 min of driving
Table 2: Demographic characteristics and baseline sleep parameters of the study population (N=73)
Parameter Value (mean±SD,
except for sex and AHI)
Age (years) 58.37±11.76 Sex, Male (N %) 50 (68.5) BMI kg/m2 65.80±34.09 Neck circumference cm 43.59±2.13 AHI score/h 27.83±23.62 AHI<5 vs 5≤AHI <15 vs 15 ≤AHI<30 vs AHI≥30 (N %) 13 (17.8) vs 14 (19.2) vs 17 (23.3) vs 29 (39.7) ODI/h 27.03±24.07 TST90% 22.82±25.66 SaO2 nocturnal % 92.25±2.72 ESS 10.25±4.90 DSS 7.86±4.20 pH 7.42±0.2 pO2 mmHg 77.53±11.33 pCO2 mmHg 43.87±6.14 HCO3− mmHg 28.14±2.98 SaO2% 95.36±1.88
SD=Standard deviation, pO2=Partial pressure of oxygen in arterial blood, pCO2=Partial pressure of carbon dioxide in arterial blood, HCO3− =
Bicarbonate, SaO2=Arterial oxyhemoglobin saturation, BMI=Body mass index, AHI=Apnea-hypopnea index, ODI=Oxygen desaturation index, TST=Total sleep time, ESS=Epworth Sleepiness Scale, DSS=Driver Sleepiness Score
prevalence and incidence of OSA and also the relevance of the serious consequences of daily sleepiness, such as road accidents.[2‑4,12‑19] Based on our results, the DSS is an applicable screening tool for this category of patients. We calculated the DSS ≥7 as a cutoff value for the most accurate detection of OSA.
In our study we aimed to compare the new DSS questionnaire with the ESS, both administered in
operator‑dependent modality. The DSS has been designed to be administered by medical personnel with experience with sleep disturbances. In particular, DSS question number 2 requires active participation by the physician. The operator can model the questions based on the patient’s lifestyle or habits. It is self‑evident that the role of the interviewer is essential for the DSS. For a better comparison to the DSS, the ESS was also administered in the same operator‑dependent modality. Although the Figure 1: Correlation between DSS and ESS: r of Spearman = 0.661,
P = 0.000 Figure 2: Correlation between DSS and AHI: r of Spearman = 0.638, P = 0.000
Figure 3: Accuracy of both DSS and ESS in detecting patients with
AHI ≥5 vs AHI <5. The DSS has an accuracy of 88.30% (AUC = 0.88) [95% confidence interval (CI) =80.30–96.20%]. The ESS has an accuracy of 74.20% (AUC 0.74) (95% CI = 58.40–90.10%)
Figure 4: Accuracy of both DSS and ESS in detecting patients with
AHI ≥15 vs AHI <15. The DSS has an accuracy of 88.80% (AUC 0.88) (95% CI = 81.60–96.10%). The ESS has an accuracy of 79.00% (AUC 0.79) (95% CI = 68.70–89.30%)
Table 3: Predictive parameters for ESS and DSS questionnaires for mild OSA (AHI ≥5), moderate OSA (AHI ≥15), and severe OSA (AHI ≥30)
Subgroup Mild OSA Moderate OSA Severe OSA
Questionnaire cutoff (%) DSS≥7 ESS≥11 DSS≥7 or ESS≥11 DSS≥7 ESS≥11 DSS≥7 or ESS≥11 DSS≥7 ESS≥11 DSS≥7 or ESS≥11
ESS has only been validated as self‑reported,[20] it has been previously shown that in operator‑dependent modality it correlates better with the AHI when compared to the ESS in operator‑independent modality.[21] Moreover, patients were randomized for the sequence of administration of both the DSS and the ESS in order to minimize the influence of one questionnaire on the other.
Therefore, we verified that both DSS and ESS (operator‑dependent) positively correlate with AHI and between each other.
Both questionnaires showed sensitivity and NPV lower than specificity and PPV for all the severity levels of OSA. The NPV of single tests (ESS or DSS) and combined tests (ESS and DSS) in detecting patients with mild OSA is lower than that for patients with moderate and severe OSA. This may be due to the fact that the symptoms are blurred in milder OSA – thus the likelihood of having false negatives is higher. Nevertheless, in our results, even for mild OSA the DSS showed a higher NPV compared to ESS, and the combined tests (ESS or DSS) further improved these data. The ESS measures average sleep propensity across a range of specified situations in daily life, but it is subjective, so it was not surprising that the sensitivity was rather low and the specificity moderate in our study, similar to other studies.[8,22] However, DSS ≥7 showed higher sensitivity and NPV compared to ESS ≥11 (63.33% vs 45.00% and 37.14% vs 23.25%, respectively). These findings could be due to the fact that the DSS is more accurate/better in the detection of patients with OSA and at least one episode of nodding off at the wheel. The DSS questionnaire has been specifically designed to evaluate sleepiness in drivers. In fact, two questions out of five (40% of the total score)
investigate the presence of sleepiness behind the wheel and their circumstances. The ESS has only one question out of eight (12.5% of the total score) investigating this specific sleepiness and without any explicit reference to the presence of falling asleep behind the wheel. Indeed, ESS question number 8 (“in a car, while stopped for a few minutes in traffic”) might be somewhat confusing for the reader as it does not specify if it addresses the driver or the passenger.
Moreover, we could explain the higher accuracy of predicting OSA by the DSS compared to the ESS by the different structure of the two questionnaires. In detail, ESS questions 1, 2, 3, 4, and 7 describe particular circumstances in which the patient has to provide qualitative judgment about his/her likelihood of falling asleep (mild, moderate, high) even if he/she does not recognize him/herself in those situations. Therefore he/she has to imagine being in that particular situation and hypothesize the likelihood of falling asleep – leading to a high probability of incorrect answers.
In the DSS, the presence of only one episode of nodding off at the wheel assigns to question number 4 a minimum score of 2 instead of 1, due to the severity of the occurrence. Furthermore, we assigned a score of 2 if it occurred at night and a score of 3 during daytime, which reflects a higher severity of the disturbances. Similarly, DSS question number 5 was assigned a score of 1 if sleepiness occurred after 1 h of driving in absence of traffic, a score of 2 if it occurred between 30 min and 60 min without traffic, and a score of 3 if it occurred before 30 min without traffic or in heavy traffic conditions. This is due to the fact that the presence of sleepiness after a short time driving and/or in heavy traffic is a more severe condition.
Nevertheless, the ESS is more effective than the DSS in detecting patients with severe OSA, showing higher accuracy (AUC = 0.910 vs 0.790, respectively). According to our results, the parallel administration of both questionnaires (positivity if DSS ≥7 or ESS ≥11) increased sensitivity and NPV compared to single questionnaires. Therefore, the combination of the results of both the DSS and the ESS may provide the clinician with a valid screening tool for all severity levels of OSA.
Our study has several limitations. First, it has a small sample size. Further studies applied to a large‑scale population are required to confirm our findings. In addition, it would be of interest to know if longitudinal reproducibility differs between the DSS and the ESS. Second, we did not validate the DSS with any objective measurement of sleepiness such as the Multiple Sleep Latency Test. Additional studies should also consider this aspect.
Third, the DSS has been designed and administered in the Italian language, and it was translated into English specifically Figure 5: Accuracy of both DSS and ESS in detecting patients with
AHI ≥30 vs AHI <30. The DSS has an accuracy of 78.80% (AUC 0.79) (95% CI = 68.70–89.30%). The ESS has an accuracy of 91.00% (0.91) (95% CI = 84.00–97.60%)
for this article. Although it is an operator‑dependent test, a largely accepted official translation for any language is necessary. Finally, an implicit limitation of the DSS, as well as the ESS and all other screening tests, is their difficult application in asymptomatic OSA. The main concern about asymptomatic patients with OSA is that they do not perceive themselves to have a disease and therefore do not seek medical advice. Therefore, the role of general practitioners (who are the first observers of the population’s health) should be stressed. When suspecting the presence of OSA, they should refer a patient to specialist on the basis of other signs such as increased BMI and neck circumference, high Mallampati score, mandibular overbite, tonsillar hypertrophy, macroglossia, and nasal septum deviation, among many others.[9] In conclusion, our study provides a new screening tool specifically for drivers with the suspicion of having OSA. If validated, the DSS could be used in combination with the ESS for more adequate detection of sleep disturbances in this group of patients, attempting to reduce the number of road accidents due to OSA‑related EDS. Financial support and sponsorship
The current study has not been financed by any institution. All the authors have nothing to disclose.
Conflicts of interest
There are no conflicts of interest.
REFERENCES
1. Strohl KP, Brown DB, Collop N, George C, Grunstein R, Han F, et al.
ATS Ad Hoc Committee on Sleep Apnea, Sleepiness, and Driving Risk
in Noncommercial Drivers. An official American Thoracic Society Clinical Practice Guideline: Sleep apnea, sleepiness, and driving risk in noncommercial drivers. An update of a 1994 Statement. Am J Respir Crit Care Med 2013;187:1259‑66.
2. Masa JF, Rubio M, Findley LJ. Habitually sleepy drivers have a high frequency of automobile crashes associated with respiratory disorders during sleep. Am J Respir Crit Care Med 2000;162:1407‑12.
3. Yamamoto H, Akashiba T, Kosaka N, Ito D, Horie T. Long‑term effects on nasal continuous positive airway pressure on daytime sleepiness, mood and traffic accidents in patients with obstructive sleep apnoea. Respir Med 2000;94:87‑90.
4. Vaa T. Impairments, Diseases, Age and their Relative Risks of Accident Involvement: Results from a Meta‑Analysis. Vol. 690. Oslo, Norway: Institute of Transport Economics; 2003. p. 1‑58.
5. Pépin JL, Viot‑Blanc V, Escourrou P, Racineux JL, Sapene M, Lévy P, et al.
Prevalence of residual excessive sleepiness in CPAP‑treated sleep apnoea patients: The French multicentre study. Eur Respir J 2009;33:1062‑7. 6. Sil A, Barr G. Assessment of predictive ability of Epworth scoring in
screening of patients with sleep apnoea. J Laryngol Otol 2012;126:372‑9. 7. Tsara V, Serasli E, Amfilochiou A, Constantinidis T, Christaki P. Greek
version of the Epworth Sleepiness Scale. Sleep Breath 2004;8:91‑5. 8. Pataka A, Daskalopoulou E, Kalamaras G, Fekete Passa K, Argyropoulou P.
Evaluation of five different questionnaires for assessing sleep apnea syndrome in a sleep clinic. Sleep Med 2014;15:776‑81.
9. Epstein LJ, Kristo D, Strollo PJ Jr, Friedman N, Malhotra A, Patil SP, et al.;
Adult Obstructive Sleep Apnea Task Force of the American Academy of Sleep Medicine. Clinical guideline for the evaluation, management and long‑term care of obstructive sleep apnea in adults. J Clin Sleep Med 2009;5:263‑76.
10. Lavie P. Insomnia and sleep‑disordered breathing. Sleep Med 2007;8(Suppl 4):S21‑5.
11. Parikh R, Mathai A, Parikh S, Chandra Sekhar G, Thomas R. Understanding and using sensitivity, specificity and predictive values. Indian J Ophthalmol 2008;56:45‑50.
12. Bougard C, Davenne D, Espie S, Moussay S, Léger D. Sleepiness, attention and risk of accidents in powered two‑wheelers. Sleep Med Rev 2015. [Epub ahead of print].
13. Cassel W, Ploch T, Becker C, Dugnus D, Peter JH, von Wichert P. Risk of traffic accidents in patients with sleep disordered breathing: Reduction with nasal CPAP. Eur Respir J 1996;9:2606‑11.
14. Terán‑Santos J, Jiménez‑Gómez A, Cordero‑Guevara J. The association between sleep apnea and the risk of traffic accidents. Cooperative Group Burgos‑Santander. N Engl J Med 1999;340:847‑51.
15. Horstmann S, Hess CW, Bassetti C, Gugger M, Mathis J. Sleepiness‑related accidents in sleep apnea patients. Sleep 2000;23:383‑9.
16. Young T, Blustein J, Finn L, Palta M. Sleep‑disordered breathing and motor vehicle accidents in a population‑based sample of employed adults. Sleep 1997;20:608‑13.
17. George CF. Reduction in motor vehicle collisions following treatment of sleep apnoea with nasal CPAP. Thorax 2001;56:508‑12.
18. Findley L, Smith C, Hooper J, Dineen M, Suratt PM. Treatment with nasal CPAP decreases automobile accidents in patients with sleep apnea. Am J Respir Crit Care Med 2000;161:857‑9.
19. Howard ME, Desai AV, Grunstein RR, Hukins C, Armstrong JG, Joffe D, et al. Sleepiness, sleep‑disordered breathing, and accident
risk factors in commercial vehicle drivers. Am J Respir Crit Care Med 2004;170:1014‑21.
20. Vignatelli L, Plazzi G, Barbato A, Ferini‑Strambi L, Manni R, Pompei F,
et al.; GINSEN (Gruppo Italiano Narcolessia Studio Epidemiologico
Nazionale. Italian version of the Epworth sleepiness scale: External validity. Neurol Sci 2003;23:295‑300.
21. Damiani MF, Quaranta VN, Falcone VA, Gadaleta F, Maiellari M, Ranieri T, et al. The Epworth Sleepiness Scale: Conventional self vs
physician administration. Chest 2013;143:1569‑75.
22. Silva GE, Vana KD, Goodwin JL, Sherrill DL, Quan SF. Identification of patients with sleep disordered breathing: Comparing the four‑variable screening tool, STOP, STOP‑Bang, and Epworth Sleepiness Scales. J Clin Sleep Med 2011;7:467‑72.