Sigla di identificazione Distrib. Pago
~
Ricerca Sistema Elettrico XCIRTEN LP3 - 008 L 1di
32 Titolo
Thermal-hydraulic pre-test analysis of ICE test section
with WA-OHR
Ente emittente CIRTEN
PAGINA DI GUARDIA
Descrittori
Tipologia del documento: Rapporto Tecnico
Collocazione contrattuale: Accordo di programma ENEA-MSE: tema di ricerca "Nuovo nucleare da fissione"
Argomenti trattati:
Sommario
This report, carried out at the DIMNP ofthe University ofPisa in collaboration with ENEA Brasimone Research Centre, illustrates the thermal fluid-dynamics results of the W A-DHR pre-test analysis. In fact, a WA-DHR heat exchanger bayonet tube will be installed into the ICE test section of CIRCE facility to study decay heat remo vaI from the core of a LFR in case of an accidental event with total 10ss of the secondary circuit and consequent reactor scram.
The thermal-hydraulic behavior ofthe WA-DHR heat exchanger inside the CIRCE facility was studied by the CFD Ansys FLUENT code, adopting an axial-symmetric domain. Pre-test calculations were performed to investigate the natural circulation heat transfer in heavy liquid metal pool and the cooling capacity of air circulating in the secondary side of the D HR.
In steady state conditions the DHR inside ICE is able to remove 40 kW heat power, which represents
5% ofthe nominai power, thanks to thermal stratification phenomena that in this condition is foreseen inside the downcomer region of the ICE test-section.
Note
Report PAR2008-2009 LP3.B2 - CERSE-UNIPI RL-1087-1I2011 PART-1 Autori: M. De Rosa, N. Forgione, D. Martelli, F. Oriolo
UNIPI Copia n. In carico a: 2 NOME FIRMA 1 NOME FIRMA
CIRTEN
Consorzio Interuniversitario per la Ricerca TEcnologica Nucleare
UNIVERSITA’ DI PISA
DIPARTIMENTO DI INGEGNERIA MECCANICA, NUCLEARE E DELLA PRODUZIONE
Thermal-hydraulic pre-test analysis
of ICE test section with WA-DHR
M. De Rosa, N. Forgione, D. Martelli, F. Oriolo
CERSE-UNIPI RL 1087-1/2011 1st part
Abstract
This report, carried out at the DIMNP of the University of Pisa in collaboration with ENEA Brasimone Research Centre, illustrates the thermal fluid-dynamics results of the WA-DHR pre-test analysis. In fact, a WA-DHR heat exchanger bayonet tube will be installed into the ICE test section of CIRCE facility to study decay heat removal from the core of a LFR in case of an accidental event with total loss of the secondary circuit and consequent reactor scram.
The thermal-hydraulic behavior of the WA-DHR heat exchanger inside the CIRCE facility was studied by the CFD Ansys FLUENT code, adopting an axial-symmetric domain. Pre-test calculations were performed to investigate the natural circulation heat transfer in heavy liquid metal pool and the cooling capacity of air circulating in the secondary side of the DHR.
In steady state conditions the DHR inside ICE is able to remove 40 kW heat power, which represents 5% of the nominal power, thanks to thermal stratification phenomena that in this condition is foreseen inside the downcomer region of the ICE test-section.
INDEX
ABSTRACT... I
INDEX...II
NOMENCLATURE... III
1. CIRCE FACILITY ... 1
2. ICE TEST SECTION ... 2
2.1 DECAY HEAT REMOVAL HEAT EXCHANGER... 3
3. CFD SIMULATIONS ... 7
3.1 COMPUTATIONAL DOMAIN AND NUMERICAL MODEL... 7
3.2 SIMPLIFYING ASSUMPTIONS AND BOUNDARY CONDITIONS... 10
3.3 LBE AND AIR PROPERTIES... 11
3.4 OBTAINED RESULTS... 14
4. CONCLUSIONS ... 26
NOMENCLATURE
Roman letters
Cp specific heat at constant pressure [J/(kg·K)]
k thermal conductivity [W/(m·K)]
Greek letters
ρ density [kg/m3]
µ viscosity [Pa·s]
Abbreviations and acronyms
CFD Computational Fluid Dynamics
DIMNP Dipartimento di Ingegneria Meccanica Nucleare e della Produzione
THINS Thermal Hydraulic of Innovative Nuclear System
CIRCE CIRCulation Experiment
LBE Lead-Bismuth Eutectic
ICE Integral Circulation Experiment
DHR Decay heat remove
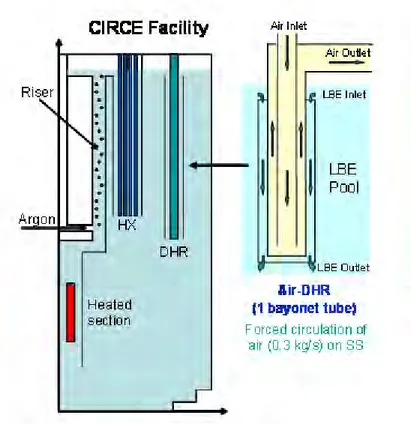
1. CIRCE Facility
In the frame of the THINS EU Project a large scale integral test named “CIRCE experiment” has been foreseen to analyse mixed convection heat transfer and stratification phenomena in a heavy liquid metal pool during the transition from forced (nominal) flow conditions to natural circulation. This experiment has to be performed on the CIRCE facility, by an appropriate upgrade of the ICE test section.
The CIRCulation Experiment (CIRCE) facility basically consists of a main cylindrical vessel (S100) filled with about 70 tons of molten Lead-Bismuth Eutectic (LBE) as coolant fluid and with argon as cover gas. The facility is equipped with a LBE storage tank (S200), a small LBE transfer tank (S300) and the data acquisition system (see Figure 1) [1].
As already mentioned, the experiment will be performed on the test section referred to as the “Integral Circulation Experiment” (ICE), properly adapted.
2. ICE test section
The ICE test section is to be placed in the CIRCE main vessel (S100) and consists of the following main components: downcomer, feeding conduit, LBE flow meter, fuel pin simulator (FPS), fitting volume, riser, separator, heat exchanger, dead volume and insulation volume (see Figure 2). Heat Exchanger Cover Head Riser Dead Volume Fitting Volume Flow Meter Feeding Conduit Insulation Volume CIRCE main vessel
(S100) Coupling Flange FPS Heat Exchanger Cover Head Riser Dead Volume Fitting Volume Flow Meter Feeding Conduit Insulation Volume CIRCE main vessel
(S100)
Coupling Flange
FPS
Figure 2. ICE Test Section
In order to accomplish the assumed commitments with the WA-DHR experiment, several modifications have to be implemented on the ICE test section, relating to:
• heat transfer reduction between inner and outer side of the riser;
• increase the height of the wall of the separator, to guarantee that the LBE flow rate really flows into the HX’s shell during the test;
• install the WA-DHR heat exchanger into the pool; • improve the instrumentation.
The WA-DHR (see Figure 3) uses air as secondary fluid, and it has been designed to remove a thermal power of about 40 kW, which represents 5% of the ICE nominal power (800 kW).
generated in the HS, stopping the argon injection into the riser, cutting off the main HX and starting the DHR heat exchanger, allowing evaluation of the manifestation of secondary flow paths, involving DHR and downcomer, uncoupled from the primary flow path.
As foreseen by the CIRCE experimental commitment, the DHR will be placed into the pool of the main vessel, hydro-dynamically uncoupled with the flow path through the riser, as shown in Figure 3.
Figure 3. Position of DHR inside S100
2.1 Decay heat removal heat exchanger
The DHR heat exchanger is placed in the upper part of the pool reactor and works in natural circulation on the primary side; it is activated following an accidental event with total loss of secondary circuit and consequent reactor scram.
Figure 4. Position of DHR heat exchanger in the CIRCE facility
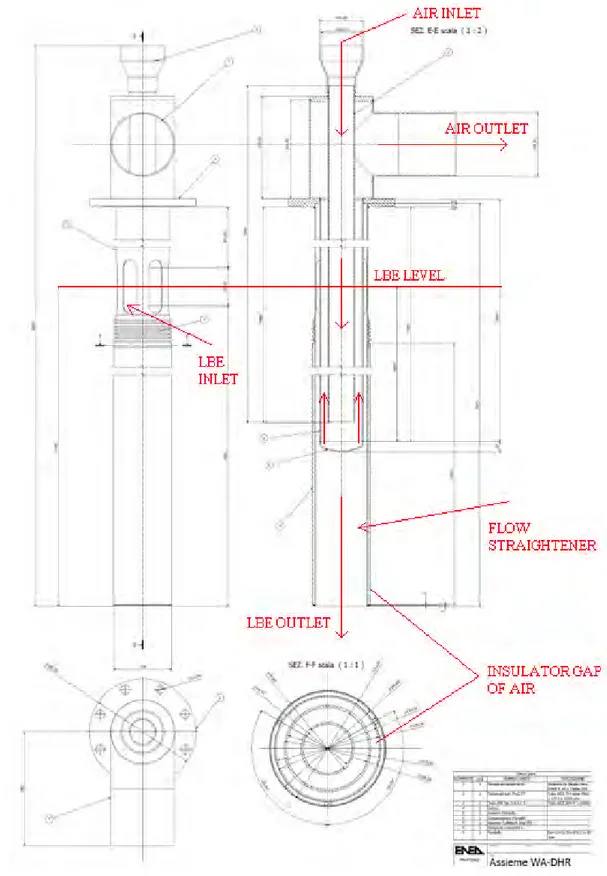
The DHR, as showed in Figure 5, is essentially a heat exchanger made of three concentric tubes, of which the intermediate has a bottom end sealed, while the internal and external tubes are opened at the bottom.
In the inner tube the cold air is injected from the top, flows downward and then upward in the annulus between the same tube and the intermediate one. In the annulus the air flowing upward increases its energy removing heat from the LBE that flows in the opposite direction into the adjacent channel.
In order to reduce the heat transfer between the LBE flowing downward in the DHR annular pipe and external LBE pool, a thermal insulation of air is foreseen on the DHR outer shell (see
Figure 5). In particular, thermal insulation is realized by a double wall with a gap of 4.6 mm filled by air at room pressure and temperature (before the sealing) and this device allows a drastic reduction of the thermal coupling with the downcomer.
The end side of DHR outer shell operates as a flow straightener, allowing the LBE flow to homogenise; the LBE enters into the shell from the top through appropriate holes and flows downward allowing a counter current heat exchanger with the air flowing into the annulus, as mentioned before.
Primary process fluid Pb-Bi alloy (LBE)
Nominal LBE flow rate 8 kg/s
LBE inlet temperature 340°C
LBE outlet temperature 306°C
Refrigerating fluid Air
Air Inlet temperature 20°C
Air Outlet temperature 152°C
Air flow rate 0.3 kg/s
Design temperature 500°C
Shell length 4435 mm
Active length 4028 mm
Straightener length 407 mm
Bayonet external tube (ID x thick.) 114,3 X 3mm
Bayonet inner tube (ID x thick.) 70 X 2.77 mm
Shell inner diameter 139.7 mm
Shell insulation gap thickness 11.3 mm
Air velocity annulus 77 m/s
Thermal duty 40 kW
3. CFD simulations
3.1 Computational domain and numerical model
The fluid-dynamic analysis was carried out using the CFD FLUENT code [2].
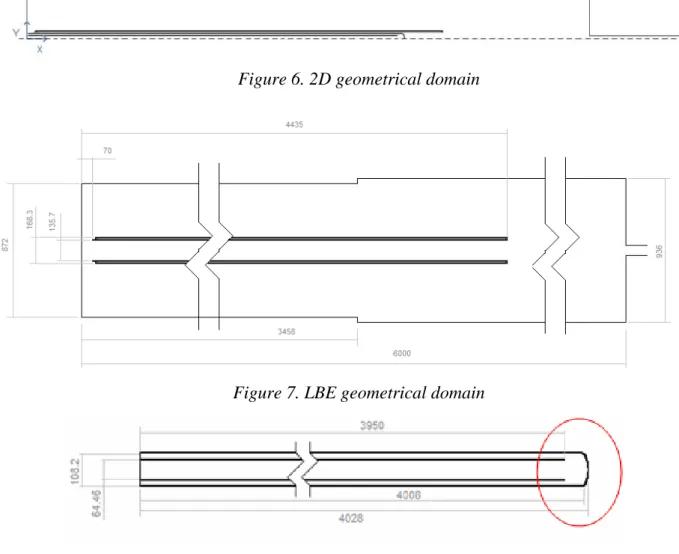
In order to reduce computational efforts, the calculation domain has been modeled as a 2D axial-symmetric geometry in which the axis is coincident with that of the DHR (see Figure 6).
The origin of the reference frame was set at the air inlet section with the x-axis as symmetry axis and the y-axis normal to it.
The 2D domain is reported in Figure 6, while in Figure 7 is represented only the LBE geometrical domain with its main dimensions.
Figure 8 represents, instead, the air domain with its main sizes.
Figure 6. 2D geometrical domain
Figure 7. LBE geometrical domain
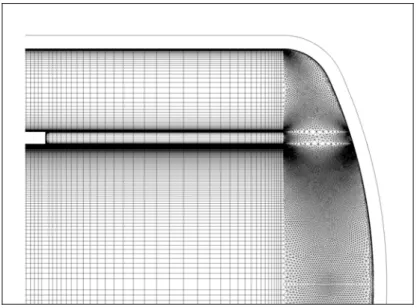
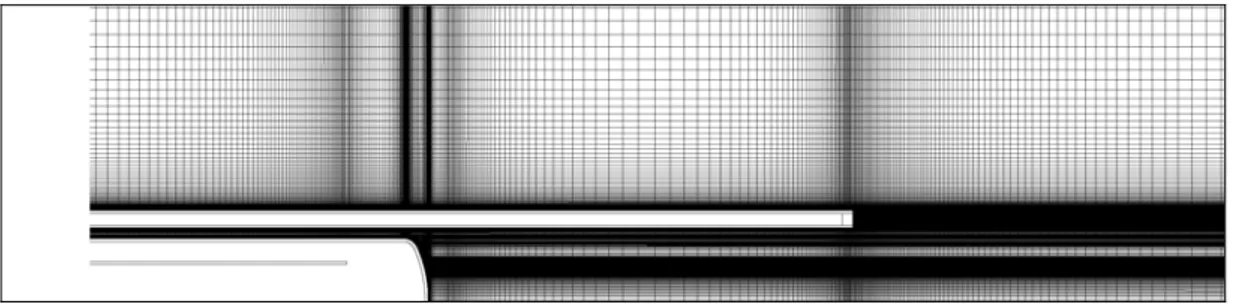
The 2D domain was meshed using structured mesh, with exception for the rounded bottom of the air pipe (see Figure 9). The mesh consists of about 1,116,000 cells, with a special refinement
near to the wall boundaries of the domain, according to the requirement y+≈1 for enhanced wall
treatment model used in the code. The mesh refinement regions are reported from Figure 10 to Figure 13.
Figure 9. Bottom side of air domain
Figure 11. Air inlet and outlet (region A)
Figure 12. LBE inlet section (region B)
Figure 13. LBE outlet section (region C)
The external walls were assumed adiabatic and gravity acceleration, equal to 9.81 m/s2, along
x-axis was also considered.
to the standard k-ε model because it provides an analytical formula for turbulent Prandtl number. All numerical computations were performed in double precision and the “first order upwind” scheme was adopted for momentum, turbulent kinetic energy and turbulent dissipation rate.
3.2 Simplifying assumptions and boundary conditions
To reproduce the problem, the following simplifying assumptions were considered:
• computational domain was simulated as an axial-symmetric two-dimensional geometry; • only the DHR was reproduced, neglecting the presence of the other elements of ICE test
section;
• the DHR was included in a cylindrical thank with a inner diameter equal to the equivalent diameter of the free section in the upper side of ICE;
• LBE inlet mass flux was assumed equal to the mass flux at the outlet of the main HX; • the LBE inlet vertical position was assumed equal to the height of the main HX outlet
section.
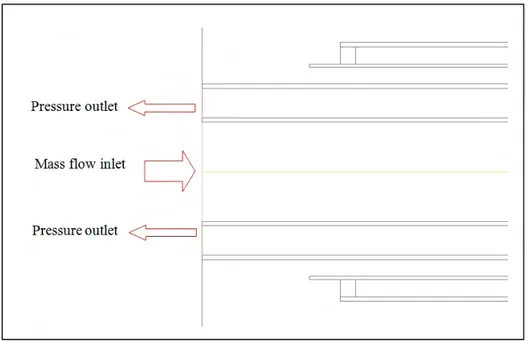
The air boundary conditions are (see also Figure 14): • inlet mass flow rate m& = 0.3 kg/s;
• inlet turbulence intensity of 7% and hydraulic diameter equal to the inlet tube diameter; • inlet temperature = 293.15 K;
• pressure outlet at the outlet section.
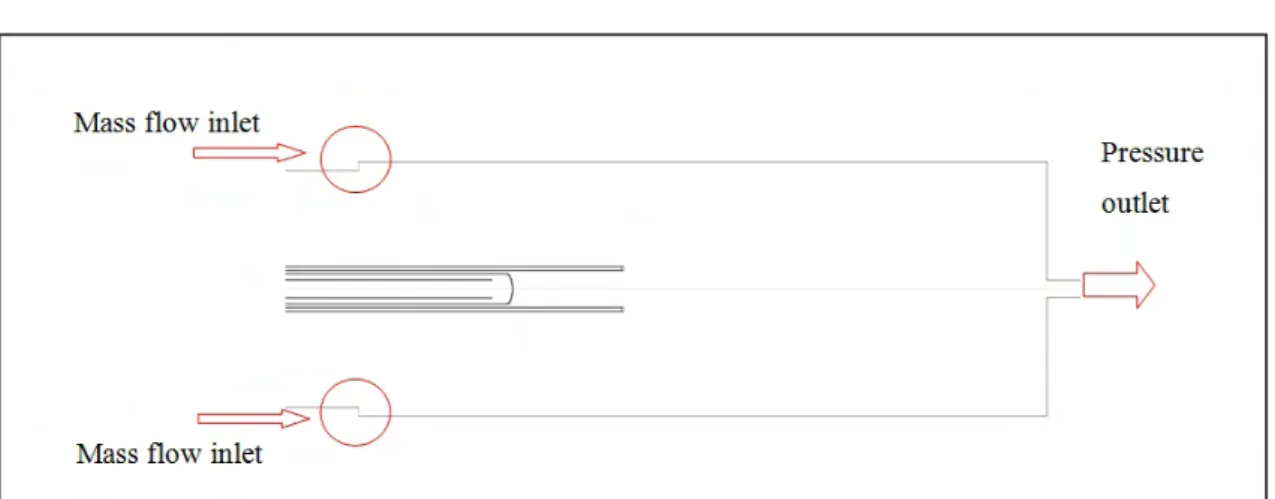
The LBE boundary conditions are (see also Figure 15): • inlet mass flow rate m& = 8 kg/s;
• inlet turbulence intensity of 7% and a proper hydraulic diameter; • inlet temperature = 613.15 K;
• pressure outlet at the outlet section.
Figure 15. LBE boundary conditions
3.3 LBE and air properties
The thermo-dynamic and thermo-physical properties of the LBE alloy, such as density, molecular viscosity, thermal conductivity and specific heat, were assumed as a function of the temperature (in Kelvin) in agreement with Ref. [3]:
• density (see Figure 16)
ρ [kg/m3
] = 11096 - 1.3236 T • specific heat at constant pressure (see Figure 17)
Cp [J/(kg·K)] = 159 – 0.0272 T + 7.12e-06 T2
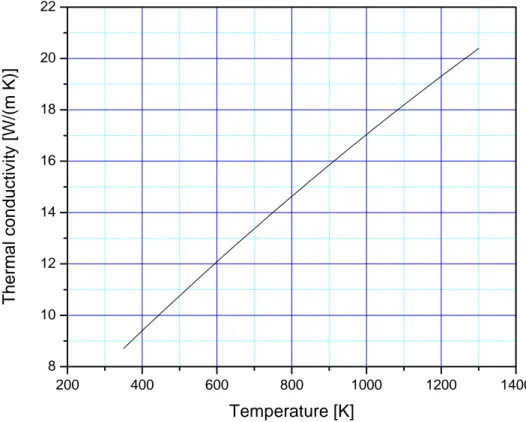
• thermal conductivity (see Figure 18)
k [W/(m·K)] = 3.61 + 0.01517T – 1.741e-06T2
• viscosity (see Figure 19)
µ [Pa·s] = 4.94 10 4 exp 754.1
T
− ⎛ ⎞
⋅ ⋅ ⎜ ⎟
200 400 600 800 1000 1200 1400 9200 9400 9600 9800 10000 10200 10400 10600 10800 Dens ity [ kg/ m 3 ] Temperature[K] Figure 16. LBE Density
200 400 600 800 1000 1200 1400 134 136 138 140 142 144 146 148 150 152 154 Spe cif ic heat [ J /( k g K )] Temperature [K] Figure 17. LBE Specific heat
200 400 600 800 1000 1200 1400 8 10 12 14 16 18 20 22 T h er m a l c o nd uc ti v it y [ W /( m K )] Temperature [K]
Figure 18. LBE Thermal conductivity
200 400 600 800 1000 1200 1400 0.000 0.001 0.002 0.003 0.004 0.005 0.006 0.007 Vi sco si ty [ P a s] Temperature [K]
Figure 19. LBE Viscosity
Density [kg/m3] 0.96978
Specific heat [J/(kg·K)] 1006.62
Thermal conductivity [W/(m·K)] 0.0279
Viscosity [Pa·s] 2.7532E-05
Table 2. Air properties
3.4 Obtained results
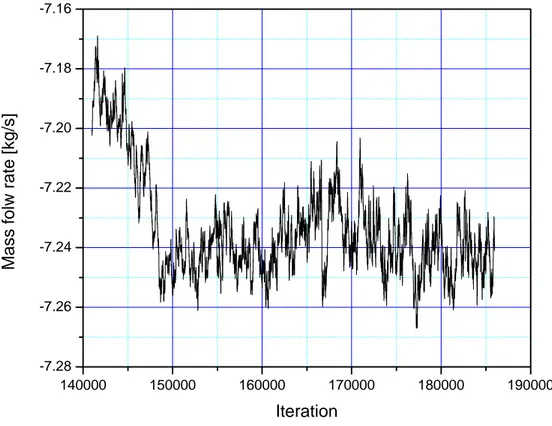
In the performed analysis, reaching steady state conditions was evaluated by monitoring the LBE downward mass flow in DHR annular region (see Figure 20). In particular, at the end of the simulation the LBE mass flow rate reaches a value oscillating between 7.22 kg/s and 7.26 kg/s. 140000 150000 160000 170000 180000 190000 -7.28 -7.26 -7.24 -7.22 -7.20 -7.18 -7.16 Mass f olw rate [kg/s] Iteration
Figure 20. Mass flow rate vs. iterations
Figure 21 displays the temperature distribution for the entire domain: the temperature of the two fluid are quite different, the maximum value reached by the liquid metal is 613 K, while the maximum temperature reached by air is about 440 K.
Figure 21. Temperature contour plot [K] for the entire domain
Figure 22 shows only LBE temperature distribution: the maximum temperature observed is 613 K and the minimum is about 574 K at the LBE outlet section.
Thermal stratification phenomena is present in the entire pool, as shown in Figure 22; the upper and lower parts of the pool stabilize at two different temperature levels with a transition zone shown in the region between the elevations of the inlet section of LBE and the bottom of the air gap.
A control reference line placed at y = 0.3 m is used to check the trend of LBE temperature inside the pool region along the x-axis direction (see Figure 23).
0 1 2 3 4 5 6 570 580 590 600 610 620 T e mp erat ure [ K ] x coordinates [m]
Figure 23. Temperature trend along the control line at y=0.3 m, inside the LBE pool region
The temperature assumes constant value of about 613 K from the top of the DHR up to the lead-bismuth eutectic entry zone; it gradually decreases up to the value of about 574 K to the end of air insulator gap and remains roughly constant until the bottom.
An additional control line, placed in the middle section of the annular LBE region of the DHR (at y = 0.0625 m), was used to monitor the temperature trend inside the cooling channel (see Figure 24). 0 1 2 3 4 570 580 590 600 610 620 T e m pe rat ur e [ K ] x coordinate [m]
The maximum change in temperature for the lead-bismuth eutectic alloy flowing through the cooling channel is about 40 K. The value of temperature linearly decreases from about 613 K at the entrance of channel to 573 K at the exit.
In analogy with temperature, the contour plot of LBE density is reported in Figure 25: a thermal density stratification due to temperature difference of LBE is shown.
Figure 25. LBE density contour plot [kg/m3]
Figure 26 shows the temperature field for the air, while Figure 27 and Figure 28 display an enlargement of zones A and B, respectively.
Figure 27. Air temperature contour plot [K] at inlet and outlet sections (region A)
The air mass flow rate at the entrance of the DHR is imposed in order to properly reproduce the forced circulation in the secondary circuit. The air temperature gradually increases from 293.15 K at the inlet section to a value of about 435.7 K at the outlet section.
The air temperature field in the external tube along the vertical direction, shows a change of about 110 degrees because of the heat transfer between air and cold air (Zone 1 Figure 27) and between air and hot lead-bismuth eutectic (Zone 2 Figure 27) .
The thickness of the thermal layer grows from the DHR bottom to the beginning of the pipe according to the counter-current flow of the LBE (see Figure 28).
A control line at x = 1 m is used to monitor the air temperature (see Figure 29 and Figure 30).
Figure 29. Position of control line in the pipes of air at x = 1 m
0.00 0.01 0.02 0.03 0.04 0.05 0.06 250 300 350 400 450 500 550 600 Temperat ure [ K ] x coordinate [m]
Figure 30. Air temperature trend on control line at x = 1 m
Along this line, near the axis the temperature is almost constant (about 300 K), growing near the metal wall of the tube inside which it remains constant; in the external annular pipe the temperature increases until it reaches a value of about 600 K.
Two others control lines (Figure 31) are used to monitor the temperature trend along the x Inner pipe
Metal wall
Eternal annular pipe
annular pipe (at y = 0.04455 m).
The air temperature increases along the air flow path, especially in the external annular pipe, because of heat exchange with LBE.
Figure 31. Vertical control line in the pipes of air (at y = 0 m and y = 0.04455 m)
0.0 0.5 1.0 1.5 2.0 2.5 3.0 3.5 4.0 250 300 350 400 450 T e mper at ur e [K ] xcoordinate [m] Axis of simmetry (y = 0 m) Center line (y = 0.04455 m)
Figure 32. Air temperature trend along vertical control lines (y = 0 m, y = 0.04455 m)
The heat removed by the air is about 43 kW and agrees well with the expected thermal DHR duty of 40 kW.
velocity along the axis of the inner tube is about 120 m/s, while in outer pipe the velocity reaches a maximum value of about 50 m/s.
At the end of the pipe air velocity decelerates and turns around the wall of the inner tube and enters in the outer pipe giving rise to a vortex (see Figure 34).
Figure 33. Air velocity vectors [m/s] at the middle elevation region of the air pipe
The LBE moves upwards to the entrance region of the cooling channel and downward from the exit of cooling channel to the bottom of the domain; at the middle height of the DHR external pool, where the thermal stratification is stronger, LBE movement is confined to a limited area due to the formation of two vortices. The LBE velocities are very low in this region due to thermal stratification: it is in the order of 0.1 m/s.
Figure 35. LBE velocity vectors [m/s]
Figure 36 displays the LBE velocity vectors at the entrance region of the cooling channel, while Figure 37 reports the velocity vector distribution in the cooling channel far away from the entrance. Maximum LBE velocity, of about 0.3 m/s, is reached just inside the annular channel.
Figure 37. LBE velocity vectors [m/s] at the center of the cooling channel (region B)
The LBE exits from the cooling channel with an average velocity of about 0.2 m/s and with a mean temperature of about 570 K (see Figure 38); two zones at higher speeds as an extension of the channel are formed, while near the axis of the domain a vortex characterized by a very low speed, is created.
Figure 38. LBE velocity vectors [m/s] at the end of cooling channel (region C )
Figure 39 shows a zoom of the region near the exit of the DHR channel where the LBE leaving the cooling channel accelerates getting into the external pool. In this region the velocity reached the value of 0.35 m/s.
Figure 39. Velocity contour plot
In Figure 40 is reported the velocity magnitude trend along the control line at y = 0.3 m in LBE region shown in Figure 22. In the LBE region characterized by a constant temperature of about 613 K and in the region of thermal stratification, the LBE velocity doesn’t exceed the value of 0.075 m/s and assumes an average value of about 0.002 m/s. In the LBE region, characterized by a constant temperature of about 570 K, LBE velocity increases due to presence of the exit from DHR and the vortex in that region showed in Figure 41.
0 1 2 3 4 5 0.000 0.005 0.010 0.015 0.020 Veloc ity magnit ude [m/ s] x coordinates [m]
Figure 41 shows the streamlines inside the calculation domain. In the central area of the LBE domain, where stratification conditions take place, a recirculation area of LBE characterized by small vortices is formed.
4. Conclusions
The aim of this work is to give useful information about the phenomena of natural circulation and thermal stratification foreseen in the ICE test section equipped with WA-DHR in a heavy liquid metal pool configuration.
The analysis was performed using the Ansys Fluent CFD code. In particular, an axial-symmetric domain was employed to reproduce the test section, adopting the RNG (Renormalized group) k-ε model to take into account turbulence phenomena inside both air and LBE fluids.
Obtained results show a stratified temperature field in the external pool region between the LBE inlet section and the outlet cooling channel elevations, separating the upper region characterized by a constant value of temperature of about 613 K from a lower region in which the LBE reached a constant value of about 574 K.
The lead-bismuth eutectic moves upwards and enters the cooling channel where it exchanges heat with air decreasing its temperature and increasing density; it is driven downwards by gravity at the end of the channel.
The amount of the heat removed from the core of about 43 kW well agree with the expected DHR thermal duty of 40 kW and the calculated temperatures of the working fluids (both air and LBE), at the exit of the calculation domain, agree with the expected temperatures. Also LBE mass flow in the annulus between outer pipe and the thermal insulator gap was monitored; in steady state condition its value is about 7 kg/s, about the 90% of the total LBE mass flow rate imposed at the inlet section.
References
[1] G. Bandini, I. Di Piazza, P. Gaggini, A. Del Nevo, M. Tarantino, “CIRCE experimental set-up design and test matrix definition”, ENEA UTIS-TIC Technical Report, IT-F-S-001, 28/02/2011.
[2] Fluent 6.3.26 User’s Guide Documentation, Lebanon, USA, 2006.
[3] AA. VV., “Handbook on Lead-bismuth Eutectic Alloy and Lead Properties, Material Compatibility, Thermal-hydraulics and Technologies”, OECD/NEA, 2007.
![Figure 21. Temperature contour plot [K] for the entire domain](https://thumb-eu.123doks.com/thumbv2/123dokorg/5611134.68161/20.892.109.804.104.450/figure-temperature-contour-plot-k-entire-domain.webp)
