ALMA MATER STUDIORUM - UNIVERSITÀ DI BOLOGNA
SCUOLA DI INGEGNERIA E ARCHITETTURA
DIPARTIMENTO DI INGEGNERIA CIVILE, CHIMICA, AMBIENTALE E DEI MATERIALI - DICAM
CORSO DI LAUREA IN INGEGNERIA CHIMICA E DI PROCESSO – CURRICULUM “SUSTAINABLE TECHNOLOGIES AND BIOTECHNOLOGIES FOR ENERGY AND MATERIALS”
TESI DI LAUREA in
Fluid Mechanics and Transport Phenomena
APPLICATION OF AN AMMONIA-BASED PROCESS
WITH CONTROLLED SOLID FORMATION FOR
POST-COMBUSTION CO
2CAPTURE
CANDIDATO RELATORE
Davide Bernardo Preso Chiar.ma Prof.ssa Maria Grazia De Angelis CORRELATORI Chiar.mo Prof. Marco Mazzotti Federico Milella José Francisco Pérez Calvo
Dott. Daniel Sutter
Anno Accademico 2017/2018 Sessione III
Abstract
CO2capture and storage is needed to reduce the carbon footprint related to industrial
activ-ities. Among the different available technologies, CO2removal from power/cement plant’s
flue gases is of particular interest due to its versatility and retrofit opportunities for existing plants. In this framework, the Chilled Ammonia Process (CAP) is a promising technology for post-combustion CO2capture. Besides its competitive energetic performance compared
to conventional amines, the use of aqueous NH3as a solvent offers advantages concerning
global availability, environmental footprint and cost compared to most amine processes. A new ammonia-based process for CO2capture from flue gas has been developed, which
found its origin in the Controlled Solid Formation - Chilled Ammonia Process (CSF-CAP), developed by Sutter et al. [1]. A controlled solid precipitation carried in a dedicated unit of the plant lead to a reduction of the energy penalty of the process without hindering its oper-ability, since the mass flow rate sent to regeneration can be substantially reduced by means of CO2concentration in the solid phase rather than the liquid phase. Differently from the
original CSF-CAP, where ammonium bicarbonate has been exploited in the crystallization section, in this new process ammonium carbonate monohydrate is formed, which promises numerous advantages in terms of the overall energy efficiency of the process.
Initially, the process synthesis has been performed, followed by a rigorous optimization and performance evaluation. The work have been carried out coupling Aspen Plus V8.6 and Matlab. The speciation model developed by Thomsen et al. [2] has been used for the calculations in the CO2-NH3-H2O system.
Under the assumptions considered in this work and discussed in Sec. 6, the new CSF-CAP has been found to require 0.84 MJ/kgCO2 of electrical energy, which corresponds to a
reduction of 5% of the overall energy duty of the plant, compared to the original CSF-CAP, which needs 0.89 MJ/kgCO2 [1].
Acronyms
CCS Carbon Capture and Storage PCC Post Combustion Capture MEA Monoethanolamine DEA Diethanolamine
MDEA Methyldiethyl-ethanolamine SI Supersaturation Index CAP Chilled Ammonia Process DCC Direct Contact Cooler L-CAP Liquid-CAP
CSF-CAP Controlled Solid Formation-CAP BC-CSF-CAP Ammonium Bicarbonate-CSF-CAP
Contents
Abstract I
Acronyms II
1 Introduction 1
1.1 Global emissions and future scenarios . . . 1
1.2 Carbon capture and storage and post-combustion CO2capture . . . 2
1.2.1 PCC by chemical absorption . . . 3
1.2.2 Alkanolamine-based processes . . . 3
1.2.3 Ammonia-based processes . . . 4
1.3 Comparison between ammonia and amine processes . . . 5
1.4 Applications to cement plants . . . 6
1.4.1 Introduction to cement plants . . . 6
1.4.2 Overview of cement manufacturing . . . 6
2 Thermodynamic model and process simulation 8 2.1 The CO2-NH3-H2O system . . . 8
2.2 Equilibria calculations . . . 9
2.2.1 Speciation equilibria . . . 9
2.2.2 Vapor-liquid equilibria . . . 10
2.2.3 Solid-liquid equilibria . . . 11
2.3 Thomsen model development . . . 12
2.4 Ternary phase diagrams . . . 13
2.5 Aspen Plus® implementation . . . 15
3 Process description 16 3.1 MEA-based processes . . . 16
3.2 Chilled Ammonia Process . . . 17
3.2.1 Liquid - Chilled Ammonia Process . . . 17
3.2.2 Controlled Solid Formation - Chilled Ammonia Process . . . 19
3.2.3 CAP and cement plants . . . 19
3.3 Aims of the Thesis . . . 20
4 Theoretical potential of ammonium carbonate monohydrate 21 4.1 CO2capture yield . . . 21
5 Process analysis, optimization, and performance evaluation 26
5.1 Range of feasible operating conditions . . . 27
5.1.1 Absorption section . . . 28
5.1.2 Dissolution and regeneration section . . . 35
5.1.3 CO2wash section . . . 37
5.1.4 Flue gas water wash section . . . 39
5.2 Process optimization . . . 39
5.2.1 Multi-variable sensitivity analysis on the solvent regeneration section 40 5.2.2 Optimization . . . 42
5.3 Optimization of the flue-gas water wash section . . . 47
5.4 CO2compression duty evaluation . . . 49
6 Integration and performance evaluation 51 6.1 Integration . . . 51
6.2 Conversion and overall duty evaluation . . . 51
6.3 Comparison and conclusions . . . 53
Appendices 55 A Matlab code for the multi-variable sensitivity analysis on the regeneration section 55 B Matlab code for the main optimization . . . 60
C Flowsheet from Aspen Plus used in the main optimization . . . 72
D Flowsheet from Aspen Plus used in the FG-WW section optimization . . . 73
E Flowsheet from Aspen Plus of the CO2compression section . . . 74
References 77
List of figures 78
1 Introduction
1.1 Global emissions and future scenarios
The report of the Inter Governmental Panel on Climate Change [3] states that anthropogenic activities are the main responsible for the greenhouse gases (GHGs) emitted into the at-mosphere. These gases are carbon dioxide (CO2), methane (CH4), chlorofluorocarbons
(CFCs) and nitrous oxide (N2O). Among them, carbon dioxide (CO2) is the largest fraction
of emitted GHGs. Consequently, CO2has been assumed to be the greatest responsible for
the GHGs effect, accounting for approximately 55% of the global warming [4].
The combustion of fossil fuels, which is employed for approximately 85% of the world’s energy supply, is the main source of CO2emissions [5], contributing to 70% of the overall
CO2emissions due to power production [4].
In this contex, during the 21stconference of the Parties of the United Nations Framework
Convention on Climate Change in 2015, the Paris agreement was stipulated to agree on com-mon objectives concerning the climate change. In particular, the Parties agreed on “holding
the increase in the global average temperature to well below 2◦C above pre-industrial levels
and pursuing efforts to limit the temperature increase to 1.5◦C […]” [6].
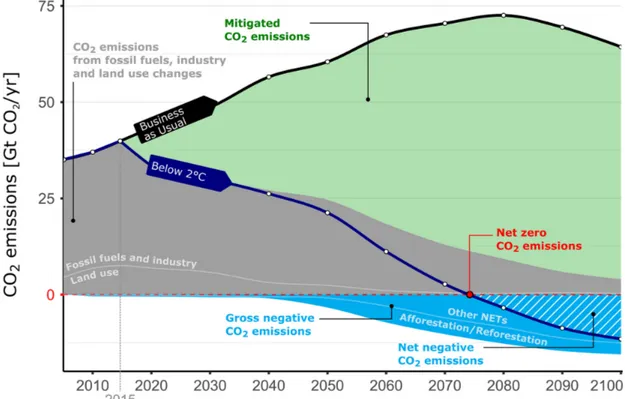
As a consequence of the increasing demand of consumer goods in the last years and the relative increase of industrial plants capacities, the actual scenario sees a continuously increasing trend of the GHGs emissions. Figure 1 shows the trend of CO2emissions in the
last years.
Figure 1: Energy-related CO2 emissions by fuel (1973-2030). Based on IEA data from IEA, 2004a © OECD/IEA 2004, www.iea.org/statistics, Licence: www.iea.org/tc [7]
With the aim of reducing the CO2 emissions and achieving the objectives of the Paris
agreement, two emission pathway scenarios have been identified, concerning the drop of the CO2emissions near to zero in a short time or that negative emissions are realized in the
second half of the century [3] [8].
The trend of net CO2emissions is shown in Figure 2, concerning the 2◦C scenario.
Figure 2: “The role of negative emissions in climate change mitigation” adapted from Fuss et al. [8] is licensed under CC BY 3.0
For this purpose, different approaches have been considered. Among them, the Carbon Capture and Storage (CCS) has earned much credit, becoming a fundamental tool for the achievement of both the scenarios [1].
1.2 Carbon capture and storage and post-combustion CO
2capture
CCS is mainly divided into 4 categories: post-combustion capture (PCC), pre-combustion capture, oxyfuel conbustion and electrochemical separation. [9].
This thesis focuses on the PCC, which separates the CO2from the flue gas after the
com-bustion, by keeping unaltered the existing power plant. Although PCC is one of the most challenging approaches due to presence of dilute CO2in the treated gas and the low pressure
of the flue gas, it can be considered the easiest technology to be integrated in existing power plants [10] [11].
1.2.1 PCC by chemical absorption
Several techniques are available for PCC, which exploit physical absorption, absorption with chemical solvents (reagents), cryogenic separation and biological fixation [4]. Nowa-days, the most employed PCC technique is the chemical absorption.
An ideal solvent for this purpose should meet the following features [4] [12]: - high CO2absorption capacity;
- rapid and reversible reaction with CO2, with minimal heat requirement;
- good oxidative and thermal stability; - low vapor pressure;
- low toxicity; - low flammability; - availability at low cost; - less corrosivity.
Usually, alkanolamine-based and ammonia-based solutions are used in this framework.
1.2.2 Alkanolamine-based processes
Aqueous alkanolamines solutions are the most diffused solvents in CO2capture processes
[12]. Among them, monoethanolamine (MEA), diethanolamine (DEA) and methyldiethyl-ethanolamine (MDEA) can be mentioned.
The wide use of amine-based solutions for CO2absorption makes this process one of
the most well-understood. In fact, amine-based processes have been know for more than 80 years [13] [4].
Besides the positive aspects, they have some disadvantages [4] [12] [11]: - low CO2loading capacity (molCO2,absorbed/molabsorbent);
- active at low CO2partial pressure, because CO2chemically reacts with amines
(tipi-cally 13-14% from coal-fired power plants) [12];
- oxidative degradation due to the presence of SO2, NOx, HCl, HF and O2 in the flue
gas;
- high equipment corrosion;
The general reaction scheme of absorption of CO2by amines was proposed by Kohl and
Nielsen [14]:
H2O −−−⇀↽−−− H++ OH− (ionization of water) (1)
CO2 + H2O −−−⇀↽−−− HCO3−+ H+ (hydrolysis,ionization of CO2) (2)
RNH2+ H+ −−−⇀↽−−− RNH3+ (protonation of alkanolamine) (3)
RNH2+ CO2 −−−⇀↽−−− RNHCOO−+ H+ (carbamate formation) (4)
The scheme applies to primary (i.e. MEA), secondary and tertiary amines, although the latter cannot react directly with CO2to form carbamates (reaction 4). Scheme 5 [12] resumes
the absorption reaction of CO2by primary and secondary amine to form carbamate, where
reaction 4 is predominant: 2 ❅❅NH+ R1 " " R2 + CO2 −−−⇀↽−−− NH+ 2 ❅ ❅ R1 " " R2 + N"" C O ❅ ❅ O− ❅ ❅ R1 " " R2 (5)
Carbamate is a stable compound, which does not easily undergo hydrolysis to bicarbonate. Tertiary amines absorb CO2by forming bicarbonate, as shown in scheme 6:
N R3 ❅ ❅ R1 " " R2 + CO2 + H2O −−−⇀↽−−− NH+ R3 ❅ ❅ R1 " " R2 + HCO3− (6)
The differences between the two reaction schemes are: - in general, scheme 5 is faster than scheme 6;
- in scheme 5, the loading capacity of the solution is 0.5 mol of CO2per mol of amine,
whereas in scheme 6 only one mole of amines is consumed per mole of CO2absorbed.
1.2.3 Ammonia-based processes
From a chemical point of view, NH3and amines (which are in turn produced from NH3) are
very similar [jason e.]. Aqueous ammonia can therefore be directly employed as a solvent in CO2capture processes.
With regard to safety, NH3is a hazardous substance, which is very harmful if inhaled.
In comparison with amine-based solvents, aqueous ammonia has better features [4] [15] [1]:
- high CO2loading capacity;
- high rate of CO2absorption;
- non corrosive solution;
- stable in presence of O2and other flue gas impurities;
- generally lower liquid to gas flow ratio in the absorption process;
- multi-pollutant capture capability (in particular SO2 and NOx), so that further
pre-treatment of the flue-gas is not required; - less energy demand for solvent regeneration;
- low cost product, cheaper than MEA and other amines; - higher worldwide availability;
- regeneration at elevated pressures.
Details on the thermodynamics of the NH3-CO2-H2O system are given in section 2.
Furthermore, the employment of aqueous ammonia for the absorption of CO2could lead to
the formation of different salts, i.e. ammonium bicarbonate, ammonium carbonate mono-hydrate, ammonium sesqui-carbonate and ammonium carbammate [16].
1.3 Comparison between ammonia and amine processes
Several comparative works that analyze both NH3-based and MEA-based CO2capture
pro-cesses have been published.
As a result of the analyses, the costs associated with amine-based CO2capture have led
the research toward the development of processes which exploit different solvents. Mini-mum energy requirement and lower equipment size have been the challenges to overcome the amine-based process limitations [4]. In this framework, aqueous ammonia is playing an important role.
In general, studies show that CO2capture with aqueous NH3solution is better in terms
of performance (CO2removal efficiency and absorption capacity) [4]. Bandyopadhyay [4]
presented a comparative study on the energy penalty of NH3-based and MEA-based CO2
-capture processes. As reported, MEA-based processes require 4215 kJ/kgCO2,captured,
employ-ing 30% wt. MEA solutions, whereas the NH3-based process energy duty is only about
27% of the latter, with 1147 kJ/kgCO2,captured.
wt. MEA solution ranges from 3200 to 5500 kJ/kgCO2,captured, which is in any case higher than
the ones of NH3-based processes.
The regenerative desorption for the regeneration of the solvent is endothermic and it is the main energy consumption associated to the process, which is much higher in MEA-based processes than in NH3-based processes. The energy requirements of the desorption
strongly depends on the composition of the solvent loaded with CO2.
In conclusion, combining such processes with power plants implies a net power output reduction of around 30% [17], as well as a reduction of the overall efficiency of the plant. This is due to the energy required to operate the CO2capture in the plant.
1.4 Applications to cement plants
1.4.1 Introduction to cement plants
Coal-fired power plants are certainly the largest producers of CO2, but technologies for
CO2emissions reduction are not focused only on these plants.
Lately, the application of CCS to power plant has lost attention, because of the still increasing employment of renewable energies. Furthermore, the integration of CO2capture
processes have been studied with other manufacturing processes. In this regard, cement plants have gained the attention of the researchers.
The cement sector is among the biggest manufacturing industrial sectors. Cement is involved in the production of concrete, the most consumed product in the world. Conse-quently, cement industry accounts for 7% of the global industrial energy consumption [18]. It is also responsible for 5% of the global CO2emissions [19] and it is the second largest
sector for total direct industrial CO2emissions, with 2.2 GtCO2/year in 2014 [18].
The Technology Roadmap of the International Energy Agency [18] sets a strategy for CO2emissions reduction in the 2◦C scenario framework, although the concrete production
is expected to increase by 12-23% by 2050. The strategy is based on four main actions: - improving energy efficiency;
- using less carbon intensive fuels; - reducing the clinker to cement ratio; - implementing technologies such as CCS.
1.4.2 Overview of cement manufacturing
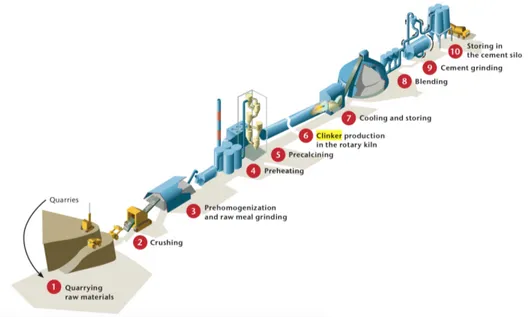
Cement is produced in a three-stage process: initial preparation of raw material, production of clinker and grinding of clinker with other components to get cement. A simple scheme is showed in Figure 3.
Figure 3: Cement manufacture at a glance. © OECD/IEA 2009, Cement Technology Roadmap 2009 - Carbon emissions reductions up to 2050, IEA Publishing. Licence: www.iea.org/tc [19]. 1) Quarrying raw materials, 2) crushing, 3) preparing raw meal, 4) preheating and co-processing, 5) pre-calcining, 6) producing clinker in the rotary kiln, 7) cooling and storing, 8) blending, 9) grinding, 10) storing in silos for loading and packaging
Clinker can be produced in “wet” or “dry” processes, depending on the moisture con-centration in the raw materials. The wet process needs a higher amount of energy due to the moisture vaporization.
Typically, 30-40% of total CO2emissions comes from the combustion of fuels, while
the other 60-70% comes from the calcination, defined by IUPAC as “heating to high tem-peratures in air or oxygen”. The chemical reaction that decomposes limestone into lime, with release of CO2is:
CaCO3−−−⇀↽−−− CaO + CO2 (calcination)
Calcination mostly occurs in the “precalciner” (step 5, Figure 3) and it is completed in the “clinker” or kiln (step 6, Figure 3).
2 Thermodynamic model and process simulation
2.1 The CO
2-NH
3-H
2O system
The NH3-CO2-H2O system can be modeled using the so called “Thomsen model”, which
is a thermodynamic model originally developed by Thomsen and Rasmussen [2] and suc-cessively upgraded by Darde et al. [20].
Several equilibrium processes are considered in the CO2-NH3-H2O system:
- vapor-liquid equilibria:
CO2(g)−−−⇀↽−−− CO2(aq) (7)
NH3(g)−−−⇀↽−−− NH3(aq) (8)
H2O (g)−−−⇀↽−−− H2O (l) (9)
- speciation equilibria (in the liquid phase):
H2O (l) −−−⇀↽−−− OH−+ H+ (10)
NH3(aq) + H+−−−⇀↽−−− NH4+ (11)
CO2(aq) + H2O (l) −−−⇀↽−−− HCO3−+ H+ (12)
HCO3−−−−⇀↽−−− CO32−+ H+ (13)
NH3(aq) + HCO3− −−−⇀↽−−− NH2COO−+ H2O (l) (14)
- liquid-solid equilibria: NH4++ HCO3− −−−⇀↽−−− NH4HCO3(s) (15) NH4++ NH2COO− −−−⇀↽−−− NH2COONH4(s) (16) 2NH4++ CO32−+ H2O ↽−−−⇀−−− (NH4)2CO3· H2O(s) (17) 4NH4++ CO32−+ 2HCO3− −−−⇀↽−−− (NH4)2CO3· NH4HCO3(s) (18) H2O (l)−−−⇀↽−−− H2O (s) (19)
As shown, the model considers the formation of 5 different solids: NH4HCO3 ammonium bicarbonate (BC)
(NH4)2CO3· NH4HCO3 ammonium sesqui-carbonate (SC)
(NH4)2CO3· H2O ammonium carbonate monohydrate (CB)
NH2COONH4 ammonium carbamate (CM)
In the Thomsen model, the extended UNIQUAC model is used in calculating the activity coefficients of the aqueous species, while the gas phase fugacity coefficients are calculated using the SRK equation of state.
A schematic summary of phase equilibria and reactions is reported in Figure 4
Figure 4: The CO2–NH3–H2O system as described in the Thomsen model [20]. Reprinted
from Chemical Engineering Science, 133 (2015), Daniel Sutter, Matteo Gazzani, Marco Mazzotti , Formation of solids in ammonia-based CO2capture processes — Identification
of criticalities through thermodynamic analysis of the CO2–NH3–H2O system, Pages No.
170-180, Copyright 2015, with permission from Elsevier [2]
2.2 Equilibria calculations
Each equilibrium equation described in 2.1 can be written in the form of equation 20: −∆G 0 j(T ) RT = ! i υi,jln ai (20) where ∆G0
j is the standard state Gibbs energy of formation increment for process j at a
spe-cific temperature T , aiis the activity and υi,jis the stoichiometric coefficient of component
i in process j.
Equilibrium composition is calculated by solving the system of equations (7)-(14). Af-terwards, solids formation has to be verified by checking equations (15)-(19). If one or more solid phases form, the system of equations needs to be integrated with equilibrium equation (among (15)-(19)) of the solids formed and solved again.
2.2.1 Speciation equilibria
In the Thomsen model, the extended UNIQUAC model is used to calculate the activity coefficients of the aqueous species. The original UNIQUAC model, originally developed by Abrams and Prausnitz [21] and Maurer and Prausnitz [22], was extended by Thomsen
and Rasmussen [23] by the addition of a Debye-Hückel term:
GEextendedUNIQUAC = GEcombinatorial+ GEresidual+ GEDebye-Hückel (21)
in which GE
i is the excess Gibbs energy for the generic term i in the equation. So equation 21
is the sum of an entropic term (combinatorial), an enthalpic term (residual) and the Debye-Hückel electrostatic term. The latter term takes into account ionic species in solution. In this way, the extended UNIQUAC model is able to account for the electrostatic interactions in the system.
At equilibrium conditions, for each reaction, the sum of the chemical potential of the reactants is equal to the sum of the chemical potentials of the products. The chemical po-tentials must be written by following some conventions. In the “Thomsen model”, water has been considered the solvent in the system, while NH3is considered as a solute. Therefore,
the symmetrical convention has been adopted for water, whereas the rational unsymmetrical potential has been chosen for all the other species. So, the chemical potential of water in liquid phase is calculated as:
µH2O(l) = µ0H2O(l)+ RT ln aH2O(l) = µ0H2O(l)+ RT ln (γH2O(l)xH2O(l)) (22)
where µ0
H2O(l) is the standard state chemical potential of water at temperature T , R is the
gas constant, aH2O(l) is the activity, γH2O(l)is the activity coefficient and xH2O(l)is the mole
fraction of water in the liquid phase. While, for the other species in the liquid phase, the chemical potential can be written as:
µi(aq) = µ∗i(aq) + RT ln a∗i(aq) = µ∗i(aq)+ RT ln (γi(aq)∗ x∗i(aq)) (23)
where the lettering is the same as equation 22, but the “*” indicates the unsymmetrical convention.
The chemical potential is calculated as the standard state chemical potential, plus the concentration dependence term, where the latter is calculated by means of the thermody-namic model.
So one can solve the system of speciation equilibria equations (10-14).
2.2.2 Vapor-liquid equilibria
At equilibrium, the fugacity of the liquid phase equals the fugacity of the vapor phase. Therefore, equation 24 is obtained:
P yiφi = Hi,w∗ (T, Pws) exp v∞ i,w× (P − Pws) RT γ ∗ ixi (24)
different from 1, a new pressure is guessed and the system is solved again.
The bubble point of the aqueous electrolyte solution is calculated by a γ − φ approach, paired with equilibrium speciation reactions [2] [24] [25].
The phase equilibrium is found by guessing the pressure and the vapor composition. For each component i, the vapor-phase fugacity can be written as follow:
¯ fV
i = yiΦiP (25)
where yi is the mole fraction of component i, Φi is the fugacity coefficient of component i
and P the total pressure. The Thomsen model exploits the SRK equation of state to calculate the gas phase fugacity coefficients.
At this point, the existence of the vapor phase is checked by running bubble pressure calculations. In case of vapor-liquid phase coexistence, Henry’s law is exploited for the calculation of the liquid phase fugacity, in which a Poynting factor has been used for pressure correction of Henry’s law constant:
¯ fiL= Hi,w∗ (T, Pws) exp v∞ i,w × (P − Pws) RT γ ∗ ixi (26)
where P is the pressure of the system, H∗
i,w(T, Pws) is the Henry’s constant of compound i in
pure water on the mole fraction scale, Ps
w is the saturation pressure of water at the specified
temperature, vinfi,w is the partial volume of compound i at infinite dilution.
Equation for ammonia in water comes from Rumpf and Maurer [26]: ln H∗ NH3,w× Mw = 3.932− 1879.02K T − 355134.1K2 T2 (27)
where H is the Henry’s law constant in MPa, Mwis the molar weight of water in kg/mol−1
and T the temperature in K. Equation for carbon dioxide in water comes also from Rumpf and Maurer [26]: ln H∗ CO2,w× Mw = 192.876− 9624.4K T − 1.441 × 10 −2K−1× T − 28.749 × ln T (28)
where the same units as equation 27 are used.
2.2.3 Solid-liquid equilibria
As described before, the j − th equilibrium process between an aqueous phase and a solid i is described by the following equation:
ln Kj(T ) = − ∆G0 j(T ) RT = ! i υi,jln ai (29)
from which the equilibrium constant of the j − th equilibrium process can be defined. The equilibrium constant can be rearranged in the following form:
Kj =
"
i
aυi,ji (30)
where ai = miγi is the activity coefficient for the ions and aH2O = xH2OfH2Ois the activity
coefficient for the water. The activity of the salt is in its standard state, therefore is equal to 1.
In this field, the equilibrium constant of a dissolution reaction of a salt in a solution is also called “ionic product”, calculated at the conditions of the solution considered:
KI(T, P, ¯x) =
"
i
aυi,ji (31)
The equilibrium constant calculated at saturation is called “solubility product” of the generic salt i, function of the temperature alone: Kj(T ). The temperature dependence of the
solu-bility product can be computed using the van’t Hoff equation.
To verify solids formation in the system, the “supersaturation index” (SI) can be ex-ploited. It is defined as the ionic product of a generic dissolution reaction of a salt divided by its solubility product [27]:
SI = KI(T, P, ¯x) Kj(T )
(32) If:
• SI = 1, the solution is at saturation;
• SI > 1, the solution is supersaturated and precipitate is formed; • SI < 1, the solution is unsaturated.
2.3 Thomsen model development
UNIQUAC volumes, UNIQUAC surface area and temperature dependent binary interaction energy parameters are required by the extended UNIQUAQ model, which need to be fitted on experimental data [25] [2] [20]. SRK equation is applied with standard mixing rules. No interaction parameters are taken into account. Further details can be found in the work of Thomsen et al. [23].
In general, the Thomsen model parameters for the CO2-NH3-H2O system have been
fitted based on more than 3700 data [20]. The model is able to describe the system in a range of ammonia concentrations up to 80 molal, temperatures between 0 and 150◦C, and
2.4 Ternary phase diagrams
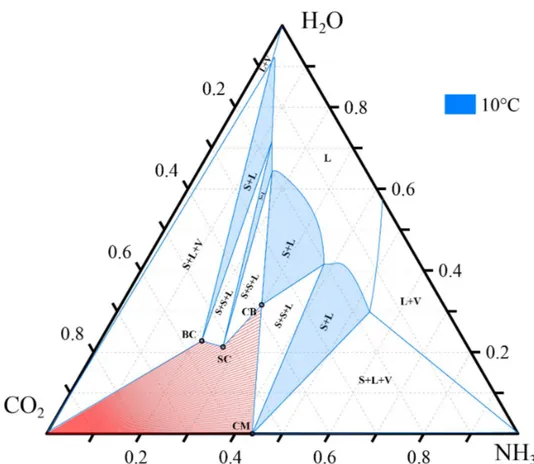
Ternary phase diagrams are a very powerful tool to describe the CO2-NH3-H2O system.
An example of ternary phase diagram at 10◦C and 1.013 bar is shown in Figure 5.
Figure 5: Isothermal ternary phase diagram at 10◦C and 1.013 bar, compositions in weight
fractions
Due to different equilibria in the CO2-NH3-H2O system, more than three species are
present in a solution. What the ternary phase diagrams show is the overall mass fraction of CO2, NH3and H2O , with respect of the real speciation. These mass fractions will be
referred as apparent composition CO2, NH3and H2O , respectively.
Each solid is indicated with a circle, which is invariant. Solid phase is indicated with S, liquid phase with L and vapor phase with V.
Each colored S-L region belong to one solid, in which the solid coexists with the liquid phase. The regions are bound by two straight lines and a curve, which is the “solubility isotherm”. The solubility isotherms separate the liquid phase region from the region in which solids formation occurs. If a generic system composition is chosen within one of the S-L regions and a tieline is drawn, which connects the system composition with the corresponding solid, the line crosses the solubility isotherm. The intersection point gives the composition of the mother liquor in equilibrium with the solid phase.
S-L regions are separated by S-S-L regions, in which two solids coexist with the liquid phase. The composition of the mother liquor is the corner of the triangular region, intersec-tion point of two solubility isotherms.
These are the relevant information useful for the purpose of this thesis. Further details about ternary phase diagrams have been reported by Sutter et al. [15].
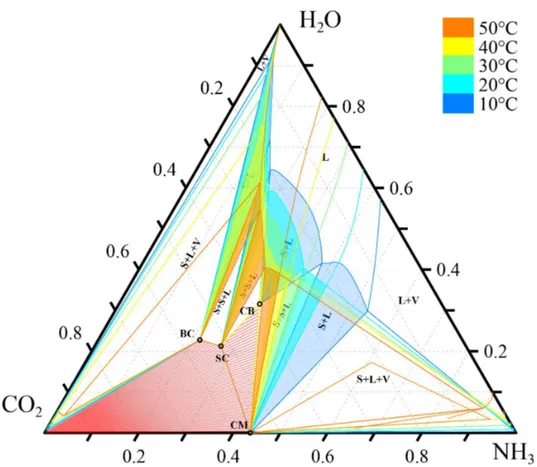
The variation of the solubility as a function of the temperature is shown in Figure 6. The S-L regions are highlighted based on a temperature-dependent colorcode. As shown,
Figure 6: Isothermal ternary phase diagram at 1.013 bar and 10, 20, 30, 40 and 50◦C,
compositions in weight fractions. Labels and phase boundaries are only shown for 10◦C
for better visibility
the S-L regions become smaller as the temperature increases, except for the region related to the ammonium sesqui-carbonate, which expands.
Important information can be gathered about ammonium carbonate monohydrate. As shown in Figure 6, ammonium carbonate monohydrate does not appear at 50◦C. In fact,
at 43◦C the S-L region related to ammonium carbonate monohydrate collapses into a line,
whose endpoint falls at the intersection of the solubility curves of ammonium sesqui-carbonate and ammonium carbamate, which meet at 43◦C [15].
2.5 Aspen Plus® implementation
The standard model to describe the CO2-NH3-H2O system in Aspen Plus is the
electrolite-Non-Random Two-Liquid model (e-NRTL), which is implemented as default.
Recently, also the Extended UNIQUAC model has been implemented in Aspen Plus [24]. Darde et al. [24] has shown that the Extended UNIQUAC model describes better the CO2-NH3-H2O system rather than the e-NRTL model.
The implementation of the model on Aspen Plus has been used for the aim of this thesis to simulate the CSF-CAP plant.
3 Process description
3.1 MEA-based processes
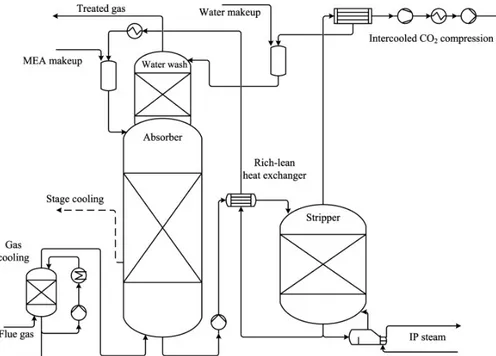
The absorption/stripping process configuration for CO2removal with MEA is shown in
Fig-ure 7.
Figure 7: Flowsheet for CO2removal with MEA. Reprinted from Energy, 36 (2011), R.
Strube, G. Pellegrini, G. Manfrida, The environmental impact of post-combustion CO2capture with MEA, with aqueous ammonia, and with an aqueous ammonia-ethanol
mixture for a coal-fired power plant, Pages No. 3763-3770, Copyright 2011, with permission from Elsevier [17]
It mainly consists of two columns, an absorber and a desorber (stripper). The flue gas is cooled down and fed to the packed bed absorption tower, in which contact with the aque-ous solution of MEA occurs, referred as CO2-lean stream. The absorption process triggers
several reactions in the liquid phase, described in Section 2. At the exit of the absorber, the flue gas is washed to decrease MEA losses, and emitted to atmosphere. The liquid stream exiting the absorber, concentrated in CO2, which will be referred as CO2-rich stream, is
heated up and sent to the desorber where CO2is stripped by steam produced at the bottom
of the column.
At the top, the stream of H2O and CO2is collected and sent to a condensation step to
recover water and obtain a CO2stream with high purity, to be further sent to compression.
The regenerated solvent, obtained in the desorber, is cooled down by means of the heat exchanged with the stream loaded in CO2coming from the absorber and is recirculated to
Table 1: Operating conditions and specifications of the MEA-based processes [28] Unit operations specifications
Absorber Desorber
T [◦C] 40-60 100-120
P [atm] 1 1.5-2
Streams specifications
CO2-rich CO2-lean
CO2-lean loading (molCO2,absorbed/molMEA) 0.4-0.5
MEA [% wt.] 30
the absorber.
Specifications of the MEA-based processes are reported in table 1.
3.2 Chilled Ammonia Process
Two different variants for CO2capture operation with ammonia-based solutions currently
exist, based on the absorption temperature adopted [16]. The first process is the Chilled Ammonia Process (CAP) in which the absorption of the CO2occurs at low temperature
(2-10◦C), whereas the second process includes the absorption section which works at higher
temperature (25-40◦C).
3.2.1 Liquid - Chilled Ammonia Process
The standard CAP, which will be referred as liquid-CAP (L-CAP), avoids solids formation throughout the whole plant, in contrast to the new generation process that exploits solid formation, described in section 3.2.2. The L-CAP is quite similar to the absorption/stripping process based on amines. It was patented in 2008 from Gal [29] and, in the same year, Alstom® started the development of L-CAP for commercialization purposes. The scheme of the process is shown in Figure 8.
The process is mainly divided in 5 sections, as shown in Figure 8:
- Flue gas cooling section: since the absorption occurs at low temperature, from which the lettering “chilled”, the hot flue gas which usually is at 100-110◦C needs to be
cooled down. This is accomplished by direct contact coolers (DCC). This also al-lows moisture, particulate and acidic or volatile species to condense into water, thus reducing their concentration in the gas phase [30];
- CO2capture section: in this section an absorption-desorption process allows the
sep-aration of the CO2and the regeneration of the solvent. After cooling, the flue gas
Figure 8: Flow scheme for the L-CAP process. Republished with permission of Faraday Discussions, from A low-energy chilled ammonia process exploiting controlled solid formation for post-combustion CO2capture, Daniel Sutter, Matteo Gazzani and Marco
Mazzotti, 192, 2016; permission conveyed through Copyright Clearance Center, Inc. [1] is put into contact with the absorptive solvent, which will be referred as CO2-lean
stream, in a counter-current arrangement.
The liquid stream leaving from the bottom of the absorber is loaded in CO2and will
be referred as CO2-rich stream. It passes through a heat exchanger, where it is cooled
down. A part of it is recycled to the absorber, as also mentioned in the patent [29] and it will be referred as pumparound. The pumparound is fundamental to increase the CO2concentration of the CO2-rich stream and decrease the temperature in the
absorber. The remaining part is pressurized, to reduce the vaporization of ammonia and water, and heated up by means of a heat exchanger with the regenerated solvent exiting the desorber, for heat recovery purposes, prior to be sent to the desorber. The desorption units operate at higher pressure than the absorption ones. The regener-ated solvent collected at the bottom of the desorber is the CO2-lean stream, which is
recirculated to the top of the absorber.
- CO2wash section: CO2is collected from the top of the desorber as a vapor mixture
containing ammonia and water. The latter are further recovered with a cold wash in a dedicated column. Highly pure CO2is obtained.
- CO2compression section: the highly pure CO2stream is sent to compression and
storage. CO2already exits the desorber at high pressure, with further reduction of the
energy penalty in this section.
- Flue gas water wash section: after absorption, the processed flue gas exits the ab-sorber. The ammonia content of the stream is usually very high and prior to the emis-sion of the flue gas to the environment, the concentration of ammonia needs to be reduced. This occurs by means of washings with cold water and an acidic solution. Although the numerous good features, the most relevant disadvantage of the process is the high evaporation rate of NH3, which will be referred as “ammonia slip
phenom-ena”. This leads to additional washing units in the plant required for its abatement. Further studies demonstrate that auxiliary loads for chilling and ammonia emissions control (later explained) could affect the process to the point that it would not be competitive anymore, although its advantages [31] [32].
Some zones of the L-CAP are prone to solids formation, because the operating condi-tions are close to the saturation. In particular, the absorber, the pumparound stream, the condenser of the desorber in the CO2capture section, the liquid stream exiting the desorber
in the flue gas water wash section and the column in the CO2water wash.
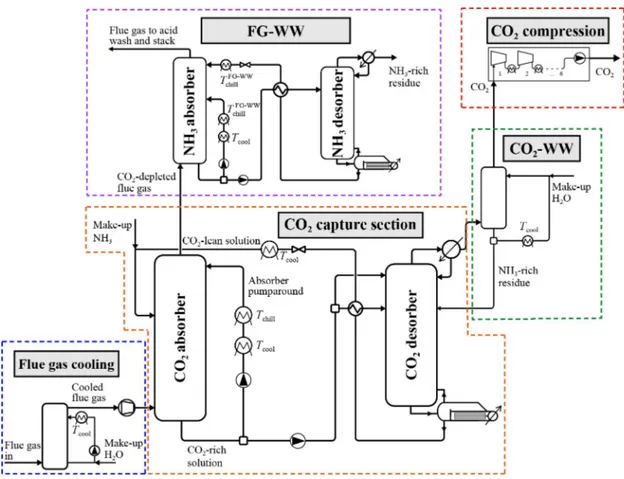
3.2.2 Controlled Solid Formation - Chilled Ammonia Process
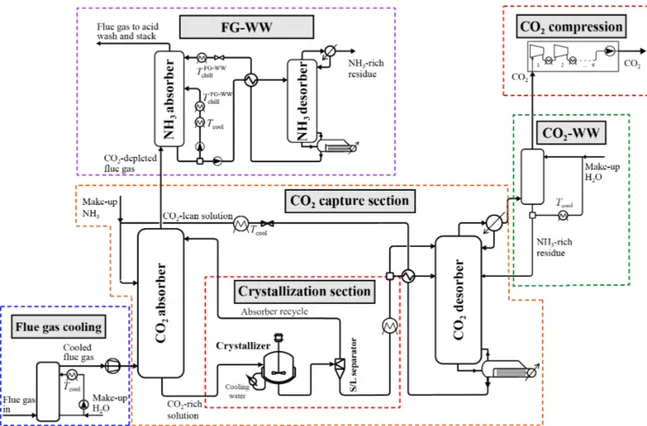
Recent developments of the CAP process have led to a different configuration of the plants, shown in Figure 9. The CSF-CAP (Controlled Solid Formation-Chilled Ammonia Process) is an implementation of the process by Sutter et al. [1] in which a crystallization section for precipitation, separation and dissolution is integrated in the CO2capture section, with the
aim to concentrate CO2in the stream exiting the absorber, decreasing the flow rates sent to
the desorber and so the heat duty required at the reboiler. This thesis focuses on the CSF-CAP process.
3.2.3 CAP and cement plants
Although CAP could readily be applied to the power industry, its application to cement plants is still under development compared to the CO2in power plant flue gases. The
main problem stems from the difference of CO2concentration of the flue gas. Typical
values of flue gas composition from power plants are about 10-14% vol. [12] [4], while CO2concentration in the flue gas from cement plants could exceed 16% vol.
The application of the CAP to cement plants is one of the most promising example of technology for CO2capture and storage. As stated before, ammonia solutions can hold
higher CO2loading, a fundamental feature for cement plant application. Furthermore, the
Figure 9: Flow scheme for the CSF-CAP process. Republished with permission of Faraday Discussions, from A low-energy chilled ammonia process exploiting controlled solid formation for post-combustion CO2capture, Daniel Sutter, Matteo Gazzani and Marco
Mazzotti, 192, 2016; permission conveyed through Copyright Clearance Center, Inc. [1] various industrial sources, such as cement plant. [1].
3.3 Aims of the Thesis
Based on the probable widespread utilization of CCS processes in the next future, even small developments of the process could lead to substantial improvements of CO2capture
at global level.
As explained before, ammonium bicarbonate (NH4HCO3) formation in the
crystalliza-tion seccrystalliza-tion is actually the state of the art of the Controlled Solids Formacrystalliza-tion-Chilled Am-monia Process. This thesis aims to find a new set-point of the CSF-CAP, in which ammo-nium carbonate monohydrate ((NH4)2CO3· H2O) crystallization is exploited, with the aim
4 Theoretical potential of ammonium carbonate
monohy-drate
Ammonium bicarbonate (NH4HCO3) formation within the crystallization section is
actu-ally the state of the art of the CSF-CAP. This thesis aims to find a new set-point of the CSF-CAP, in which ammonium carbonate monohydrate ((NH4)2CO3· H2O) crystallization
is exploited, with the aim to obtain a less energy-intensive process. The idea is supported by some theoretical potential.
4.1 CO
2capture yield
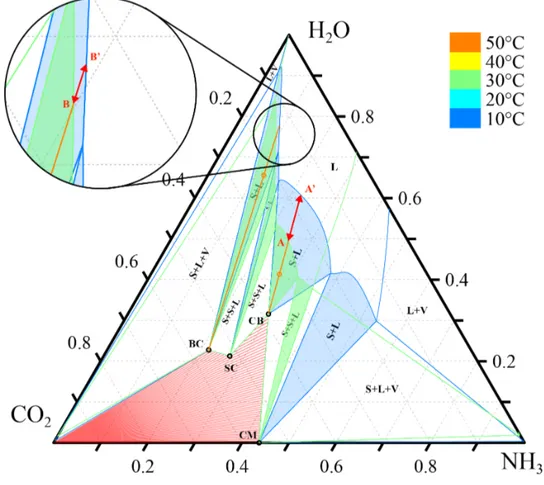
The first theoretical potential can be explained by looking at the variation of the solubility curves of the relevant salts as a function of the temperature. Figure 10 shows the ternary phase diagram for the CO2-NH3-H2O system at 10 and 30◦C, and 1 bar. The solubility of
ammonium carbonate monohydrate at 30 and 10◦C is indicated in the diagram as A and A’,
respectively. Similarly, the points B and B’ indicate the solubility of ammonium bicarbonate
Figure 10: Isothermal ternary phase diagram for the CO2-NH3-H2O system, at 10 and
at 30 and 10◦C, respectively.
If crystallization occurs, two phases in equilibrium form in the mixture, a solid phase and a liquid phase. The latter is also called “mother liquor”. The composition of the mother liquor in equilibrium with the solid phase is the intersection between the solubility curve at 10◦C and the tie line passing through the point of the initial mixture at 30◦C at saturation
and its relative pure solid (point A’ and B’ in Figure 10).
As can be seen, applying the lever arm rule, for a given temperature difference, the yield of solid formation is always higher exploiting ammonium carbonate monohydrate crystal-lization compared to the case of ammonium bicarbonate.
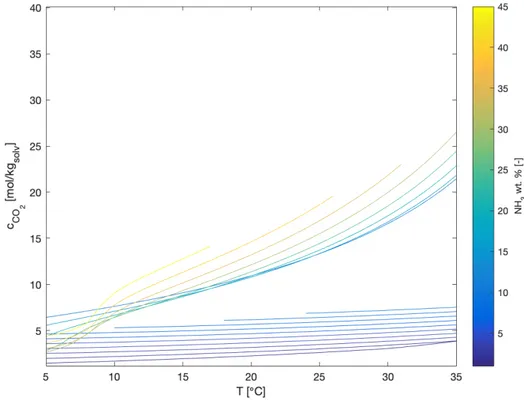
Another way to visualize the above mentioned theoretical potential is in Figure 11, which shows the CO2molality in an aqueous-ammonia solution as a function of the temperature,
for different NH3concentrations in the mixture. The Thomsen model has been exploited for
the calculation of the solubilities of the ammonium carbonate monohydrate and the ammo-nium bicarbonate. In particular, solubility data of both solids have been collected at different temperatures and ammonia concentrations in the ternary CO2-NH3-H2O system. The data
Figure 11: CO2concentration in aqueous-ammonia solution as a function of the
temperature of the system, for different NH3concentration in mixture
in the bottom part of the plot refers to a lower ammonia concentration, which corresponds to the case in which ammonium bicarbonate is crystallized. Whereas, the data in the upper part refer to higher ammonia concentration, which could lead to ammonium carbonate monohy-drate formation. As shown, for a given temperature difference, the change in concentration
of CO2in solution is more accentuated when a higher ammonia content is employed. This
means that, when crystallization is exploited, for a given temperature difference, a higher CO2difference is obtained in the mother liquor, thus a higher amount of CO2is transferred
to the solid phase, if a higher ammonia concentration is exploited in the solvent. The crystallization yield, in terms of equivalent CO2, can be defined as:
Y = mCO2(Tmix)− mCO2(Tcrystallization) mCO2(Tmix)
× 100 (33)
where mCO2(Ti) is the molality of the apparent CO2in the liquid phase at a certain
tempera-ture, Tmixis the temperature of the mixture leaving the absorber that you want to crystallize,
Tcrystallizationis the temperature at which crystallization occurs. In the previous example, Tmix
is 30◦C and Tcrystallizationis 10◦C.
Figure 12: Coloured points showing the yield percent of CO2obtained in a crystallization
process for a given mixture temperature, crystallization temperature and ammonia concentration in solution.
Based on this definition, the CO2capture yield has been calculated as a function of the
mixture temperature Tmix, crystallization temperature Tcry, and concentration of ammonia
ω0
NH3 in the aqueous-ammonia solution employed. The mixture temperature and the
crys-tallization temperature define the temperature difference used in the cryscrys-tallization section. Figure 12 shows the CO2capture yield percent obtained for a given temperature
solution. As shown, in the region at higher ammonia concentration, the same CO2capture
yield can be obtained exploiting lower temperature differences, compared with the case at lower ammonia concentration.
4.2 CO
2absorption rate
The second theoretical potential can be explained by looking at the plot in Figure 13. It shows the CO2partial pressure in aqueous solutions at different fixed amounts of NH3and
various amounts of CO2, at constant temperature.
Figure 13: The partial pressure of carbon dioxide in aqueous solutions of fixed amounts of ammonia and various amounts of carbon dioxide. Comparison of experimental and calculated values at 20◦C. Reprinted from Chemical Engineering Science, Vol. 54 (1999),
Kaj Thomsen, Peter Rasmussen, Modeling of vapor—liquid—solid equilibrium in gas—aqueous electrolyte systems, Pages No. 1787—1802, Copyright 1999, with
permission from Elsevier [2]
Data showed does not refer to the real values, but they merely serve explanation pur-poses. The flue gas flowing at each section of the absorption column is at constant CO2partial
pressure. In Figure 13 it is indicated by a horizontal blue line. Concerning the aqueous phase in the column, for a given CO2concentration in solution, the CO2partial pressure
decreases as the NH3content in solution increases. This means that the CO2solubility in
aqueous ammonia solutions increases as the ammonia concentration increases. The red line in Figure 13 indicates an aqueous solution at constant CO2concentration. The difference
phase, at each section of the column, is the driving force for mass transfer in the absorption column. For a given absorbant solvent with a certain NH3concentration sent to the column,
the driving force will be different. In particular, considering an aqueous ammonia solution at constant CO2concentration, for a given ammonia content there will be a certain driving
force (∆pCO2,1 in Figure 13). If the ammonia concentration of the solution increases, the
CO2partial pressure will be lower, so the driving force for CO2transfer from the flue gas
to the absorbant will be greater (∆pCO2,2in Figure 13).
In conclusion, this is an advantage when ammonium carbonate monohydrate is exploited in CSF-CAP, because higher concentrations of ammonia are used compared to the ammo-nium bicarbonate-exploiting CFS-CAP. This translates to faster absorption rates and there-fore smaller equipment are required to perform the absorption operation.
5 Process analysis, optimization, and performance
evalu-ation
The optimization of the CO2-capture process described in this thesis encountered a series
of challenges [sutter2]:
- The complexity of the thermodynamic model describing the systems;
- A relatively complex flowscheme consisting of several different units controlled by a large number of decision variables;
- Different types of energy duties (e.g. heating, cooling, chilling, and electric);
- A multi-objective optimization is required for the evaluation of the process perfor-mance, often leading to conflicting objectives (e.g. capital costs and operative costs). The literature lack of works focused on a rigorous optimization of the CAP. Some research proposed a single-variable sensitivity analysis, but their efficacy is strongly affected by the inter-dependency of the operating variables in the system [1].
In the work of Sutter et al. [1], the optimization is based on a multiple-variable sensi-tivity analysis, which can overcome the problems due to inter-dependencies. This kind of analysis is referred as heuristic optimization, since it screens the design space with a brute force approach.
The optimization algorithm proposed in this work is schematically shown in Figure 14. Matlab launches simulations in Aspen Plus and acts as the data manager. Each of the four coloured section is analyzed alone. Input variables for the analyses are the parameters indicated with the same colour as the section in which they are used. Dashed lines indicate the data flux among blocks. The algorithm is divided into 5 main parts:
1. At the beginning, a set of feasible operating conditions for the new set-point of the plant has been found.
2. An optimization which concerns three different sections of the plant (flue-gas cool-ing section, absorption section and regeneration section) is performed sequentially, till convergence is reached. The set of feasible operating conditions found in the pre-vious section is used in this step as an initial guess. In contrast to prepre-vious work present in literature, a rigorous optimization has been then performed. The algorithm uses the patternsearch function implemented in the optimization toolbox of Matlab [33] and it is interfaced with Aspen Plus. Furthermore, a preliminary multi-variable sensitivity analysis is performed on the regeneration section, in order to reduced the
Figure 14: Scheme of the algorithm used for the optimization of the CSF-CAP plant number of operating variables employed in the overall optimization, thus reducing the computational power and the time required for the simulations, as well as the size of the design space.
3. The results obtained for the exhaust flue gas stream leaving the absorber are the inputs of a rigorous optimization of the flue-gas water wash section, performed in Aspen Plus.
4. The information collected for the purified CO2-stream leaving the CO2-wash section
are used for the compression section duty calculation.
5. The results from block 2, 3 and 4 in Figure 14 are collected for the performance evaluation of the overall plant.
5.1 Range of feasible operating conditions
The CSF-CAP flowscheme used for the simulations is the one presented in Section 3.2.2. Due to the complexity of the plant, each section has been previously analyzed alone. The aim was to find a set of feasible operating conditions which allows the proper operation of the plant, with ammonium carbonate monohydrate formation in the crystallization section, and to understand how the plant behaves under different operating conditions. The study has allowed to identify the performance of the different unit operations and the criticalities when the process variables have been modified.
The work has not only shown that different operating conditions are required for the new set-point of the plant, but also a resizing of some unit operation is needed. Nevertheless, a goal has been to keep the flowscheme of the plant as similar as possible to the one of the CSF-CAP, for comparison purposes.
5.1.1 Absorption section
The CO2absorber, coupled with the crystallizer and the solid-liquid separator has been
ana-lyzed. This has been chosen as the starting point of the analysis since it represents the most critical part of the plant. Figure 15 shows the flowscheme used in the analysis. Further
Figure 15: Detailed flowscheme of the CO2absorber, the crystallizer and the solid-liquid
separator from the CSF-CAP details are:
- The absorber is mainly composed by two sections, separated where the CO2-lean
stream enters the column. The top part of the column is the so called “NH3slip
re-duction section”, in which the treated flue gas, which has been enriched in ammonia, flows counter-currently with respect to the pumparound stream entering the column at the top. This allows for a reduction of the ammonia content in the flue gas. Am-monia slip is usually given in part-per-million (ppmv) with respect to the treated flue
gas stream. The bottom of the column is the “CO2uptake section”. The CO2-lean
stream, which mixes with the liquid coming from the top, absorbs the CO2from the
flue gas, fed to the bottom part of the column.
- The crystallizer is treated as an equilibrium stage. The solid product collected is a solid phase in equilibrium with its mother liquor.
- The solid-liquid separator is an hydrocyclone, which allows for solid-liquid separation of the solids, accordingly to the splitting factor chosen.
For the analysis, several process variables have been taken into account:
- Liquid-to-gas flow rate ratio (L/G): is the ratio between the mass flow rate of the CO2-lean stream and the mass flow rate of the flue gas to be treated.
- CO2loading (lCO2): defined as the apparent molar flow rate of CO2in the lean stream,
divided by the apparent molar flow rate of NH3in the same stream:
lCO2 = ˙n CO2-lean CO2 ˙nCO2-lean NH3 (34)
- Mass fraction of ammonia in the CO2-lean stream on a carbon free basis (ωNH30 )
de-fined as the ratio between the mass flow rate of NH3in the lean stream and the sum
of the mass flow rate of NH3and H2O in the same stream:
ωNH30 =
˙
mCO2NH3-lean
˙
mCO2NH3-lean+ ˙mCO2H2O-lean
(35) - Hydrocyclone splitting factor (αl): defined as the mass flow rate of the mother liquor
in the slurry phase sent to the desorber, divided by the mass flow rate of mother liquor in the stream entering the hydrocyclone:
αl=
˙
mslurry outmother liquor ˙
minmother liquor (36)
- Crystallization temperature (Tcry), defined as the temperature exploited in the
crys-tallization section.
- Temperature of the CO2-lean stream (TCO2-lean).
The lCO2 and the ωNH30 determine the composition of the CO2-lean stream.
To be in line with the ammonium bicarbonate-crystallizing CSF-CAP, CO2capture rate
greater or equal than 90% wt. has been set as a process constraint. The CO2capture rate is
defined as:
ψCO2 = m˙ in
CO2 − ˙moutCO2
˙
minCO2 × 100 (37)
After the simulation converges, a key output parameter has been checked, which can give a feedback on the proper functionality of the unit operations. In particular, the am-monia slip has been checked, which is a criticality in this system and it cannot be easily controlled.
Figure 16 shows the equilibrium partial pressures of ammonia peqNH3 at 1 bar and 10◦C
the region proposed in the literature where the compositions in the CO2-absorber should lie.
The left and right borders are the minimum and maximum CO2-loading (0.25-0.67),
respec-tively, suggested in the patent of Gal [29]. The upper and lower borders are suggested by Yu et al. [34] and Darde et al. [16], respectively. They correspond to the minimum and max-imum ammonia mass fraction on a carbon free basis proposed. Formation of ammonium
Figure 16: Equilibrium partial pressure of NH3at 1.013 bar and 10◦C in the ternary phase
diagram at the same conditions. The gray area represents the expected compositions range in the CO2-absorber from literature data [29] [34] [16]
carbonate monohydrate is achieved if the operating range of the absorber is in the lower part of the gray area, hence at higher ammonia concentration. Due to higher ammonia partial pressure, so higher ammonia slip is obtained in the ammonium carbonate monohydrate-crystallizing CAP when compared to the ammonium bicarbonate-monohydrate-crystallizing CSF-CAP. Moreover, the higher the values of ammonia slip, the higher the energy required for its abatement in the flue gas water wash section. Therefore, the ammonia slip needs to be kept as low as possible to decrease the energy duty of the plant.
The interplay between the different operating variables chosen is important to under-stand how the NH3slip can be controlled. In particular, NH3and CO2 concentrations and
temperatures in the absorber have to be analyzed as shown in the work of Sutter et al. [1] The temperature, as well as the CO2-loading, strongly affects the ammonia partial
pres-sure. The pumparound is the parameter that mostly influence the ammonia slip phenomenon. The low temperature and the acidic conditions (high CO2concentration) of the stream lead
to a decrease of the ammonia equilibrium partial pressure [15]. Additionally, if other param-eters lead to a decrease of the temperature and the pH, this would positively influence the ammonia slip phenomenon. Clearly, temperature and pH can be lowered down to a certain
extent, to still enable the proper functioning of the CO2absorption process.
Furthermore, the ammonia slip itself could also affect the temperature profile, in par-ticular if the ammonia slip is too high, since the evaporation of ammonia is an endothermic process. So, a strong interplay is present between ammonia slip and the temperatures in the absorber.
A typical good temperature profile of the absorber is shown in Figure 17. Since the
ab-Figure 17: Typical temperature profile of the CO2absorber operated in a proper mode
sorption process is exothermic, the temperatures are expected to increase from the top to the bottom. The temperature profile is not completely linear, but two jumps are present, relative to the feed of the CO2-lean stream and the flue gas.
The ternary phase diagram in Figure 18 shows the liquid composition on each stage along the CO2absorber, as well as the composition of the liquid feed sent to the absorber and the
compositions of the streams obtained after the crystallization and the separation. Each point is coloured according to a temperature colorcode. The pumparound is fed at the top of the absorber. The pumparound composition lies very close to the solubility curve at the crystal-lization temperature. Thus, the pumparound is heated up of 1◦C to avoid solids formation.
From the pumparound, a number of points extends, pointing towards the NH3vertex. This
segment is representative of the NH3slip reduction section. The low temperature of the
pumparound and its high loading in CO2allow the uptake of NH3in the liquid phase.
The composition of the CO2-lean stream is chosen for each simulation. At the stage where
the CO2-lean stream is fed, the composition of the liquid phase lies on the tie line between
the last stage of the NH3slip reduction section and the CO2-lean stream, from which the
points representing the CO2uptake section depart, pointing towards the CO2vertex. The
Figure 18: Ternary phase diagram at 8, 21 and 30◦C and 1.013 bar showing the liquid
composition of the CO2-absorber stages and its related feed stream. Both isotherms and
concentration points follow the same colorcode shown.
separates a slurry phase from the mother liquor. The composition of the slurry phase lies on the tie line between the CB point and the CO2-rich stream composition. The position of the
point depends on the hydrocyclone splitting factor chosen. The lower the αl, the closer to
the CB point the slurry phase is. Whereas, the composition of the pumparound, which cor-responds to the separated mother liquor, is constant. The composition of the pumparound on the ternary phase diagram is at the intersection of the tie line indicated before with the solubility curve at the crystallization temperature. The lever arm rule can be exploited to calculate the amount of solid formed in the crystallizer.
With the aim to increase the yield of solid formation and explore a wider region of the ternary phase diagram, different simulations have been performed, which are shown Figure 19. Based on the preliminary knowledge on the absorber, different decisions have been made to run the simulations. The loading of the CO2-lean stream has been chosen
as the maximum possible, since it impacts positively the NH3slip phenomena. Therefore,
the CO2-lean stream lies close to the solubility curve at its temperature. For this purpose,
different operating conditions have been used. In particular, higher ammonia concentration in the CO2-lean stream. The different cases shown in Figure 19 have been obtained, where
Figure 19: Ternary phase diagram at 8, 21 and 30◦C and 1.013 bar showing the liquid
composition of the CO2-absorber stages and its related feed stream. Both isotherms and
concentration points follow the same colorcode shown. The magnifications refers to three different processes with three CO2-lean stream used. Ammonia concentration in the
CO2-lean stream increases from a) to c).
the concentration profile of the CO2uptake section has been moved down in the plot due to
higher ammonia concentrations. As expected, higher ammonia slip has been achieved with increasing ammonia concentration.
If the ammonia concentration is still increased, as in the case shown in Figure 20, the concentration profile of the CO2-capture section starts to bend towards the direction of a
decrease of ammonia content in the liquid, which indicates ammonia evaporation from the solution. In fact, the bottom part of concentration profile is directed in the reversed direction of the NH3vertex, which means that NH3is being lost.
Finally, a different simulation at higher ammonia composition of the CO2-lean stream
has been performed, shown in Figure 21. In this case, the ammonia slip is so high that the concentration profile is not only bent, but it has a complete different direction with respect to the CO2vertex. Therefore, in the CO2uptake section not only CO2capture occurs, but
Figure 20: Ternary phase diagram at 8, 21 and 30◦C and 1.013 bar showing the liquid
composition of the CO2-absorber stages and its related feed stream. The CO2-absorber
concentration profile is bent due to ammonia slip phenomena. Both isotherms and concentration points follow the same colorcode shown.
other phenomena like ammonia and water evaporation or condensation are occurring. In conclusion, a higher NH3concentration and ammonium carbonate monohydrate
for-mation can be exploited in a CO2capture process with similar CO2capture rates. Table 2
resumes the NH3slip ranges obtained for the different CAP. The maximum ammonia slip
for the CB-CSF-CAP has been set to 45000 ppmv, because a feasible control of the absorber
is not possible when this critical value is reached.
A set of feasible operating conditions for the CO2absorber, crystallizer and
hydrocy-clone has been identified.
The four simulations shown before in Figure 18 and in Figure 19 fulfil all specifications and constraints in terms of ammonia slip and CO2capture rate, and guarantee stable
con-vergence. This lays the foundations to the feasibility of operating the CSF-CAP at higher ammonia concentrations. Although this preliminary analysis has shown that a proper con-trol of the absorber is not possible under certain conditions, the optimization presented in Section 5.2.2 explores a wider range of operating conditions, whose combination leads to
Figure 21: Ternary phase diagram at 8, 21 and 30◦C and 1.013 bar showing the liquid
composition of the CO2-absorber stages and its related feed stream. The concentration
profile is not pointing towards the CO2vertex. Other phenomena in the CO2-absorber are
not negligible compared with the CO2absorption. Both isotherms and concentration
points follow the same colorcode shown. find other feasible operating points.
The operating conditions for the simulation shown in Figure 18 and the three simulations shown in Figure 19 are resumed in Table 3.
5.1.2 Dissolution and regeneration section
The solvent regeneration section, which includes the dissolution section, the heat integra-tion, and the CO2desorber has been analyzed. The flowscheme of this section is shown in
Figure 22. Further details are:
- The dissolution section in Figure 22 is indicated as an heat exchanger for simplicity, but in reality the dissolution of the solids is made in a dedicated unit. In the work of Sutter et al. [1], sufficient residence time, good mixing, and efficient heat trans-fer are listed as requirements for this unit. The requirements match the ones of the crystallizer. Furthermore, it also states that it is energetically more efficient to
oper-Table 2: NH3slip ranges in the exhausted flue-gas leaving the absorber for different CAP [1] min [ppmv] max [ppmv] L-CAP 6300 11900 BC-CSF-CAP 1200 3500 CB-CSF-CAP 18300 45000* *maximum value set for screening results
Table 3: Feasible operating conditions and specifications for the absorption section Case 1 Case 2 Case 3 Case 4
L/G 3.1 3.0 2.9 2.9 ω0 NH3 0.30 0.32 0.33 0.35 lCO2 0.339 0.325 0.313 0.315 Tcry [◦C] 8 8 8 8 αl 0.18 0.2 0.18 0.15 TCO2−lean[◦C] 21.2 21.2 21.2 21.2
ate the dissolution section at higher pressure, because either problems due to vapor phase formation are reduced, and the required work for pumping is reduced at lower temperature.
- The CO2-rich stream coming from the dissolution section is split. The first part is
sent to heat recovery with the regenerated CO2-lean stream, before entering the
des-orber at around two thirds of the stages (counting from the top). The second part is directly fed to the top of the desorber. In comparison with the ammonium bicarbonate-crystallizing CSF-CAP, the condenser at the top of the desorber has been eliminated. Condensation at the top can be still achieved with a suitable extent with the split of the cold CO2-rich stream.Therefore, issues related to solids formation are completely
avoided. Furthermore, as shown later in this work, the split of the CO2-rich stream
positively impact the energy duty when compared with the flowscheme that includes the condenser.
- The reboiler temperature has always been kept lower than 150◦C, due to severe
cor-rosion problems occurring above that temperature.
The composition of the liquid phase and the slurry phase after the hydrocyclone are shown only for “Case 1” from the previous analysis in Figure 23. The liquid phase compo-sition and the slurry phase compocompo-sition exiting the hydrocyclone lie on the tie line passing the hydrocyclone feed composition and the stationary point of the ammonium carbonate monohydrate. The solubility curve at 50◦C is plotted to show that the slurry phase coming
from the hydrocyclone becomes liquid at that temperature. 50◦C has been chosen as the
Figure 22: Detailed flowscheme of the dissolution section and solvent regeneration desorber with heat integration
slightly lower (about 45◦C), but a conservative temperature has been chosen to avoid solids
presence. This stream is the so-called CO2-rich stream, which is sent to the desorber.
Figure 24 shows the liquid composition along the desorber in the ternary phase diagram. In this case, the simulation has been done with a pressure in the desorber of 25 bar. The CO2
-rich stream sent to the desorber is the one obtained in “Case 1” from the previous analysis. The pressure of the desorber has been set to 25 bar, while in the ammonium bicarbonate-crystallizing CSF-CAP the pressure was 10 bar. This allows to reduce the ammonia partial pressure in the gas phase, so its content in the gas sent to the CO2-wash section. Further
details are given in Section 5.2.1.
The reboiler duty of the desorber is chosen based on the CO2composition of the
regener-ated CO2-lean stream required. A make-up of NH3and H2O is required by the regenerated
CO2-lean stream, in order to account for losses of aqueous-ammonia in the exhausted flue
gas and in the purified CO2stream. CO2can not be added with a make-up stream, therefore
:
- If the reboiler duty is lower than needed, the CO2content in the lean stream will be
higher than required;
- If the reboiler duty is higher than needed, the CO2content in the lean stream will be
lower than required.
5.1.3 CO2wash section
Although a very high purity of CO2(about 99% wt.) in the gas stream recovered at the top of
the desorber is obtained, the ammonia content is still relatively high, so a further purification step is required. The goal is achieved in a water wash section, where the gas stream is put in contact with a cold water stream. The liquid stream leaving the bottom of the wash column is split. The majority is recycled to the wash column, to decrease the amount of fresh water
Figure 23: Ternary phase diagram at 8, and 50◦C and 1.013 bar showing the composition
of the hydrocyclone feed, as well as the composition of the liquid phase and the composition of the slurry phase obtained after separation.
used. The remaining part is recycled to the desorber in the CO2-capture section. The flow
rate of the latter is very low, so its effect on the performance of the desorber is negligible. The ammonia content in the gas stream leaving the desorber is higher with compared to the L-CAP and BC-crystallizing CSF-CAP, because of the higher ammonia concentration exploited. Therefore, the operating conditions of the CO2-wash section, as well as the size
of the unit operation, have been modified. In particular, the number of stages of the column and the (L/G)CO2-washhave been increased to achieved an higher capture of ammonia, thus
obtain an ammonia concentration in the CO2-stream sent to compression that observe the
constrain (<50 ppmv).
Table 4 resumes the main differences between the CO2-wash section of the
BC-CSF-CAP and CB-CSF-BC-CSF-CAP.
Table 4: CO2-wash section features for different CSF-CAP
BC-CSF-CAP CB-CSF-CAP (L/G)wash section 0.3 0.5
Figure 24: Ternary phase diagram at 95, 120, 130, and 145◦C and 25 bar showing the
liquid composition of the solvent regeneration desorber stages. Liquid composition is indicated with a circle. The vapor composition of the vapor leaving the top of the desorber
is shown with a triangle. Both isotherms and concentration points follow the same colorcode shown.
5.1.4 Flue gas water wash section
There are no conceptual differences in the flue-gas water wash section between the different CAP described so far.
Higher energy consumption is expected in this section when ammonium carbonate mono-hydrate is exploited in the CSF-CAP, due to the higher ammonia slip phenomena in the CO2-capture section.
An automated optimization of this section has been performed in Aspen Plus, which is described in details in Section 5.3.
5.2 Process optimization
As explained before, the optimization of the process focuses on the minimization of the energy consumption of the capture plant.
![Figure 4: The CO 2 –NH 3 –H 2 O system as described in the Thomsen model [20]. Reprinted](https://thumb-eu.123doks.com/thumbv2/123dokorg/7402900.97813/14.892.226.698.246.460/figure-nh-h-o-described-thomsen-model-reprinted.webp)