BIROn - Birkbeck Institutional Research Online
Ballatore, Andrea and Pang, A. and Pozzana, Iacopo and Prifti, Y. and
Provetti, Alessandro (2019) Geo-referencing as a connector between user
reviews and urban environment quality. In: 5th International Conference
on Computational Social Science IC2S2, 17-20 Jul 2019, Amsterdam, The
Netherlands. (In Press)
Downloaded from:
Usage Guidelines:
Please refer to usage guidelines at or alternatively [email protected].
5th International Conference on Computational Social Science IC2S2 July 17-20, 2019, University of Amsterdam, The Netherlands
Geo-referencing as a connector between user reviews
and urban environment quality
Keywords: User reviews; Geo-referenced data; Sentiment analysis; Urban Data Science The primary objective of this research is to understand the relationship between the positiv- ity of user-generated content, namely Airbnb reviews and the “attractiveness” of the neighbour- hood of the listing. Focussing on London wards and their Airbnb listings, we could identify some features which consistently signal positive sentiment and used best-subset selection to identify an overall relationship.
We identified the types of features most commonly associated with positive sentiment be- fore discussing how this information be used to influence urban development. Whilst analysis of the Airbnb market has been a popular area of study lately, to the best of our knowledge this specific research question has not been considered. To do so, we have located, accessed and
mashed-up a range of disparate and readily available data sources, namely:
1. Airbnb listing and review data from the online source insideairbnb.com; 2.
3. 4.
Points-of-Interest (POI) data from the Ordnance Survey;
Boundary-Line and London Ward data from university datasets, and
Well-Being Scores from the 2013 London Datastore (a Greater London Auth. initiative). Using these datasets, we will calculate a metric called the Offering Advantage which will measure which amenities are distinct within a neighbourhood. Such a metric, along with the well-being scores, are the basis for our overall “attractiveness” measure. Performing senti- ment analysis on the Airbnb reviews, we pruned the amenities which do not consistently signal positive sentiment through correlation analysis. The remaining amenities have been deployed in a Best-Subset selection model to understand which specific features are related to positive sentiment for an Airbnb review. So far, our analysis has focussed only on Greater London list- ings which, with its considerable differences in socio-economic factors and amenities in nearby neighbourhoods, should yield more conclusive results.
In order to measure the well-being for each London Ward, data was extracted from the 2013 London Datastore which combines twelve key social indicators across the following categories: Health, Economic Security, Safety, Education, Children, Families, Transport and Environment. Well-being scores over 0 indicate a higher probability that the population on average will expe- rience better well-being. The importance of each indicator can be customised by the user and weighted up/down on [0..10]. We looked at which POI Classifications were strongly associated with positive Airbnb sentiment in a London Ward, using the False Discovery Rate to control the proportion of false discoveries in the rejected hypothesis.
Having calculated the OA for all of the POI Classifications that were present in Greater London, these were then correlated to the average sentiment for Airbnb reviews in a Ward. Prior to application of the False Discovery Rate method, the correlation analysis led to 92 out of the
1
Andrea Ballatore, Alexandra Pang, Iacopo Pozzana, Ylli Prifti & Alessandro Provetti DCIS | Geography, Birkbeck, University of London
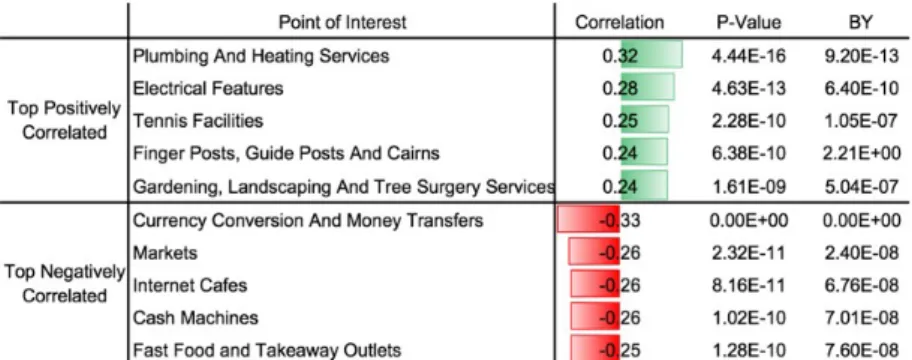
Figure 1: The top 5 positively and top 5 negatively correlated Classifications with positive Airbnb sentiment.
original 595 POI Classifications being significant at the 0.001% level. The Benjamini-Yekutieli method returned 37 Classifications that were significant at the 0.001% level. A summary of the top 5 positively and top 5 negatively correlated Classification is shown in Fig. 1.
Examining Fig. 1, correlations are weak to moderate, where r ∈ [−0.33, 0.33], but highly
significant in terms of their p-value suggesting there are a number of features which we can use to understand users perceptions of places, as well as which areas are likely to benefit from more positive reviews.
The second main step was to deploy choropleth maps to visualise how the presence of the significant classifications in Fig. 1 was distributed in London. From earlier research, we knew that sentiment increases in positivity as we move away from the Centre of London. To give additional context, we have also produced choropleth maps of the well-being score as e.g. in Figure 2.
Figure 2: Choropleth maps 1 - 5. show the Offering Advantage of the top 5 negatively corre- lated POI Classifications in Table 1., where darker shades of red indicate a higher OA value. Choropleth map 6. shows our Ward well-being score, where darker shades of red indicate a higher probability that the population in that Ward would experience better well-being on average.
The figure shows how negatively-correlated classifications such as Fast Food and Take- away Outlets, Internet Cafes and, to some extent, Cash Machines, have increased presence in central/East London, where well-being scores are lower and sentiment is less positive. There is less of a pattern with Currency Conversions and Money Transfers, and Markets.
Conclusions Our results identify clear patterns in sentiment showing that Airbnb user senti- ment increased in positivity as the location of the Airbnb listing moved further from the centre of Greater London, noting that, overall, Airbnb users have a bias toward positive review. We believe to have successfully identified several urban features that correlated to positive senti- ment and used these in a best subset selection model. Whilst limitations were identified, our work provides a solid platform for further analysis of Airbnb user -generated content wrt. urban features.