UNIVERSITY OF CATANIA
INTERNATIONAL PhD PROGRAM IN NEUROSCIENCE
XXXI Cycle
GRAZIA MAUGERI
THE ROLE OF VIP FAMILY MEMBERS
IN DIABETIC RETINOPATHY
PhD Thesis
Coordinator: Supervisor:
Prof. Salvatore Salomone Prof. Velia D’Agata
Copyright © G. Maugeri, 2018
All rights reserved. No part of this book may be reproduced, stored in a retrieval system or transmitted in any form or by any means, without prior permission of the author. The copyright of
List of abbreviations 2
Abstract 3
Chapter 1 - General Introduction and Aims 5
A FRAMEWORK FOR UNDERSTANDING DIABETIC RETINOPATHY 6 FOCUS ON THE MAIN ACTORS INVOLVED IN DR DEVELOPMENT 9
PACAP AND VIP IN DIABETIC RETINOPATHY 12
AIMS OF THE PhD WORK 15
Chapter 2 - PACAP Modulates Expression of Hypoxia-Inducible Factors in Streptozotocin Induced Diabetic Rat Retina
16
ABSTRACT 17
INTRODUCTION 18
MATERIALS AND METHODS 21
RESULTS 24
DISCUSSION 32
CONCLUSION 34
Chapter 3 - Modulation of IL-1β and VEGF expression in rat diabetic retinopathy after PACAP administration
40
ABSTRACT 41
INTRODUCTION 42
MATERIALS AND METHODS 44
RESULTS 47
DISCUSSION 53
Chapter 4 - VIP Family Members Prevent Outer Blood Retinal Barrier Damage in a Model of Diabetic Macular Edema
64
ABSTRACT 65
INTRODUCTION 66
MATERIALS AND METHODS 69
RESULTS 72
DISCUSSION 80
Chapter 5 - PACAP and VIP Inhibit HIF-1α-Mediated VEGF Expression in a Model of Diabetic Macular Edema
87
ABSTRACT 88
INTRODUCTION 89
MATERIALS AND METHODS 92
RESULTS 95
DISCUSSION 100
Chapter 6 – Concluding remarks 108
GENERAL DISCUSSION AND CONCLUSION 109
GENERAL LIST OF REFERENCES 112
inestimable support and for introducing me in the extraordinary research world.
I wish to express my sincere gratitude to Professor Filippo Drago and Professor Salvatore Salomone who gave me the opportunity to attend this prestigious PhD
program allowing me to discover the fascinating world of neuroscience.
I would like to thank Doctor Agata Grazia for her precious help and friendship.
I am also grateful to all friends and colleagues of the Section of Human Anatomy and Histology with whom I shared time, energies, smiles and efforts.
Last, but certainly not least, I wish to to thank my family, for its love and nonpareil support.
LIST OF ABBREVIATIONS
AC Adenylate Cyclase
AGE Advanced Glycation End Product
ARNT Aryl Hydrocarbon Receptor Nuclear Translocator
BRB Blood-Retinal Barrier
CTAD Carboxy-Terminal Transactivation Domain
DME Diabetic Macular Edema
DR Diabetic Retinopathy
ERK 1/2 Extracellular Signal-Regulated Kinase 1/2
GCL Ganglion Cell Layer
GPCR G-Protein Coupled Receptor
HIFs Hypoxia-Inducible Factors
HREs Hypoxia Responsive Elements
IL-1α Interleukin -1α
IL-1β Interleukin-1β
INL Inner Nuclear Layer
IPL Inner Plexiform Layer
MAPK Mammalian Mitogen Activated Protein Kinase
NFL Nerve Fiber Layer
NPDR Non-Proliferative Diabetic Retinopathy
NTAD Amino-Terminal Transactivation Domain
ODD Oxygen Dependent Degradation Domain
ONL Outer Nuclear Layer
OPL Outer Plexiform Layer
PACAP Pituitary Adenylate Cyclase-Activatingpeptide
PDR Proliferative Diabetic Retinopathy
PI3K/Akt Phosphoinositide 3 Kinase
PKA Protein Kinase A
PKC Protein Kinase C
PLC Phospholipase C
PR Photoreceptor
RGC Retinal Ganglion Cells
ROS Reactive Oxygen Species
RPE Retinal Pigmented Epithelium
STZ Streptozotocin
TNF- α Tumor Necrosis Factor-Α
VEGF Vascular Endothelial Growth Factor
VIP Vasoactive Intestinal Polypeptide
breakdown of blood-retinal barrier (BRB) as well as the aberrant angiogenesis activating many downstream target genes including inflammatory cytokines and vasoactive peptides, such as interleukin-1β (IL-1β) and vascular endothelial growth factor (VEGF). To date, intravitreal injection of agents directed against VEGF represents the elective DR therapy. However, they counteract efficaciently ocular neovascularization only in 50% of treated patients, suggesting that other pathogenic events may play an important role in non-responders. Therefore, there is an increased need for new molecule able to counteract microenvironmental alterations of DR.
It has been largely demonstrated that pituitary adenylate cyclase-activating peptide (PACAP) and vasoactive intestinal peptide (VIP) exert a protective effect against retinal injuries, including DR. However, until now, no study has investigated their protective role against the harmful combined effect of both hyperglycemia and hypoxia.
The main objectives of this PhD thesis have been evaluate whether PACAP protects retinal tissue of diabetic rats through modulation of hypoxia and inflammation, both converging on angiogenic process. Moreover, we have investigated the protective effects of PACAP and VIP on BRB integrity whose breakdown due to hypoxic and inflammatory event, leads to diabetic macular edema (DME).
The results have demonstrated that a single intravitreal administration of PACAP in streptozotocin-injected rats modulated the expression of hypoxic, inflammatory and
angiogenic factors. Moreover, PACAP and VIP restored the integrity of BRB through the activation of phosphoinositide 3 kinase (PI3K)/Akt and mammalian mitogen activated protein kinase/Erk kinase (MAPK/ERK) survival signaling pathways.
Overall, these data indicate that these peptides, both in vivo and in vitro, perform a beneficial effect to attenuate some pathologic events occuring in DR.
CHAPTER
1
A FRAMEWORK FOR UNDERSTANDING DIABETIC RETINOPATHY
Diabetes is a progressive lifelong disease characterized by hyperglycemia occurring when the feedback loops between insulin action and insulin secretion do not function properly. It represents one of the principal challenges to current health care. Worldwide, there will be a progressive increase of diabetes from 382 million in 2013 to 592 million in 2035 (IDF diabetes, 2013).
Diabetes mellitus is classified into the following general categories: type 1 diabetes, which is caused by β-cell destruction, usually leading to absolute insulin deficiency; type 2 diabetes, characterized predominantly by insulin resistance with an inadequate compensatory increase in insulin secretion; gestational diabetes mellitus, defined as glucose intolerance with onset or first recognition during pregnancy; other specific types of diabetes caused by infections, drugs, endocrinopathies, pancreatic destruction, and genetic defects (Diabetes Care, 2018).
Complications of diabetes are divided into macrovascular and microvascular. The first include stroke, coronary and peripheral arterial disease. Instead the microvascular complications comprise diabetic nephropathy, neuropathy and retinopathy (Fowler, 2008).
Diabetic retinopathy (DR) represents the major cause of vision loss affecting almost 100 million people worldwide (Leasher et al., 2016). The microvascular lesions represent the most important criteria to asses and rank the retina in DR. Nevertheless, diabetic milieu induces changes also in non-vascular cell types exerting a prominent role in DR development in unison with the vasculature.
DR can be generally divided into two clinical stages: non-proliferative stage (NPDR) and proliferative diabetic retinopathy (PDR).
and retinal neovascularization. Moreover, the hallmarks of early NPDR comprise vascular basement membrane thickening, the loss of pericytes and endothelial cells death. All of these features have been fully identified histologically in postmortem human eyes and in some preclinical models (Ljubimov et al., 1996; Yanoff, 1969;
Mizutani et al., 1996).
The progressive capillary nonperfusion due to ischemia regions and impaired oxygenation leads to PDR. This stage is driven by hypoxia and overexpression of proangiogenic growth factors triggering new blood vessels formation and relentless abnormal epiretinal fibrovascular proliferation with tractional retinal detachment (Stitt et al., 2016).
At any time during the progression of DR, patients can also develop diabetic macular edema (DME), representing the major cause of visual impairment in diabetic patients. DME appears as a consequence of blood-retinal barrier (BRB) breakdown (Bhagat et al., 2009).
The BRB is constituted by an inner and an outer part. The inner part is formed by tight junctions between retinal vascular endothelial and retinal glial cells realizing a barrier impermeable to proteins (Cunha-Vaz and Travassos, 1984).
The outer BRB is formed by tight junctions between the retinal pigment epithelial (RPE) cells, separating the neural retina from a network of choriocapillaris supplying nutrients, water, ions, and promoting the elimination of metabolic wastes through blood flow. Furthermore, outer BRB regulates the recycle of fatty acids that represent the major components of photoreceptors (Campbell and Humphries, 2012;
During BRB breakdown, proteins and other solutes move from capillaries into the extracellular space, causing an imbalance between hydrostatic and oncotic pressure. This event causes DME when fluid and protein deposits accumulate in the macular region, causing a thickening and swelling of the macula that can be either focal or diffuse (Cunha-Vaz and Travassos, 1984).
Figure 1. A) Cross-section of the human retina constituted by: ganglion cell layer, whose axons compose the optic nerve; the inner nuclear layer, formed by second-order neurons, such as bipolar, amacrine and horizontal cells; the photoreceptor (PR) layer, characterized by the cell bodies and nuclei of the rod and cone; the PR outer segments and the retinal pigment epithelium (RPE), a monolayer of cells containing tight junctions that separates the neural retina from the choroid. B) Schematic representation of the blood-retinal-barrier. The function of inner BRB is supported by Müller cells and astrocytes. Figure modified from Kuno and Fujii (2011).
microangiopathy and its underlying mechanisms. However, this condition appears only after an extended exposure to high glucose concentrations. Instead, the neural retina alterations may appear in early phase of diabetes since hyperglycemia increases metabolic activity of the neural retina by making it more susceptible to oxidative stress and other metabolic alterations. Moreover, high glucose levels induce tissue microenvironment alterations leading to retinal hypoxia and inflammation.
The reactive oxygen species (ROS) elicit the activation of several metabolic pathways involved in DR progression including: the polyol pathway, the advanced glycation end product (AGE) pathway, protein kinase C (PKC) pathway, the hexosamine biosynthesis pathway and mitochondrial dysfunctions (Giacco and
Brownlee, 2010).The increased oxidative stress induces apoptotic cell death.
All neuronal cell types in the retina are susceptible to hyperglycaemia-induced apoptosis. The retinal neurons miss their capacity to adapt to cellular stress, as demonstrated by reduced axonal and dendritic branching, cell loss and consequently retinal layer thinning. Moreover, the early stage of DR is characterized by an imbalance between pro-apoptotic and survival signaling pathways in the neuroretina of diabetic patients.
Inflammation is a non-specific response to injury that triggers the recruitment and
activation of different mediators. The role of inflammation in DR development has
been discovered since diabetic patients, treated with ant-inflammatory drugs, showed a lower incidence of this pathology (Joussen et al., 2002). Moreover, several works have indicated an increased expression levels of pro-inflammatory cytokines,
chemokines and adhesion molecules in vitreous, serum and retina during diabetes. In particular, high levels of interleukin-1β (IL-1β), IL-6, and IL-8 have been found in the vitreous fluid of the diabetic patients and in the retina of rodents (Boss et al., 2017). Among these, IL-1β induced apoptotic cell death of retinal capillary cells via activation of NF-κB, which in turn strengthened the effect of hyperglycaemia by
promoting retinal pericytes loss.
Hypoxia represents another key player acting in combination with hyperglycaemia to accelerate the onset and progression of DR. When capillary closure and nonperfusion become clinically apparent, the inner retinal tissue is hypoxic as shown in cats, primates or humans (Linsenmeier et al., 1998).
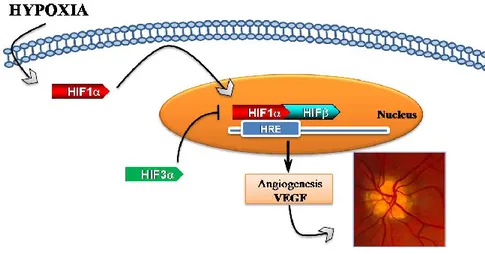
Hypoxic effects are mediated by hypoxia-inducible factors (HIFs), which are heterodimeric compounds consisting in α oxygen-dependent subunits (1α, HIF-2α and HIF-3α) and a constitutively expressed β subunit (Jiang et al., 1996; Makino et al., 2002; Maynard et al., 2007). Among these, HIF-1α is the key modulator of cellular response to low oxygen tension. On contrary, HIF-3α subunit acts as a negative regulator of the hypoxic response by reducing, in opposition, HIF-1α/2α overexpression (Maynard et al., 2007). These factors induce the activation of hypoxia responsive elements (HREs), such as many cytokines and growth factors including the vascular endothelial growth factor (VEGF) (Figure 2). This latter is the major angiogenic factor, playing a crucial role in normal and pathological
angiogenesis. VEGF, synthesized by numerous retinal cells including RPE cells,
pericytes, endothelial cells, glial cells, Müller cells, and ganglion cells, explicates its functions through the activation of VEGF 1 (VEGFR-1 or Flt-1) or 2 (VEGFR-2 or KDR/Flk-1) receptors. VEGF exerts a prominent role in the development of proliferative DR as well as in DME. Indeed, VEGF-induced breakdown of the BRB
Figure 2. Schematic representation of hypoxia-signaling cascade involved in DR progression. During low oxygen tension levels, HIF-1α translocates to the nucleus, dimerizes with HIF-1β and through hypoxia-response element (HRE) it induces VEGF transcription, stimulating neovascularization.
PACAP AND VIP IN DIABETIC RETINOPATHY
Pituitary adenylate cyclase-activating polypeptide (PACAP) and vasoactive intestinal peptide (VIP) are two structurally related neuropeptides that mediate different biological processes in the peripheral and central nervous system, acting either as neurotransmitters or neuromodulators.
PACAP has two isoforms, PACAP27 and PACAP38, containing 27 and 38 amino acids, respectively. PACAP and VIP perform their role through activation of three different G-protein coupled receptors known as PAC1, VPAC1 and VPAC2. Among these, PAC1 binds PACAP with high affinity, whereas VPAC1 or VPAC2 receptors recognize PACAP and VIP with similar affinities (Arimura and Shioda, 1995). PAC1 stimulation is associated to different signal transduction pathways, resulting among other in the activation of protein kinase A (PKA) or phospholipase C (PLC). VPAC1 and VPAC2 receptors are mainly coupled to the G-protein Gs and stimulate cellular adenylyl cyclase activity (Laburthe et al., 2002).
Different studies have described the presence of PACAP, VIP and their receptors in the retina. In particular, immunohistochemical studies have shown that PACAP is present in the nerve fiber layer (NFL), the ganglion cell layer (GCL), and the inner plexiform layer (IPL). In particular, PACAP and VIP immunoreactivity has been found to be positive in neuronal cell bodies of amacrine and horizontal cells localized
in the inner nuclear layer (INL). Instead,no PACAP immunopositivity has been ever
established in rods and cones (photoreceptors) of the outer nuclear layer (ONL) or in neighboring retinal pigmented epithelium it has not been found in photoreceptors in the outer nuclear layer (ONL) or RPE (D’Agata and Cavallaro 1998; Seki et al. 2000).
photoreceptors layer (Seki et al. 1997, 2000b). In particular, PAC1 receptor has been described in the cell bodies and processes of ganglion, amacrine cells and Muller glial cells (Seki et al. 1997).
Figure 3. Schematic representation of PACAP and PAC1 receptor distributions in the rodent retina. Black color indicates PACAP or PAC1R-expressing cells. Figure from Nakamachi et al., (2012).
It is widely demonstrated that PACAP and VIP exert neuroprotective effects in different retinal injuries both in vitro and in vivo models.
Indeed, PACAP has shown to protects the retina against glutamate and kainate toxicity, and optic nerve transection (Racz et al., 2006 a and b). Moreover, PACAP has shown to preserve human retinal pigment epithelial cells against oxidative stress (Mester et al., 2011).
Recently, our research group has demonstrated an overexpression of PACAP, VIP, VPAC type receptors, but not of PAC1 receptor in diabetic rat retina after 1 week STZ injection. Instead, their levels were downregulated after 3 weeks of diabetes (Table 1). This result has suggested the involvement of these peptides in early response to hyperglycaemic insult (Giunta et al., 2012).
Table 1. Analysis of PACAP/VIP peptides and related receptors mRNA levels in rat retinas after 1 and 3 weeks streptozotocin treatment. Table from Giunta et al., (2012).
In the same study, it has also been showed that PACAP intravitreal treatment downregulated the expression of proapoptotic genes indicating a key role of this peptide to counteract apoptotic process.
In accord, several studies have shown that PACAP administration markedly mitigated diabetic retinal injury by increasing the levels of the antiapoptotic p-Akt, pERK1, p-ERK2, PKC, and Bcl-2 signalling, while downregulating the expression of the proapoptotic p-p38MAPK pathway (Somogyvári-Vigh et al., 2004; Seaborn et al., 2011; Szabadfi et al., 2014).
Moreover, Atlasz et al., (2010) have demonstrated that PACAP prevented the dopaminergic amacrine cells degeneration induced in 1-month diabetes. In accord, PACAP and VIP treatment counteracted the early signs in a rat model of streptozotocin-induced DR including the decrease in the number of ganglion cells and the upregulation of GFAP as a sign of Müller glial cell activation (Szabadfi et al. 2012).
hyperglycemia/hypoxia/inflammation in an in vivo and in vitro model of DR.
The main aims addressed in the papers published during the doctoral work and included in the present thesis comprise:
AIM I
To investigate whether the protective effect of PACAP in the early stages of hyperglycaemia is mediated through the modulation of hypoxic process.
AIM II
To establish, whether retinoprotective role of PACAP is also linked to modulation of inflammatory process in DR.
AIM III
To assess the role of PACAP and VIP on permeability and inhibition of hyperglycemia/hypoxia-induced apoptosis of outer BRB.
AIM IV
To characterize the molecular mechanism played by PACAP and VIP against hyperglycemic/hypoxic insult, by analyzing their effect on HIFs, VEGF and activation of pro-apoptotic pathway p38 MAPK.
CHAPTER
2
PACAP Modulates Expression of Hypoxia-Inducible Factors in Streptozotocin Induced Diabetic Rat Retina
FACTORS IN STREPTOZOTOCIN-INDUCED DIABETIC RAT RETINA
Agata Grazia D’Amicoa, Grazia Maugeria, Rita Reitanoa, Claudio Bucolob, Salvatore Sacconec, Filippo Dragob and Velia D’Agataa
aSection of Human Anatomy and Histology and bSection of Pharmacology
Department of Biomedical and Biotechnological Sciences, University of Catania;
cSection of Animal Biology, Department of Biological, Geological and
Environmental Sciences, University of Catania
*Corresponding Author: Velia D’Agata, M.D. Ph.D. Biomedical and Biotechnological Science Section of Anatomy and Histology, University of Catania
Via S.Sofia, 87 95123 Catania Tel:+39-095-3782147 Fax: +39-095-3782046
e-mail: [email protected]
Abstract
Retinal hypoxia has been related to the pathogenesis of diabetic retinopathy. This event is mediated by the Hypoxia Inducible Factors (HIFs), including 1α, HIF-2α and HIF-3α. Previously, we have demonstrated the protective role of pituitary adenylate cyclase-activating peptide (PACAP) in early phase of diabetic retinopathy. In the present work, we investigated whether PACAP effect in hyperglycemic retina is mediated through modulation of HIFs expression. Diabetes was induced with a single injection of streptozotocin (STZ) in rats. After one week, a group of diabetic animals was treated with a single intravitreal injection of 100 µM PACAP or saline
solution. Then, changes in HIFs expression levels were evaluated in the retina after 3 weeks of hyperglycemia. The expression of HIF-1α and HIF-2α was significantly (p<0.001 vs control) increased in diabetic rats as compared to controls. Instead, their expression levels were significantly (p<0.001 vs STZ) decreased after PACAP intraocular administration, as detected by western blot analysis. Conversely, the expression of HIF-3α was significantly (p<0.001 vs control) downregulated in retinas of STZ-injected rats and significantly (p<0.001 vs control) increased after PACAP treatment. These data were supported by the immunohistochemical analysis. HIFs were localized either in inner and outer retinal layers. Diabetes interferes with their distribution, which is changed following intravitreal injection of PACAP. The present results suggest that the protective effect of the peptide in diabetic retina might be also mediated through modulation of HIFs expression.
Keywords: Diabetic retinopathy; PACAP; Hypoxia Inducible Factors, STZ-injected rats.
Introduction
Diabetic retinopathy (DR) is a microvascular complication of diabetes leading to blindness (Saydah et al., 2004; Hoerger et al., 2008). Hypoxia is one of the major events involved in the progression of this pathology and hypoxia inducible factors (HIFs) are the principal regulators of hypoxic process (Wang et al., 1995; Semenza et al., 1999; Lin et al., 2011; Wright et al., 2011).
HIFs are heterodimeric transcription factors composed of α oxygen-related subunit (HIFα), including HIF-1α or HIF-2α, and an aryl hydrocarbon receptor nuclear translocator (ARNT) subunit, also known as HIF-1β, constitutively expressed independently to the presence of oxygen (Jiang et al., 1996; Maynard et al., 2004).
these factors labile to the oxygen through ubiquitin proteasome pathway (Maynard et al., 2005; 2007). Under hypoxic condition, the HIFα subunits escape to the degradation by ubiquitin proteasome system, translocate into the nucleus and dimerize with β subunit. These complexes are able to bind hypoxia response elements (HREs) and induce the expression of many genes involved in different cellular mechanisms (Semenza et al., 1996; Kaelin et al., 2008; Elvidge et al., 2006; Scheurer et al., 2004). A third member of HIFα family, also known as HIF-3α, was identified by Gu et al., (1998). It has structural similarity with other HIF-α subunits but lacks of CTAD domain. It has been demonstrated that a human HIF-3α subunit is a negative modulator of both HIF-1α and HIF-2α expression, impairing their binding to HREs (Makino et al., 2002; Maynard et al., 2005; 2007). In particular, it has been showed that HIF-3α interacts with HIF-1α/ARNT complex leading to inhibition of its activity (Maynard et al., 2005). Furthermore, it competes with HIF-1α and HIF-2α for ARNT recruitment by suppressing their ability to modulate gene expression (Gu et al., 1998; Hara et al. 2001).
Many studies, both in vitro and in vivo, have demonstrated the involvement of such HIFs subunits in DR, such as HIF-1α and HIF-2α (Xiao et al., 2006; Ly et al., 2011; Li et al., 2012; Yan et al., 2012; Yan et al., 2014). In particular, some growth factors implicated in the pathogenesis of this disease are regulated by HIF-1α. Among these, the most studied is the vascular endothelial growth factor (VEGF), which is a regulator of intraocular vascularization and therefore it is involved in the proliferative retinopathy (Duh et al., 1999; Treins et al., 2005). However, to date anti-VEGF therapy has demonstrated its efficacy to counteract ocular
neovascularization only in 50% of treated patients, suggesting that other pathogenic factors may play an important role in non-responders (Lin et al., 2011; Rey et al., 2010; Brown et al., 2007). Therefore, the identification of other factors that regulate upstream HIF-1α expression could be more effective in preventing angiogenesis. Considerable amounts of studies have focused on role of human retinal peptides in the pathophysiology of DR (D’Agata and Cavallaro, 1998; Giunta et al., 2012; Scuderi et al., 2013, Seki et al., 2008; Danyadi et al., 2014). Among these, pituitary adenylate cyclase-activating peptide (PACAP) has been identified as a possible candidate with therapeutic potential in treatment of this pathology (Gábriel, 2013). PACAP belongs to the vasoactive intestinal polypeptide (VIP)/secretin/glucagon peptide superfamily members. It plays different biological functions through interaction with two different receptor subtypes: PAC1 and VPAC, including VPAC1 and VPAC2 receptors (Arimura et al., 1995; Arimura, 1998; Zhou et al., 2002). It is widely demonstrated that PACAP exerts neuroprotective effect in different retinal injuries, including DR (Nakamachi et al., 2012; Szabadfi et al., 2012; Szabadfi et al., 2014). In particular, our previous study has demonstrated that expression of this peptide and its related receptors changes in rat retinas after 3 weeks of STZ injection, furthermore protective effect of PACAP38 intraocular administration has been also demonstrated at this time point (Giunta et al., 2012). On the other hand, many studies have described different biological changes during early phase of hyperglycemia. In particular, it was identified constriction of retinal arterioles and significant reduction in retinal blood flow after 3 weeks onset of diabetes (Lee et al., 2008). These alterations have been also associated to changes in HIFs expression (Wright et al., 2010; 2011). Therefore, in the present work, we investigated whether the retinoprotective effect of the PACAP is mediated through
Materials and Methods Animals
Male Sprague-Dawley rats, three months old, weighing approximately 200g each, obtained from Charles River (Calco, Italy) were used for the present study. All the animals were treated according to the Association for Research in Vision and Ophthalmology (ARVO) Statement for the Use of Animals in Ophthalmic and Vision Research. The animals were fed with standard laboratory chow and were allowed free access to water in an air–conditioned room with a 12 h light/12 h dark cycle. Final group sizes for all measurements were n = 6-9.
Induction of Diabetes
Diabetes was induced with a single intraperitoneal injection of streptozotocin (STZ) (Sigma-Aldrich, St. Louis, MO, USA) as previously described (Bucolo et al., 2012). Briefly, after twelve hours of fasting, a group of animals received a single injection of STZ (60 mg/kg body weight) in 10mM sodium citrate buffer, pH 4.5 (1mL/kg dose/volume). Nondiabetic animals were fasted and received citrate buffer alone. Twenty-four hours post STZ injection blood glucose levels was measured and rats showing blood glucose levels greater than 250 mg/dL were considered as diabetic and selected for the study. We monitored throughout the study the diabetic state by evaluating glycemia daily using a blood glucose meter (Accu–CheckActive; Roche Diagnostic, Milan, Italy) and by the weight loss. All experiments were performed three weeks after the induction of diabetes. For subsequent experiments, rats were killed with a lethal intraperitoneal (i.p.) dose of sodium pentobarbital. Retinas were
immediately removed and homogenized in ice-cold buffer for Western blot analysis and others were fixed in 4% paraformaldehyde for immunofluorescence analysis. 2.3 Intravitreal administration of PACAP38
A single intraocular injection of 100 µM PACAP38 (Sigma-Aldrich) dissolved in PBS solution (final volume = 4 µL) was administered 1 week after intraperitoneal injection of STZ or sodium citrate buffer under general anesthesia with diethylether and topical anesthesia with a drop of 2% lidocaine applied to the eyes. PACAP38 was injected into the vitreous space of one eye chosen at random. An equal volume of vehicle (PBS) was injected in the other eye as control. Retinas were dissected 2 weeks after the intraocular injection.
Western Blot Analysis
Western blot analysis was performed to determine the expression levels of HIFs. Analysis was performed as previously described by D’Amico et al. (2014). Briefly, proteins were extracted with buffer containing 20 mM Tris (pH 7.4), 2 mM EDTA, 0.5 mM EGTA; 50 mM mercaptoethanol, 0.32 mM sucrose and a protease inhibitor cocktail (Roche Diagnostics) using a Teflon-glass homogenizer and then sonicated twice for 20 sec using an ultrasonic probe, followed by centrifugation at 10.000 g for 10 min at 4 °C. Protein concentrations were determined by the Quant-iT Protein Assay Kit (Invitrogen). Sample proteins (20 μg) were diluted in 2X Laemmli buffer (Invitrogen, Carlsbad, CA, USA), heated at 70°C for 10 min and then separated on a Biorad Criterion XT 4-15% Bis-tris gel (BIO-RAD) by electrophoresis and then transferred to a nitrocellulose membrane (BIO-RAD). Blots were blocked using the Odyssey Blocking Buffer (LI-COR Biosciences) and probed with appropriate antibodies: mouse anti-HIF-1α (NB 100-105, 1:500), mouse anti-Arnt1 (A-3) (sc-17811, Santa Cruz Biotechnology; 1:200), rabbit anti-HIF-2α (NB 100-122, 1:500),
Biosciences) and goat anti-mouse IRDye 680CW, (#926-68020D; LI-COR Biosciences) were used at 1:20000. Blots were scanned with an Odissey Infrared Imaging System (Odyssey). Densitometric analyses of signals were performed at non-saturating exposures and analyzed using the ImageJ software (NIH, Bethesda, MD; available at http://rsb.info.nih.gov/ij/index.html). Values were normalized to β-tubulin, which was used as loading control. No signal was detected when the primary antibody was omitted (data not shown).
Immunolocalization
Eyes were enucleated and fixed overnight with 4% paraformaldehyde in 0.1 M sodium phosphate (pH 7.6). Analyses was performed on whole retina, as previously described by Scuderi et al., (2015). Before immunofluorescence staining, paraffin-embedded retinas sections (6 µm) mounted on glass slides, were dewaxed in xylene and rehydrated through graded alcohols. Sections were put into Rodent Decloaker 1X retrieval solution (RD913, BIO-CARE MEDICAL) in a slide container and then incubated with the anti-HIF-1α, HIF-2α and HIF-3α primary antibodies. To establish signal specificity, in a preliminary experiment, each antibody was pre-incubated with an excess of antigen (blocking peptide). No signal was revealed in sections incubated with neutralized antibody. This confirmed that signal detected by each antibody was not an artifact (data not shown). Tissue sections were then incubated with Alexa fluor 488 goat anti-rabbit and Alexa fluor 594 goat anti-mouse secondary antibodies, respectively for 1h at room temperature and shielded from light. DAPI (diamidino-2-phenylindole) was used to stain nuclei (#940110 Vector Laboratories).
Images were taken with a confocal laser scanning microscope (CLSM) (Zeiss LSM700 as previously described (D'Amico et al., 2013). To compare similar regions of different groups, we analyzed, in each section, area close to the central retina (i.e. fovea centralis). Experiments were repeated at least three times to confirm results.
Statistical Analysis
Data are reported as Mean ± S.E.M. One-way analysis of variance (ANOVA) was used to compare differences among groups, and statistical significance was assessed by the Tukey–Kramer post hoc test. The level of significance for all statistical tests was p≤0.05.
Results
The effect of PACAP on HIFs expression in diabetic retina.
The effect of PACAP on HIFs expression in hyperglycemic retina has been assessed by using western blot analysis. As shown in Figure 1 (A and B) hyperglycemia increases HIF-1α expression as compared to control animals (***p<0.001 vs control). Intraocular administration of PACAP significantly reduces HIF-1α levels in hyperglycemic retinas as compared to STZ injected rats (Figure 1 A and B, ###p<0.001 vs STZ), whereas it does not affect HIF-1α levels in control group. As predicted, ARNT expression is unchanged in all groups (Figure 1 A and C). The expression levels of HIF-2α are increased in diabetic rats as compared to control (Figure 2 A and B, ***p<0.001 vs control), whereas PACAP treatment reduces its levels in both control and diabetic animals, suggesting that expression of this hypoxic
factor is affected by the peptide independently by hyperglycemia.This condition also
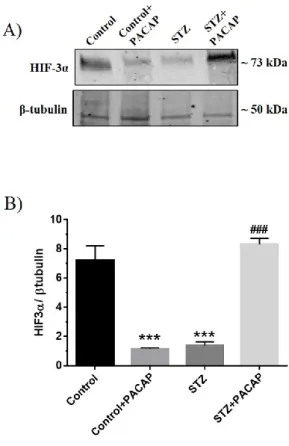
affects HIF-3α protein expression, which is significantly lower in diabetic rat retinas when compared to the untreated group (Fig. 3a, b, ***p<0.001 vs control), whereas
expression also in control retinas (Fig. 3a, b, ***p<0.001 vs control).
Fig. 1 Effect of PACAP38 intravitreal injection on HIF-1α and ARNT expression in the retina of STZ-injected rats. (A) Representative immunoblot of signals detected by HIF-1α and ARNT antibody, obtained using 20µg of tissue homogenates from retinas of both non diabetic (Control) and diabetic (STZ) rats intravitreally injected with PACAP38. (B-C) The bar graphs show the results of three independent experiments. Relative band densities were quantified by using ImageJ software. Protein levels are expressed as arbitrary units obtained after normalization to β-tubulin, which was used as loading control. Data are expressed as Mean ± SEM ***p<0.001 vs control group, ###p<0.001 vs STZ-injected animals, as determined by One-Way ANOVA followed by Tukey post-ho
Fig. 2 Effect of PACAP38 intravitreal injection on HIF-2α expression in the retina of STZ-injected rats. (A) Representative immunoblot of signals detected by HIF-2α antibody, obtained using 20µg of tissue homogenates from retinas of both non diabetic (Control) and diabetic (STZ) rats intravitreally injected with PACAP38. (B-C) The bar graphs show the results of three independent experiments. Relative band densities were quantified by using ImageJ software. Protein levels are expressed as arbitrary units obtained after normalization to β-tubulin, which was used as loading control. Data are expressed as Mean ± SEM ***p<0.001 vs control group, ###p<0.001 vs STZ-injected animals, as
Fig. 3 Effect of PACAP38 intravitreal injection on HIF-3α expression in the retina of STZ-injected rats. (A) Representative immunoblot of signals detected by HIF-3α antibody, obtained using 20µg of tissue homogenates from retinas of both non diabetic (control) and diabetic (STZ) rats intravitreally injected with PACAP38. (B-C) The bar graphs show the results of three independent experiments. Relative band densities were quantified by using ImageJ software. Protein levels are expressed as arbitrary units obtained after normalization to β-tubulin, which was used as loading control. Data are expressed as Mean ± SEM ***p<0.001 vs control group, ###p<0.001 vs STZ-injected animals, as determined by One-Way ANOVA followed by Tukey post-hoc test.
Distribution of HIFs in diabetic retinas after PACAP treatment.
Based on the results obtained from protein expression analysis, we further investigated whether PACAP treatment influences retinal distribution of HIFs in hyperglycemic rats. To detect localization of HIF-1α, HIF-2α and HIF-3α in the retinal layers of diabetic and PACAP treated rats, we performed immunofluorescence analysis.
According with previous papers (Wright et al., 2011), HIF-1α is localized in the inner nuclear layer (INL), outer plexiform layer (OPL) and in photoreceptor layer (also known as rods and cones layer, RCL) both in control (Figure 4, A, A’, A’’) and diabetic group (Figure 4, B, B’, B’’). Diabetes induction increases HIF-1α fluorescence signal detected in INL and in RCL as compared to control rats (Figure 4, B, B’, B’’). However, PACAP treatment reduces its signal intensity (Figure 4, C, C’, C’’).
As showed in Figure 5, HIF-2α is weakly expressed in RCL and ganglion cell layer (GCL) of controls (Figure 5, A, A’, A’’), whereas in diabetic rats the intensity of its signals increases and is also visualized in INL and outer plexiform layer (OPL) (Figure 5 B, B’, B’’). PACAP administration reduces its expression (Figure 5, C, C’, C’’).
The HIF-3α is distributed in all retinal layers of control animals (Figure 6, A, A’, A’’), whereas hyperglycemia reduces its expression (Figure 6 B, B’, B’’). However, intravitreal PACAP treatment restores HIF-3α distribution to the control and increases its intensity as compared to STZ treated group (Figure 6, C, C’, C’’).
Fig. 4 Retinal distribution of HIF-1α in control and diabetic rat after PACAP treatment. Representative photomicrographs showing distribution of HIF-1α in the retinal layers of control (A, A’, A”), diabetic (B, B’, B”) and PACAP intravitreally injected diabetic rats (C, C’, C”). HIF-1α was detected using a mouse HIF-1α primary antibody and revealed with Alexa fluor 594 goat anti-mouse secondary antibodies (red fluorescence) (A, B, C). Cell nuclei were stained with DAPI (blue fluorescence) (A’, B’, C’). A”, B”, C” are merged images. Photomicrographs shown are representative results taken from different fields from randomly selected slides and scanned by CLSM. Retinal layers are indicated, on the left of the Figure, as follows: photoreceptors layer (also known as rods and cones layer, RCL); outer nuclear layer (ONL); outer plexiform layer (OPL); inner nuclear layer (INL); inner plexiform layer (IPL); ganglion cell layer (CGL). Scale bar (20µm).
Fig. 5 Distribution of HIF-2α in the normal and diabetic rat retina after PACAP treatment.
Representative photomicrographs showing distribution of HIF-2α in the retinal layers of control (A, A’, A”), diabetic (B, B’, B”) and PACAP intravitreally injected diabetic rats (C, C’, C”). HIF-2α was detected using a rabbit HIF-2α primary antibody revealed with Alexa Fluor 488 mouse antigoat secondary antibodies (green fluorescence) (A, B, C). Cell nuclei were stained with DAPI (blue fluorescence) (A’, B’, C’). A”, B”, C” are merged images. Photomicrographs shown are representative results taken from different fields from randomly selected slides and scanned by CLSM. Retinal layers are indicated, on the left of the Figure, as follows: photoreceptors layer (also known as rods and cones layer, RCL); outer nuclear layer (ONL); outer plexiform layer (OPL); inner nuclear layer (INL); inner plexiform layer (IPL); ganglion cell layer (CGL). Scale bar (20µm).
Fig. 6 Distribution of HIF-3α in the normal and diabetic rat retina after PACAP treatment.
Representative photomicrographs showing distribution of HIF-3α in the retinal layers of control (A, A’, A”), diabetic (B, B’, B”) and PACAP intravitreally injected diabetic rats (C, C’, C”). HIF-3α was detected using a rabbit HIF-3α primary antibody revealed with Alexa Fluor 488 mouse antigoat secondary antibodies (green fluorescence) (A, B, C). Cell nuclei were stained with DAPI (blue fluorescence) (A’, B’, C’). A”, B”, C” are merged images. Photomicrographs shown are representative results taken from different fields from randomly selected slides and scanned by CLSM. Retinal layers are indicated, on the left of the Figure, as follows: photoreceptors layer (also known as rods and cones layer, RCL); outer nuclear layer (ONL); outer plexiform layer (OPL); inner nuclear layer (INL); inner plexiform layer (IPL); ganglion cell layer (CGL). Scale bar (20µm).
Discussion
The results of the present study have demonstrated that PACAP abrogates the over-expression of HIF-1α and HIF-2α and enhances HIF-3α over-expression in diabetic rat retina. These findings suggested that PACAP is able to modulate the hypoxic process opening new therapeutic perspectives to DR treatment.
A considerable number of studies have demonstrated that PACAP plays neuroprotective effect in different pathological conditions, including DR (Castorina et al., 2008; 2010; 2012, 2014; Atlasz et al., 2010). The pathogenesis of this disease is characterized by ischemic and metabolic changes that cause damage to endothelial cells and blood vessels with subsequent alteration in blood flow and microcirculatory damage (Aiello et al., 1998). This vascular complication leads to tissue hypoxia, with subsequent alteration of the expression of growth and transcription factors (Seki et al., 2004).
It has been widely demonstrated that PACAP treatment is able to counteract some pathological alterations that occur during retinal injuries. Indeed, it induces a slight improvement of retinal morphology during glutamate-induced damage, inhibits activation of pro-apoptotic pathway through downregulation of p53 expression and upregulation of Bcl2 level in diabetic rats and reduces loss of the GCL in rat retinas in early stage of hyperglycemia (Kiss et al., 2006; Atlasz et al., 2008; Giunta et al., 2012; Szabadfi et al 2012).
In line with these findings, for the first time, in this work we have shown that PACAP is able to downregulate retinal expression of HIF-1α and HIF-2α, already three weeks after administration of STZ. These factors, activated consequently to the reduction of oxygen tension, promote the transcription of growth factors leading to neovascularization typical of DR. Indeed, in agreement with previous studies, we observed an increased expression of these two factors in retinas of diabetic rats.
peptide is administered in control animals. Instead, its effect on the modulation of HIF-2α expression seems to be hyperglycemia-independent.
In the present work, we also provide data on the HIF-3α expression in retinas during the early stages of hyperglycemia. It is expressed in control retinas, as opposed to the low levels of HIF-1α and HIF-2α. Conversely, three weeks after STZ administration, the HIF-3α is significantly reduced, simultaneously with increase of the other two hypoxic factors analyzed. This confirms that it is a negative modulator of HIF-1α and HIF-2α, inasmuch its expression is inversely related to the levels of other two factors (Makino et al., 2002; Maynard 2007; Yang et al., 2015).
The mechanism responsible for this effect in control animals is unclear and requires further study. However, it is relevant the up-regulation of HIF-3α induced by the peptide in diabetic rats. We hypothesized that modulatory action of PACAP on hypoxic event hyperglycemia-linked might be mediated both through a direct mechanism acting on HIF-1α expression and, indirectly, through the regulation of HIF-3α, which in turn down-regulates HIF-1α levels (Zhang et al., 2014).
Our data were also confirmed by analyzing of HIFs distribution in the different retinal layers. We observed that HIF-1α and HIF-2α are distributed in INL in normal condition, whereas HIF-2α expression increases in GCL, INL and OPL three weeks after STZ treatment (Poulaki et al., 2004; Wright et al 2010; Wright et al 2011). In this study, we demonstrated, for the first time, that STZ injection decreases retinal distribution of HIF-3α as compared to control animals. Furthermore, we provide the first evidence on the ability of PACAP to interfere with retinal distribution of HIFs.
Indeed, following peptide injection, HIF-1α and HIF-2α expression decreases in some retinal layers, whereas, HIF-3α expression is restored to the control value confirming the evidence that it acts as negative modulator of HIF-1α and HIF-2α. It has been previously shown the existence of direct correlation between HIF-1α and PACAP expression. Indeed HIF-1α binds to HRE domain of PACAP promoter, inducing increased expression of this peptide during cerebral ischemia (Lin et al., 2015). Through this mechanism PACAP protects neurons from degeneration in the penumbra area of stroke. Moreover, according with our data, Fabian and coworkers (2012) showed a relationship between PACAP treatment and the reduction of HIF-1α expression in an in vitro model of in human pigment epithelial cells exposed to oxidative stress.
In line with these evidences, we suggested that retinoprotective effect of PACAP could be mediated through inhibition of HIF-1α and HIF-2α, through HIF-3α activation, which competes with the other two hypoxic factors, inhibiting indirectly the transcription of genes involved in uncontrolled vascularization typical of DR. Therefore, these results suggest a possible action mechanism of PACAP as modulator of events triggered by low tissue oxygen tension.
Our study was limited only to early stages of hyperglycemia, however in order to further clarify the role of PACAP in the hypoxic process of the DR, further studies should be carried out by using an in vivo models of longer lasting hyperglycemia.
Conclusion
In conclusion, our data have demonstrated that PACAP affects hypoxic process by modulating HIF-1α, HIF-2α and HIF-3α expression and distribution in diabetic rat retina. This evidence might open new therapeutic perspectives to DR treatment.
(PACAP) in the neuroendocrine, endocrine, and nervous systems. Jpn J Physiol 48(5):301-31.
Arimura A and Shioda S (1995) Pituitary adenylate cyclase activating polypeptide (PACAP) and its receptors: neuroendocrine and endocrine interaction. Front Neuroendocrinol 16(1):53-88.
Atlasz T, Szabadfi K, Kiss P et al (2008) PACAP-mediated neuroprotection of neurochemically identified cell types in MSG-induced retinal degeneration. J Mol Neurosci 36(1-3):97-104.
Atlasz T, Szabadfi K, Kiss P et al (2010) Pituitary adenylate cyclase activating polypeptide in the retina: focus on the retinoprotective effects. Ann N Y Acad Sci 1200:128-39.
Brown DM, Kaiser PK, Michels M et al (2006) Ranibizumab versus verteporfin for neovascular age-related macular degeneration. N Engl J Med 355(14):1432-44. Bucolo C, Leggio GM, Drago F, Salomone S (2012) Eriodictyol prevents early retinal and plasma abnormalities in streptozotocin-induced diabetic rats. Biochem Pharmacol 84(1):88–92.
Castorina A, Giunta S, Mazzone V, Cardile V, D'Agata V (2010) Effects of PACAP and VIP on hyperglycemia-induced proliferation in murine microvascular endothelial cells. Peptides 31(12):2276-83.
Castorina A, Giunta S, Scuderi S, D'Agata V (2012) Involvement of PACAP/ADNP signaling in the resistance to cell death in malignant peripheral nerve sheath tumor (MPNST) cells. J Mol Neurosci 48(3):674-83.
Castorina A, Scuderi S, D'Amico AG, Drago F, D'Agata V (2014) PACAP and VIP increase the expression of myelin-related proteins in rat schwannoma cells: involvement of PAC1/VPAC2 receptor-mediated activation of PI3K/Akt signaling pathways. Exp Cell Res 322(1):108-21.
Castorina A, Tiralongo A, Giunta S, Carnazza ML, Rasi G, D'Agata V (2008) PACAP and VIP prevent apoptosis in schwannoma cells. Brain Res 1241:29-35. D’Agata V and Cavallaro S (1998) Functional and molecular expression of PACAP/VIP receptors in the rat retina. Molecolar Brain Research 54(1): 161-164.
D'Amico AG, Scuderi S, Maugeri G, Cavallaro S, Drago F, D'Agata V (2014) NAP reduces murine microvascular endothelial cells proliferation induced by hyperglycemia. J Mol Neurosci 54(3):405-13.
D'Amico AG, Scuderi S, Saccone S, Castorina A, Drago F, D'Agata V (2013) Antiproliferative effects of PACAP and VIP in serum-starved glioma cells. J Mol Neurosci 51(2):503-13.
Danyadi B, Szabadfi K, Reglodi D et al (2014) PACAP application improves functional outcome of chronic retinal ischemic injury in rats-evidence from electroretinographic measurements. J Mol Neurosci 54(3):293-9.
Duh E and Aiello LP (1999) Vascular endothelial growth factor and diabetes: the agonist versus antagonist paradox. Diabetes 48(10):1899-906.
Elvidge GP, Glenny L, Appelhoff RJ, Ratcliffe PJ, Ragoussis J, Gleadle JM (2006) Concordant regulation of gene expression by hypoxia and 2-oxoglutarate-dependent dioxygenase inhibition: the role of HIF-1alpha, HIF-2alpha, and other pathways. J Biol Chem 281:15215–15226.
Fabian E, Reglodi D, Mester L et al (2012) Effects of PACAP on intracellular signaling pathways in human retinal pigment epithelial cells exposed to oxidative stress. J Mol Neurosci 48(3):493-500.
Gábriel R (2013) Neuropeptides and diabetic retinopathy. Br J Clin Pharmacol 75(5):1189-201.
Giunta S, Castorina A, Bucolo C, Magro G, Drago F, D'Agata V (2012) Early changes in pituitary adenylate cyclase-activating peptide, vasoactive intestinal peptide and related receptors expression in retina of streptozotocin-induced diabetic rats. Peptides 37(1):32-9.
Gu YZ, Moran SM, Hogenesch JB, Wartman L, Bradfield CA (1998) Molecular characterization and chromosomal localization of a third alpha-class hypoxia inducible factor subunit, HIF3alpha. Gene Expr 7(3):205-13.
Hara S, Hamada J, Kobayashi C, Kondo Y, Imura N (2001) Expression and characterization of hypoxia-inducible factor (HIF)-3alpha in human kidney: suppression of HIF-mediated gene expression by HIF-3alpha. Biochem Biophys Res Commun 287(4):808-13.
Hoerger TJ, Segel JE, Gregg EW, Saaddine JB (2008) Is glycemic control improving in U.S. adults? Diabetes Care 31(1):81–86.
the HIF hydroxylase pathway. Mol Cell 30(4):393-402.
Kiss P, Tamás A, Lubics A et al (2006) Effects of systemic PACAP treatment in monosodium glutamate-induced behavioral changes and retinal degeneration. Ann N Y Acad Sci. 1070:365-70.
Lee S, Morgan GA, Harris NR (2008) Ozagrel reverses streptozotocin-induced constriction of arterioles in rat retina. Microvasc Res. 76(3):217-23.
Li J, Zhao SZ, Wang PP, Yu SP, Zheng Z, Xu X (2012) Calcium mediates high glucose-induced HIF-1α and VEGF expression in cultured rat retinal Müller cells through CaMKII-CREB pathway. Acta Pharmacol Sin 33(8):1030-6.
Lin CH, Chiu L, Lee HT et al (2015) PACAP38/PAC1 signaling induces bone marrow-derived cells homing to ischemic brain. Stem Cells 33(4):1153-72.
Lin M, Chen Y, Jin J, Hu Y et al (2011) Ischaemia-induced retinal neovascularisation and diabetic retinopathy in mice with conditional knockout of hypoxia-inducible factor-1 in retinal Müller cells. Diabetologia 54(6):1554-66. Ly A, Yee P, Vessey KA, Phipps JA, Jobling AI, Fletcher EL (2011) Early inner retinal astrocyte dysfunction during diabetes and development of hypoxia, retinal stress, and neuronal functional loss. Invest Ophthalmol Vis Sci 52(13):9316-26. Makino Y, Kanopka A, Wilson WJ, Tanaka H, Poellinger L (2002) Inhibitory PAS domain protein (IPAS) is a inducible splicing variant of the hypoxia-inducible factor-3alpha locus. J Biol Chem 277(36):32405-8.
Maynard MA, Evans AJ, Hosomi T, Hara S, Jewett MA, Ohh M (2005) Human HIF-3alpha4 is a dominant-negative regulator of HIF-1 and is down-regulated in renal cell carcinoma. FASEB J 19(11):1396-406.
Maynard MA, Evans AJ, Shi W, Kim WY, Liu FF, Ohh M (2007) Dominant-negative HIF-3 alpha 4 suppresses VHL-null renal cell carcinoma progression. Cell Cycle 6(22):2810-6.
Maynard MA, Ohh M (2004) Von Hippel-Lindau tumor suppressor protein and hypoxia-inducible factor in kidney cancer. Am J Nephrol 24(1):1-13.
Nakamachi T, Matkovits A, Seki T, Shioda S (2012) Distribution and protective function of pituitary adenylate cyclase-activating polypeptide in the retina. Front Endocrinol (Lausanne) 3:145.
Poulaki V, Joussen AM, Mitsiades N, Mitsiades CS, Iliaki EF, Adamis AP (2004) Insulin-like growth factor-I plays a pathogenetic role in diabetic retinopathy. Am J Pathol 165(2):457-69.
Rey S, Semenza GL (2010) Hypoxia-inducible factor-1-dependent mechanisms of vascularization and vascular remodelling. Cardiovasc Res 86(2):236-42.
Saydah SH, Fradkin J, Cowie CC (2004) Poor control of risk factors for vascular disease among adults with previously diagnosed diabetes. JAMA 291(3):335–342. Scheurer SB, Rybak JN, Rosli C, Neri D, Elia G (2004) Modulation of gene expression by hypoxia in human umbilical cord vein endothelial cells: a transcriptomic and proteomic study. Proteomics 4(6):1737-60.
Scuderi S, D'Amico AG, Castorina A, Imbesi R, Carnazza ML, D'Agata V (2013) Ameliorative effect of PACAP and VIP against increased permeability in a model of outer blood retinal barrier dysfunction. Peptides 39:119-24.
Scuderi S, D'Amico AG, Federico C et al (2015) Different Retinal Expression Patterns of IL-1α, IL-1β, and Their Receptors in a Rat Model of Type 1 STZ-Induced Diabetes. J Mol Neurosci 56(2):431-9.
Seki M, Tanaka T, Nawa H et al (2004) Involvement of brain-derived neurotrophic factor in early retinal neuropathy of streptozotocin-induced diabetes in rats: therapeutic potential of brain-derived neurotrophic factor for dopaminergic amacrine cells. Diabetes 53(9):2412-9.
Seki T, Itoh H, Nakamachi T, Shioda S (2008) Suppression of ganglion cell death by PACAP following optic nerve transection in the rat. J Mol Neurosci 36(1-3):57-60. Semenza GL (1999) Regulation of mammalian O2 homeostasis by hypoxia-inducible factor 1. Annu Rev Cell Dev Biol 15: 551–578.
Semenza GL, Jiang BH, Leung SW, Passantino R, Concordet JP, Maire P, Giallongo A (1996) Hypoxia response elements in the aldolase A, enolase 1, and lactate dehydrogenase. A gene promoters contain essential binding sites for hypoxia-inducible factor 1. J Biol Chem 271(51):32529-37.
Szabadfi K, Atlasz T, Kiss P et al (2012) Protective effects of the neuropeptide PACAP in diabetic retinopathy. Cell Tissue Res 348(1):37-46.
HIF hydroxylases in response to insulin-like growth factor I. Mol Endocrinol 19(5):1304-17.
Wang GL, Jiang B, Rue EA, Semenza GL (1995) Hypoxia-Inducible Factor 1 is a Basic-Helix-Loop-Helix-PAS Heterodimer Regulated by Cellular O2 Tension. Proceedings of the National Academy of Sciences 92(12):5510-4.
Wright WS, McElhatten RM, Harris NR (2011) Increase in retinal hypoxia-inducible factor-2α, but not hypoxia, early in the progression of diabetes in the rat. Exp Eye Res 93(4):437-41.
Wright WS, McElhatten RM, Messina JE, Harris NR (2010) Hypoxia and the expression of HIF-1alpha and HIF-2alpha in the retina of streptozotocin-injected mice and rats. Exp Eye Res 90(3):405-12.
Xiao Q, Zeng S, Ling S, Lv M (2006) Upregulation of HIF-1alpha and VEGF expression by elevated glucose concentration and hypoxia in cultured human retinal pigment epithelial cells. J Huazhong Univ Sci Technolog Med Sci 26(4):463-5. Yan HT, Su GF (2014) Expression and significance of HIF-1 α and VEGF in rats with diabetic retinopathy. Asian Pac J Trop Med 7(3):237-40.
Yan JQ, Zhang ZY, Shi HL (2012) HIF-1 is involved in high glucose-induced paracellular permeability of brain endothelial cells. Cell Mol Life Sci 69(1):115-28. Yang SL, Wu C, Xiong ZF, Fang X (2015) Progress on hypoxia-inducible factor-3: Its structure, gene regulation and biological function (Review). Mol Med Rep 12(2):2411-6.
Zhang P, Yao Q, Lu L, Li Y, Chen PJ, Duan C (2014) Hypoxia-inducible factor 3 is an oxygen-dependent transcription activator and regulates a distinct transcriptional response to hypoxia. Cell Rep 6(6):1110-21.
Zhou CJ, Shioda S, Yada T, Inagaki N, Pleasure SJ, Kikuyama S (2002) PACAP and its receptors exert pleiotropic effects in the nervous system by activating multiple signaling pathways. Curr Protein Pept Sci 3(4):423-39.
CHAPTER
3
Modulation of IL-1β and VEGF expression in rat diabetic retinopathy after PACAP administration
RETINOPATHY AFTER PACAP ADMINISTRATION
Agata Grazia D’Amico1,2, Grazia Maugeri2, Daniela Maria Rasà2, Claudio Bucolo3,
Salvatore Saccone4, Concetta Federico4, Cavallaro Sebastiano5 and Velia D’Agata2,*
1San Raffaele Open University of Rome, Italy, Department of Human Science and
Promotion of quality of Life; 2Section of Human Anatomy and Histology and 3Section of Pharmacology, Department of Biomedical and Biotechnological Sciences, University of Catania; 4Section of Animal Biology, Department of Biological, Geological and Environmental Sciences, University of Catania; 5Institute of Neurological Sciences, Italian National Research Council, Catania, Italy.
*Corresponding Author: Velia D’Agata, M.D. Ph.D. Biomedical and Biotechnological Science Section of Anatomy and Histology, University of Catania
Via S.Sofia, 87 95123 Catania Tel:+39-095-3782147 Fax: +39-095-3782046
e-mail: [email protected]
Abstract
Diabetic retinopathy (DR) is a microvascular complication of diabetes. Hyperglycemic/hypoxic microenvironment concurs to aberrant angiogenesis characterizing the pathology and activates many downstream target genes including inflammatory cytokines and vasoactive peptides, such as interleukin-1β (IL-1β) and vascular endothelial growth factor (VEGF).
It has been largely demonstrated that pituitary adenylate cyclase-activating peptide (PACAP) plays a protective effect in DR. In the present study, we investigated the role of PACAP to protect retinal tissue through IL-1β and VEGF expression.
Diabetes was induced in rats by streptozotocin (STZ) injection, and one week later a single intravitreal injection of 100 µM PACAP was administrated. Analyses of IL-1β and VEGF levels were performed three weeks after diabetes induction.
The results demonstrated that a single intraocular administration of PACAP significantly reduced the expression of IL-1β in diabetic animals. Moreover, it affects VEGF and its receptors (VEGFRs) levels and interferes with their retinal layers distribution as showed by confocal microscopy analysis. In particular, PACAP treatment downregulates VEGF and VEGFRs that are increasingly expressed in STZ-treated animals as compared to controls. These results indicate that PACAP plays an important role to attenuate the early phase of DR.
Keywords: Diabetic retinopathy, PACAP, VEGF, Interleukin-1β
Introduction
Diabetic retinopathy (DR) is a common complication of diabetes, leading to vision loss [1]. Hyperglycaemia triggers a sequential cascade of biological events [2-4], among others, the generation of reactive oxygen species (ROS) that causes a severe inflammatory process sustained by vasoactive peptides and inflammatory cytokines release [5, 6]. Retinal vascular permeability impairment is triggered by these factors, including interleukin-1β (IL-1β) [7]. This latter is involved in several ocular pathologies and it is considered a key mediator of retinal damage during early stage of DR [8].
We recently showed the expression profile of IL-1’s family members in streptozotocin (STZ)-induced diabetic rats. We demonstrated that IL-1β plays a key role in the retinal inflammatory process [9]. We also demonstrated, by using an in
neoangiogenesis [11]. Low oxygen tension generates hypoxia inducible factors (HIFs), heterodimeric transcription factors formed by two different subunits: α oxygen-related subunits (HIF-1α, HIF-2α and HIF-3α) and constitutively expressed subunit, HIF-1β [12-14]. Hypoxia promotes HIF-1α and HIF-2α translocation into the nucleus with consequent dimerization with HIF-1β binding to hypoxia response elements (HREs). This latter induces the transcriptional activation of different genes, including vascular endothelial growth factors (VEGF) [15, 16]. Overexpression of HIF-1α during DR is responsible of VEGF upregulation sustaining uncontrolled neovascularization [17-19]. Based on the above considerations, intravitreal injection of agents directed against VEGF represents the elective DR therapy [20]. However this strategy is effective only in some patients, therefore the identification of other factors involved in DR pathogenesis could allow us to select helpful molecules for non-responders’ patients [21]. In particular, compounds counteracting release of vasoactive peptides and inflammatory cytokines could be used to prevent neovascularization.
Several studies investigated the role of pituitary adenylate cyclase-activating peptide (PACAP), vasoactive intestinal polypeptide (VIP) and a small peptide derived from the activity-dependent neuroprotective protein (also known as NAP) in DR [21-26]. PACAP performs a wide array of actions binding two types of G protein coupled receptors: PAC1 and VPAC, including VPAC1 and VPAC2 receptors [27]. The expression of PACAP has been already described in the retina, where it displays a protective role during its degeneration [28, 29]. Recently, Amato et al., (2016) [30] tested its modulatory effect on VEGF release. They demonstrated that the peptide is
able to decrease expression of VEGF after different insults (e.g. high glucose and H2O2) in an in vitro model of DR.
We demonstrated that PACAP interferes with hypoxic event in diabetic retina by modulating HIFs expression [31]. However, we did not figure out whether this effect was releated to VEGF downregulation.
In the present study, we investigated the effects of PACAP to modulate IL-1β, VEGF and related receptors in the retina of diabetic rats.
Materials and Methods Animals
In this study, we have used male Sprague-Dawley rats of three months old, weighing approximately 200g each, obtained from Charles River (Calco, Italy). All the animals were treated according to the Association for Research in Vision and Ophthalmology (ARVO) Statement for the Use of Animals in Ophthalmic and Vision Research. The animals were fed with standard laboratory chow and were allowed free access to water in an air conditioned room with a 12h light/12h dark cycle. Final group sizes for all measurements were n = 6-9.
Induction of Diabetes
Diabetes was induced with a single intraperitoneal injection of streptozotocin (STZ) (Sigma-Aldrich, St. Louis, MO, USA) as previously described [32]. Briefly, after twelve hours of fasting, a group of animals received a single injection of STZ (60 mg/kg body weight) in 10mM sodium citrate buffer, pH 4.5 (1mL/kg dose/volume). Nondiabetic animals were fasted and received citrate buffer alone. Twenty-four hours post STZ injection blood glucose levels were measured and rats showing blood glucose levels greater than 250 mg/dL were considered as diabetic and selected for the study. We monitored throughout the study the diabetic state by evaluating glycaemia daily using a blood glucose meter (Accu–CheckActive; Roche Diagnostic,
immediately collected and homogenized in ice-cold buffer for Western blot analysis and others were fixed in 4% paraformaldehyde for immunofluorescence analysis.
Intravitreal administration of PACAP38
A single intraocular injection of 100 µM PACAP38 (Sigma-Aldrich) dissolved in PBS solution (final volume = 4 µL) was administered one week after intraperitoneal injection of STZ or sodium citrate buffer. Before intravitreal injection, animals were anesthetized by intravenous injection of 5 mg/kg Zoletil (tiletamine HCl and zolazepam HCl, Virbac, Milano, Italy), and 1 drop in the eye of the local anesthetic 0.4% oxybuprocaine (Novesina, Novartis, Origgio, Italy). Same volume of vehicle (PBS) was injected in the other eye as control. Retinal tissues were collected two weeks after the intraocular injection.
Western Blot Analysis
Western blot analysis was performed to determine the relative expression levels of Interleukin 1β (IL-1β), VEGF and its related receptor, by using specific antibodies. Analysis was performed as previously described [33]. Briefly, proteins were extracted with buffer containing 20 mM Tris (pH 7.4), 2 mM EDTA, 0.5 mM EGTA; 50 mM mercaptoethanol, 0.32 mM sucrose and a protease inhibitor cocktail (Roche Diagnostics) using a Teflon-glass homogenizer and then sonicated twice for 20 sec using an ultrasonic probe, followed by centrifugation at 10.000 g for 10 min at 4°C. Protein concentrations were determined by the Quant-iT Protein Assay Kit (Invitrogen). Sample proteins (35 μg) were diluted in 2X Laemmli buffer (Invitrogen, Carlsbad, CA, USA), heated at 70°C for 10 min and then separated on a Biorad Criterion XT 4-15% Bis-tris gel (BIO-RAD) by electrophoresis and then
transferred to a nitrocellulose membrane (BIO-RAD). Blots were blocked using the Odyssey Blocking Buffer (LI-COR Biosciences) and probed with appropriate antibodies: goat VEGF (sc-1836, Santa Cruz Biotechnology; 1:200), mouse anti-VEGF-R1 316, Santa Cruz Biotechnology; 1:200), mouse anti-VEGF-R2 (sc-6251, Santa Cruz Biotechnology; 1:200), goat anti-IL-1β (sc-1250, Santa Cruz Biotechnology; 1:200) and rabbit anti-β-tubulin (sc-9104, Santa Cruz Biotechnology; 1:500).
The secondary antibody donkey anti-goat IRDye 800CW (#926-32211; LI-COR Biosciences), goat anti-rabbit IRDye 800CW (#926-32211; LI-COR Biosciences) and goat anti-mouse IRDye 680CW, (#926-68020D; LI-COR Biosciences) were used at 1:20000. Blots were scanned with an Odissey Infrared Imaging System (Odyssey). Densitometry analyses of blots were performed at non-saturating exposures and analyzed using the ImageJ software (NIH, Bethesda, MD; available at http://rsb.info.nih.gov/ij/index.html). Values were normalized to β-tubulin, which was used as loading control.
No signal was detected when the primary antibody was omitted (data not shown).
Immunofluorescence analysis
Eyes were enucleated and fixed overnight with 4% paraformaldehyde in 0.1 M sodium phosphate (pH 7.6). Analyses was performed on whole retina, as previously described [34]. Before immunofluorescence staining, paraffin-embedded retinas sections (5 µm) mounted on glass slides, were dewaxed in xylene and rehydrated through graded alcohols. Sections were put into Rodent Decloaker 1X retrieval solution (RD913, BIO-CARE MEDICAL) in a slide container and then incubated with the anti-VEGF and ant VEGFR2 primary antibodies. To establish signal specificity, in a preliminary experiment, each antibody was pre-incubated with an excess of antigen (blocking peptide). No signal was revealed in sections incubated