Università degli Studi di Messina
Dipartimento di Scienze Chimiche, Biologiche, Farmaceutiche ed Ambientali
Dottorato di Ricerca in “Scienze Chimiche” Doctor of Philosophy in “Chemical Sciences”
Development of sample-tailored gas chromatography strategies involving one, two and three analytical dimensions
PhD Thesis of:
Mariarosa Maimone
Supervisor:
Prof. Peter Q. Tranchida
Coordinator:
Prof. Sebastiano Campagna
SSD CHIM/10 XXIX Ciclo 2014-2016
Development of sample-tailored gas chromatography strategies involving one, two and three analytical dimensions
TABLE OF CONTENTS
1 General introduction and scope 1
References 2
2 Use of multiple dimensions in analytical separations
2.1 Theoretical considerations on resolution 3
2.2 Concept of multidimensionality 5
References 8
3 Heart-cutting multidimensional GC-based techniques
3.1 Introduction to multidimensional gas chromatography 9
(MDGC)
3.2 Basic instrumentation set-up 12
3.3.0 On-line coupled liquid-gas chromatography 21
3.3.1 Apparatus and conditions for on-line LC-GC 24
References 26
4 Comprehensive two-dimensional gas chromatography
4.1 From MDGC to GC×GC 29
4.2.0 Basic intrumentation set-up 35
4.2.1 Column selection 36
4.3.0 Transfer devices 41
4.3.1.0 Thermal Modulators 44
4.3.1.1 Cryogenic interfaces 48
4.3.2.0 Flow modulators 53
4.3.2.1 Valve-based devices (low duty cycle) 56
4.3.2.2 Deans switch assemblies (unit duty cycle) 57
Development of sample-tailored gas chromatography strategies involving one, two and three analytical dimensions
References 69
5 Preparative gas chromatography (prep-GC)
5.1 Introduction 77
5.2 Multidimensional preparative gas chromatography 81
References 83
6 Gas chromatography-olfactometry (GC-O)
6.1 Introduction 85
6.2 Overview of the human olfactive system 86
6.3 GC-O hardware 89
6.4 Panel of evaluators 92
6.5 Sample preparation for GC-O analysis 95
6.6 GC-O data measurement methods 97
6.7 Relationship between odorant concentration and 99
odour intensity
References 104
7 Research in the field of preparative chromatography
7.1 Performance evaluation of a multidimensional 109
preparative chromatographic system for the collection of volatile constituents: summary
7.2 Introduction 110
7.3.0 Experimental 111
7.3.1 Chemical and samples 111
7.3.2 LC pre-separation 111
7.3.3 LC-GC inteface 112
7.3.4 Multidimensional prep-GC analysis 112
Development of sample-tailored gas chromatography strategies involving one, two and three analytical dimensions
7.3.6 LC–GC transfer recovery evaluation 114
7.3.7 Evaluation of the collection recovery 114
7.4 Results and discussion 115
Conclusions 121
References 122
8 Research in the field of flow modulation comprehensive two-dimensional gas chromatography
8.1.0 Evaluation of a novel helium ionization 125
detector within the context of (low-)flow modulation comprehensive two-dimensional gas chromatography
8.1.1 Introduction 125
8.1.2.0 Experimental 126
8.1.2.1 Chemicals and samples 126
8.1.2.2. Instrumentation and software 127
8.1.3.0.Results and discussion 128
8.1.3.1 Optimized FM GC×GC 128
operational conditions
8.1.3.2 Optimized BID operational 131
conditions and analytical performance
Conclusions 136
References 137
8.2.0 Four-stage (low-)flow modulation comprehensive 138
gas chromatography-quadrupole mass spectrometry for the determination of recently-highlighted cosmetic allergens
8.2.1 Introduction 138
8.2.2.0 Experimental 139
Development of sample-tailored gas chromatography strategies involving one, two and three analytical dimensions
8.2.2.2 Instrumentation and software 139
8.2.3.0 Results and discussion 145
8.2.3.1 Optimized FM GC×GC-qMS operational 145
conditions
8.2.3.2 Figures of merit and perfume applications 147
Conclusions 151
References 152
8.3.0 Flow modulation comprehensive two-dimensional 153
gas chromatography-mass spectrometry using ≈ 4 ml min-1 gas flows
8.3.1 Introduction 153
8.3.2.0 Experimental 154
8.3.2.1 Chemicals and samples 154
8.3.2.2 Instrumentation and software 154
8.3.3 Results and discussion 156
Conclusions 162
References 163
9 Research in the field of sensomic analysis
9.1 Aroma-active compounds in the traditional Armenian 165
soup seasoning herb Heracleum transcaucasicum
9.2 Introduction 165
9.3.0 Experimental 167
9.3.1 Plant material and chemicals 167
9.3.2 Isolation of volatiles 167
9.3.3Gas chromatography–olfactometry - GC–O 168
9.3.4 AEDA 168
Development of sample-tailored gas chromatography strategies involving one, two and three analytical dimensions
9.3.6 Quantitation of sotolon 169
9.3.7 Model experiments 170
9.4.0 Results and discussion 171
9.4.1 Odour-active compounds in H. transcaucasicum shoots 171 9.4.2 Behaviour of sotolon during traditional culinary use of 174 H. Transcaucasicum
Conclusions 175
All figures and tables have been reproduced with the permission of Elsevier and John Wiley and Sons
1
Chapter 1
General introduction and scope
The scope of modern gas chromatography (GC) analysis is to qualitatively and quantitatively characterize the profiles of complex samples, such as foods, fragrances, petrochemicals, etc. If the objective is connected to sensory analyis, then the purpose is to recognize and prioritise target organoleptically-interesting molecules, and distinguish them from other volatiles that may not have relevance to the overall odour of a sample.
The research work carried out during the three years of the PhD course in Chemistry Sciences can be placed within such contexts. In such a broad field of science separation, I have dealt with a number of innovative techniques, such as preparative (heart-cutting) multidimensional chromatography for the isolation and identification of highly-pure compounds; use of flow-modulated comprehensive two-dimensional gas chromatography (FM GC×GC) with different detectors as a powerful tool for the characterization of complex samples.
Finally, during the last year of PhD course, I approached sensorial analysis, exploring the use of gas chromatography-olfactometry (GC-O) for the determination of odour-active compounds in food samples.
With regard to preparative chromatography, a lab-constructed system composed of one liquid and three GC systems was used for the isolation of the most important sesquiterpenes belonging to sandalwood essential oil [1].
With regard to FM GC×GC, the studies are related to fragrances [2], bio-diesel [3], and an essential oil [4].
Finally, GC-O was exploited for the determination of the odour-active compounds belonging to Heracleum transcaucasicum [5].
As can be derived from the brief description, during the three-year research period one-, two-, and three-dimensional GC methods have been developed with fine tuning for various analytical scopes.
2
References
[1] S. Pantò, D. Sciarrone, M. Maimone, C. Ragonese, S. Giofrè, P. Donato, S. Farnetti, L. Mondello, J. Chromatogr. A, 1417 (2015) 96.
[2] P.Q. Tranchida, M. Maimone, F. A. Franchina, T. Rodrigues Bjerk, C. Alcaraz Zini, G. Purcaro, L. Mondello, J. Chromatogr. A, 1439 (2016) 144. [3] F.A. Franchina, M. Maimone, D. Sciarrone, G. Purcaro, P. Q. Tranchida, L. Mondello, J. Chromatogr. A, 1402 (2015) 102.
[4] F.A. Franchina, M. Maimone, P. Q. Tranchida, L. Mondello, J. Chromatogr. A, 1441 (2016) 134.
[5] M. Maimone, A. Manukyan, P.Q. Tranchida, M. Steinhaus, Eur. Food Res. Technol. (2016) doi:10.1007/s00217-016-2815-9.
3
Chapter 2
Use of multiple dimensions in analytical
separations
2.1
Theoretical considerations on resolution
At present, 1D (monodimensional) chromatography is the most commonly applied method for the separation of real-world samples. However, in the last three decades it has become increasingly clear that the baseline separation of all the constituents of a sample, or of specific target analytes from the rest of the matrix, is often an unreasonable challenge when using a single chromatography column.
The two fundamental aspects which govern all chromatography processes are:
(1) peak capacity (nc) and
(2) stationary-phase selectivity.
The former parameter is related to the column characteristics (i.e., length, internal diameter, particle diameter, stationary-phase thickness, intensity of analyte-stationary phase interactions, etc.), and to the experimental conditions (i.e., mobile phase flow and type, temperature, outlet pressure, etc.). The other feature is related to the chemical composition of the stationary phase, and hence to the specific type of analyte-stationary phase interactions (i.e., dispersion, dipole-dipole, H- bonding, electrostatic, size exclusion, etc.). Selectivity is also dependent on analyte solubility in the mobile phase, whenever this type of interaction occurs.
An experienced chromatographer, with knowledge of basic theory, will easily get the best out of a column or, in other words, will maximize the number of peaks that can be stacked side by side (with a specific resolution value) in a one-dimensional separation. However, it has been emphasized that such an analytical capability will fall far short of the peak capacity requirements for many applications. In fundamental work, Giddings demonstrated from a theoretical viewpoint that “no more than 37% of the peak capacity can be used to generate peak resolution” and that “many of the peaks observed under these circumstances represent the grouping of two or more close-lying components.”, to conclude that “s” (the number of single component peaks) can never exceed
4
18% of nc [1]. Although such a value does not take stationary-phase selectivity
into account, it provides an excellent indication of the separation power of a one-dimensional chromatography system.
Equation 2.0 is well-known to be the master equation for resolution (considering two compounds), and it indicates that resolution (Rs) is affected by three parameters: efficiency (N, plate number), selectivity (α, separation factor) and retention (k, retention factor):
Eq. 2.0
The different degrees of influence, of N, α and k on RS, can be observed in an
excellent example shown in Figure 2.0 where the separation of two analytes (k1
= 4.8; k2 = 5.0; = 1.05) on a GC column (N = 20,000), under fixed conditions,
is considered. If we direct our attention to the three variables contained in Equation 2.0, and to the effects of their variation on resolution (visualized in Figure 2.1), we can draw the following conclusions:
k) If the column phase ratio is reduced (or a lower temperature applied) leading
to an increase in the retention factors, then the benefits gained are very limited in terms of resolution. An increase in k has a substantial effect on RS only for
analytes with low k values (≤ 3).
) If a more selective stationary phase is employed, thus increasing the separation factor, the resolution will benefit greatly. From Equation 2.0 it can be concluded that at lower values, an increase in α will lead to a considerable improvement in resolution, viz., up to an α value of circa 3. At higher separation factor values, the function tends to level off. Of the three variables, selectivity has the greatest effect on resolution and, thus, it is fundamental to select the most suitable stationary phase for a given separation. However, it must also be noted that Equation 2.0 is valid only for a single pair of analytes and not for a complex mixture of compounds; in the latter case, a stationary phase change will often lead to a resolution improvement for some analytes, and a poorer result for others. The choice of the most selective stationary phase has the best effects only when a low-complexity sample is subjected to separation.
N) If the column length is extended by four times, leading to an increase in N
5
improvement in peak resolution can only be achieved by extending the column length considerably. Such a modification is usually not desirable and certainly not a practical solution in view of the greatly increased analysis time. However, enhancing the plate number is without doubt the best choice whenever a medium or highly-complex mixture is subjected to chromatography. In fact, an increase in N will lead to the same percentage increase in resolution for all the
constituents of a sample.
Figure 2.0. Resolution: influence of N, α and k [2].
Using longer columns makes it possible to increase the separation efficiency of one-dimensional GC analysis, but unfortunately, this will increase the analysis time in proportion with the third power of separation efficiency. As a result, the separation efficiency of 1D GC can only be increased at the expense of prohibitively-long analysis times. Thus, the most effective way of enhancing the separation efficiency (and the selectivity) of a chromatography system, with
equivalent detection conditions, is by using a multidimensional
chromatographic system, that is an additional separation dimension.
The main driving force behind the interest in multidimensional separations [1, 3-10], including GC×GC, has been the unrelenting need to resolve (identifiably and quantifiably separate) more components in complex mixtures.
2.2
Concept of multidimensionality
An enormous variety of combinations of different separation mechanisms can be used to create multidimensional separation systems. A significant number of such combinations have already been implemented successfully, and the
6
experimental results nicely illustrate the high separation power that is typically associated with these techniques. The basic requirements for a multiple separation to be considered as multidimensional were discussed by Giddings in 1990 [1]. Two conditions should be fulfilled:
1) The components of a mixture should be subjected to two (or more)
separation steps in which their displacement is governed by different factors.
2) Analytes that have been resolved in the previous step should remain
separated until the following separation process is completed.
When two (or more) independent separation mechanisms are used, this will result in a equal number of parameters to define the identity of an analyte [11]. Considering 2D (bidimensional) GC, each analyte is characterized by two independent retention times rather than by a single one (as in 1D GC). The second condition requires the separate analysis of relatively small fractions of eluate from the first column on the second one, in order to maintain the separation already achieved on the first dimension.
If the dimensions are based on different interaction mechanisms, then the separation is said to be “orthogonal” [12]. The slightest correlation between the dimensions will generate redundant information which will affect the global separation. To illustrate the concept of orthogonality, Figure 2.1 represents three degrees of correlation between two separation dimensions. In the case of a totally orthogonal separation, the peaks are distributed over the entire plane (a). The more the dimensions are correlated, the more the distribution will be centered along the diagonal (b). In the extreme case of total correlation (c), the solutes will have a similar or the same retention in the two dimensions, resulting in the equivalent 1D separation along the diagonal.
Figure 2.1. Illustration of various degrees of correlation between two separation dimensions [2].
7
The separation dimensions must be correctly selected to produce efficient multidimensional systems. Giddings introduced the notion of sample dimensionality (S) [9], representing the number of independent variables describing the properties of the sample constituents. If the number and selectivity of the analytical dimensions match well with the sample dimensionality, then the separation will be maximized.
8
References
[1] J.C. Giddings, J. High Resolut. Chromatogr. 10 (1987) 319.
[2] H. J. Cortes (Editor), Multidimensional chromatography, Techniques and Applications, Marcel Dekker, Inc., New York and Basel, 1990.
[3] Z. Liu, J.B. Phillips, J. Chromatogr. Sci. 29 (1991) 227. [4] J.C. Giddings, Anal. Chem. 56 (1984) 1258A.
[5] M.M. Bushey, J.W. Jorgenson, Anal. Chem. 62 (1990) 161.
[6] R. Consden, A.H. Gordon, A. J. P. Martin, Biochem. J. 38 (1944) 224. [7] F. Erni, R. W. Frei, J. Chromatogr. 149 (1978) 561.
[8] J.C. Giddings, J. High Resolut. Chromatogr. 10 (1987) 319. [9] J.C. Giddings, J. Chromatogr. 703 (1995) 3.
[10] M. Zakaria, M.-F. Gonnord, G. Guiochon, J. Chromatogr. 271 (1983) 127. [11] P.J. Schoenmakers, P.J. Marriott, J. Beens, LC-GC Eur. 16 (2003) 335. [12] C.J. Venkatramani, J. Xu and J.B. Phillips, Anal. Chem. 68 (1996) 1486.
9
Chapter 3
Heart-cutting multidimensional GC-based
techniques
3.1
Introduction to multidimensional gas chromatography
(MDGC)
The unraveling of naturally-occurring complex samples has been, since a long time, the driving force behind improvement and innovation in the field of separation science. Since the very beginning of GC, it became apparent to chromatographers that single-column separations could not provide enough separation efficiency to clearly resolve every analyte in a complex sample. Important steps forward were made by replacing packed columns with capillary columns increasing the separation power by at least 10-fold [1], and by coupling gas chromatography with mass spectrometry (MS) [2]. However, such powerful techniques are often insufficient for the full understanding of complex samples. More efficient purification/separation steps would be necessary for easier and more reliable data interpretation.
Separation power can be greatly enhanced through multidimensional chromatography, with both heart-cutting and comprehensive chromatography techniques [3]. Such approaches are attractive, especially when the existing technologies, pushed to their limit, are still insufficient for complex sample analysis. The coupling of the same form of chromatography (both in the heart-cutting and comprehensive modes), such as liquid chromatography (LC-LC, LC×LC) and GC (GC-GC, GC×GC), or of two different forms of chromatography (e.g., LC-GC, LC×GC) has been investigated over the years, both in an off- and on-line manner.
The advantages of combining two independent separation mechanisms, were recognized very early within the chromatography community. Heart-cutting multidimensional gas chromatography was first introduced in 1958 by Simmons and Snyder [4], who described a first-dimension boiling-point
separation of C5-C8 hydrocarbons and a polarity-based separation of each of the
four classes in the second dimension, in four distinct analyses (Figure 3.0). The transfer of chromatographic bands between the two dimensions was achieved
10
by using a valve-based interface. The results obtained were quite remarkable and it was stated that “separations can be obtained with this column arrangement which are not normally possible with previously described arrangements of single columns and multiple columns connected in series”. Although GC column technology has evolved considerably during the last half-century this statement is still fully-valid today.
Figure 3.0. Second-dimension GC analyses of C5-C8 hydrocarbon groups [4].
The classical heart-cutting MDGC set-up usually consists of two conventional
capillary columns (e.g., 30 m × 0.25 mm ID × 0.25 µm df), connected in
series and characterized by a differing selectivity (e.g., apolar, polar-chiral, etc.). Today, MDGC experiments are for the most part carried out with
capillary columns, for clear reasons related to efficiency. Capillaries were
employed for the first time, in the MDGC field, in 1964 [5]: two 150 ft columns were connected via a pneumatically-operated diaphragm 6-port valve.
Almost, the columns can be placed in a single or two separate ovens, with the latter solution being certainly the most flexible one. The first double-oven MDGC experiment was carried out nearly 40 years ago [6]. A transfer device is located between the two dimensions, and enables the passage of chromatography bands, from the primary to the secondary column. A cryotrap, situated between the two capillaries, is an option leading the following advantages:
11
(2) peak capacity increase, by considerable reduction of the width of
primary-column chromatography bands;
(3) concentration of trace-amount compounds, co-eluting (or not) with other
constituents, applying subsequent analyses.
It must be added that, for many compounds, focusing can be attained by keeping the second oven at a low temperature during heart-cutting.
The transfer systems until-today developed can be classified in three groups: (I) in-line valve, (II) out-line valve and (III) valveless systems.
In the first group, a valve interfaces the two columns in a direct manner; out-line valves are employed to regulate the direction of gas flow toward the column interface, while valveless systems form a third minor MDGC group. When an MDGC instrument (in- or out-line valve) is in the stand-by mode, a one-dimensional analysis can be carried out; when the configuration is switched to the cutting mode, the primary-column effluent is directed toward the second column. The greater the number of transfers achieved, the higher the possibility of a mix-up of previously separated compounds. Although such an occurrence goes against a golden rule of multidimensional chromatography, namely that all compounds resolved in the first dimension, must remain so in the second, the event is acceptable if all target analytes remain separated.
Classical MDGC is usually employed for the bidimensional analysis of a part of the sample, while the other fraction is of no analytical interest. In short, the primary-column separation can be recognized as a prefractionation step, with no mess involved. Although, in principle, it is possible to carry out sequential cuts on the entire primary column effluent, such an approach is hardly ever used if all the sample constituents require analysis in both dimensions. Other rather unpractical and elaborate alternatives for such an analytical scope have been developed, namely, the use of an array of second dimension capillaries, one for each heart cut, or parallel traps located between the two dimensions, used for storage purposes [7].
Deans realized a major breakthrough at the end of the 1960s, with the introduction of pressure switching [8], what is here designated as an out-line valve system. The invention of the Deans switch brought a series of uneqivocal advantages, such as no temperature limitations, artefact formation, memory effects, or direct contact between valve mechanical parts and sample compounds; furthermore, the contribution of such interfaces toward band broadening was very low; allowing basic MDGC operations such as venting and backflushing.
12
3.2
Basic instrumentation set-up
Preceding to the descriptions of the commercial systems and applications, attention will be dedicated to the concept of in-series twin-capillary GC, the coupled-column approach proposed by Deans and Scott [9], and recent versions of that technology. Looking at an quite simple sample, composed of two constituents, represented as α and β. If such a sample is analyzed on two conventional capillaries (e.g., 30 m × 0.25 mm I.D.) linked in series, with different selectivities, and under ideal conditions of temperature (with a single oven) and flow, then the possible analytical outcomes are four:
(1) α and β overlap to some degree on both capillaries;
(2) α and β remain entirely resolved on both columns;
(3) α and β are separated on the first column but overlap to some degree on
the second;
(4) α and β co-elute to some degree on the first column, and are separated
on the second.
In cases I and II, the employment of the second stationary phase is unproductive, while it is entirely negative in the third situation. On the contrary, a clear advantage is reached in the fourth situation. If the previous example is extended to a medium-complexity sample (e.g., 100 compounds), then the number of possible combinations becomes extremely high. However, the final number of compounds that one could expect to resolve would most probably be not that much higher than that attained using a 60 m × 0.25 mm I.D. column, with a single stationary phase. One way to improve the chromatography of a coupled-column system would be to operate each stationary phase using independent temperature programs [10]. A further approach of improving the separation performance of a twin-capillary system can be obtained by manipulation of the gas flows in each column, by using an additional pressure source connected to the columns connection point [9]. A series of attractive papers, based on such an approach, have been described by Sacks and co-workers [10-12]. A scheme representing a series-coupled column ensemble with stop-flow operation is shown in Figure 3.1. The system illustrated is one belonging to the out-line valve MDGC systems. The valve is connected on one side to the columns junction point, and on the other to an aluminum ballast chamber. The pressure in BC is controlled by an electronic pressure controller. An FID is also located between the two chromatography dimensions. If a pressure pulse, equal to that of the injector, is applied to the columns connection point, then a condition of stop-flow will arise in the first column, while elution continues in the second dimension.
13
Figure 3.1. Scheme of a coupled column system, with stop-flow operation. Abbreviations: C1 = first dimension; C2 = second dimension; V = pneumatic valve; BC = ballast chamber; PC = pressure controller; I = injector; CG = carrier gas source [11].
The stop-flow MDGC instrument was employed in combination with a third separative dimension, viz., a time-of-flight (ToF) mass spectrometer, in the high-speed analysis of essential oil compounds [13]. Such MS system possess the exclusive capability to unravel coeluting GC peaks through spectral deconvolution. Figure 3.2 shows three chromatograms relative to the analysis of 9 compounds, using the tandem-column ToF MS system. Around 10 % of the
first-dimension (7 m × 0.18 mm I.D. × 0.2 µm df trifluoropropylmethyl
polysiloxane) effluent was directed to an FID (Figure 3.2 a); the single-column GC-FID chromatogram illustrates that peaks 3–4 overlap completely, while compounds 5–6 coelute partially. Looking at the middle total ion-current (TIC) chromatogram, that is an application carried out with no mid-pressure regulation, it can be simply inferred that the chromatography situation has become worse: peaks 1–2, separated on the polar column, co-elute completely
on the apolar second column (7 m × 0.18 mm I.D. × 0.2 µm df, 5 % phenyl);
though peaks 3 and 5 are now totally separated from components 4 and 6, respectively, peaks 4 and 6 now overlap completely; compounds 7-8-9, previously resolved, are now mixed together after their passage on the second capillary.
14
Figure 3.2. Chromatograms relative to the FID primary-column analysis (a), to the total ion-current MS result with no stop-flow operation (b), and to the total ion-current MS analysis with stop-flow operation (c). Peak identification for the essential oil compounds: (1) camphene; (2) furfural; (3) eucalyptol; (4) terpinolene; (5) benzaldehyde; (6) octanal; (7) β-caryophyllene; (8) geranyl acetate; (9) eugenol [13].
A 4-point stop-flow experiment, carried at times indicated by the arrows in Figure 3.2a, enabled the chromatographic separation of all nine volatiles. The first stop-flow operation was made just after the first-dimension elution of peak 1: compound 2 was halted for 5 s in the final primary-column segment. Elution in the first dimension was suspended a further 3 times: once to separate compounds 4 and 6, and the remaining two times to separate compounds 7-8-9. Mass spectral deconvolution was necessary for the chromatogram illustrated in Figure 3.2b, but was clearly not needed in the stop-flow analysis (Figure 3.2c). The stop-flow approach is both simple and attractive, and could be employed as an alternative MDGC method, though currently it is hard to encounter going through the literature.
Recently, an MDGC instrument, characterized by a microfluidic transfer device (Agilent Technologies), has been described [14]. The interface is a thermally stable, leak free, chemically inert, low dead volume, Deans switch,
15
manufactured through capillary flow technology (CFT): through holes and flow channels are etched into stainless steel plate halves, which are folded, heated to a very high temperature (>1000 °C); then, high pressure is used to generate a diffusion-bonded metal sandwich. The internal channels, created in a similar mode to the production of integrated circuits, are deactivated with a coating layer. Leak-free connections are made by using metal ferrules. Optimum conditions for stand-by, cutting and backflushing processes are created by using electronic pressure control. The interface holds five ports: two are connected to the primary and secondary columns, while another is linked to a restrictor, with the same flow resistance as the second dimension. The latter requisite is important, considering that the pressure drop across the primary column must remain constant during the two operational modes. If pressure-drop differences do occur, then there will be a mismatch between the programmed chromatography- band transfers, which are set on the basis of a preliminary stand-by separation, with those which occur during an MDGC analysis. The restrictor is usually connected to a detector, to monitor the first-dimension separation. The remaining two entrances are fixed, being linked to a two-way solenoid valve. Figure 3.3 shows how the device achieves the bypass (stand-by) and inject (cut) states. The primary flow, which is always lower than the auxiliary flow, enters the interface through the central port.
During the standby mode, the solenoid valve leads the auxiliary flow to the top left part of the Deans switch, which is connected, via an internal channel, to the port linked to the secondary capillary. Once inside the interface, the additional gas flow is divided in two parts, one directed to the second column and the other crosses the internal vertical channel ending up in the restrictor. Prior entry to the restrictor, the auxiliary flow is mixed with the first-dimension flow.
16
Figure 3.3. Scheme of the Agilent Deans switch in the bypass (stand-by) and inject (cut) modes [14].
When the solenoid valve is switched to the cutting state, the auxiliary flow is directed to the bottom left part of the transfer device, which is connected, via an internal channel, to the port linked to the flow restrictor. Once inside the interface, the auxiliary gas flow is split between the restrictor and the second column. As in the standby mode, the additional flow is mixed with the primary- column flow.
A further commercial system is the integrated “selectable 1D/2D GC–MS system”, currently commercialized by Gerstel and characterized by an Agilent capillary flow technology interface and low thermal mass GC modules [15]. The unified system is equipped with dedicated software to deal both with GC– MS and MDGC–MS applications. The main novelty is that the same mass spectrometer is employed in both applications, specifically for stand-by and cutting analysis, meaning that peaks subjected to one- and two-dimensional analysis appear in the same GC–MS chromatogram. Apart from the MS system, other detectors can be used for one- and two-dimensional GC applications. Figure 3.4 shows schemes of the unified instrument: an Agilent GC was equipped with a thermal desorption inlet, two independent LTM units, a CFT Deans switch and a CFT cross-union, to connect the restrictor (0.54 m × 0.10
mm I.D.), the second (5 % phenyl) column (10 m × 0.18 mm I.D. × 0.40 µm df),
17
Figure 3.4. Schemes of the Gerstel “selectable 1D/2D GC–MS” system [15]. The one-dimensional GC–MS configuration is reported in (a); the transfer configuration is illustrated in (b); the two- dimensional GC–MS/backflush configuration is shown in (c). Abbreviations are defined in the text .
The Agilent Deans switch connections have been illustrated previously. Apart from the PCM (pressure control module) connection (168.4 kPa) to the transfer device, a further line of the auxiliary pressure source (21.0 kPa) supplied make-up gas to the cross-union. A stand-by GC–MS application was carried out by
diverting the “wax” primary column (10 m × 0.18 mm I.D. × 0.30 µm df) flow
toward the restrictor (Figure 3.4a), while a second-dimension GC–MS analysis was performed by activation of the solenoid valve (Figure 3.4b); if required, the transferred chromatography band can be re-concentrated at the head of the secondary column by using a cryotrap. At the end of the transfer period, the remaining part of the sample was backflushed by decreasing the head pressure to 10 kPa (initially 212.7 kPa), and the second-dimension LTM heating can begin (Figure 3.4c). Though the selectable 1D/2D GC–MS system is certainly interesting it also appears to be characterized by a drawback, mainly the difficulty to perform multiple heart-cuts. The latter operation could be achieved by accumulating more than one heart-cut in the cryotrap (or even at the ambient GC temperature if not very volatile) or by performing a single application for each heart-cut. The successful outcome of the first option would depend on the capability of the second column to separate all the entrapped compounds, while high time costs could characterize the second route. Gerstel also commercializes a more classical heart-cutting MDGC system (MCS: multidimensional column switching system, with a Deans switch, and a primary (monitor) and secondary (main) column detector.
18
A further effective Deans-switch MDGC system has been developed and
introduced by Shimadzu Corporation. The MDGC instrument is
commercialized in the double-oven configuration, and is equipped with a quadrupole mass spectrometer. The first and second dimension capillaries are linked by using a low dead-volume, thermally stable and chemically inert stainless steel interface. The latter is housed in the first oven, is characterized by very small dimensions (ca. 3 cm long), is connected to an auxiliary pressure source (2 ports) and to a stand-by detector. Furthermore, a fused-silica restrictor
(R1) is fixed inside, and crosses the interface. Figure 3.5 reports two schemes of
the entire Shimadzu transfer system in the stand-by (Figure 3.5a) and cut positions (Figure 3.5b).
Figure 3.5. Scheme of the Shimadzu Deans switch in the stand-by (a) and cut (b) configurations. Abbreviation definitions are reported in the text [16].
Though the five-port metallic interface is located in the first GC, defined as GC1 (Figure 3.5 a), it is clear that a web of external connections is necessary to create the required MDGC conditions. In both operational modes, an advanced pressure control unit (APC) supplies a gas flow at constant pressure to an
external (with respect to the GC oven) fused-silica restrictor (R3) and to a two-
way solenoid valve (V). The latter is connected to two metal branches, one with
another fused-silica restrictor (R2) and one without: R2 produces a pressure drop,
slightly higher than that generated by R3 (ΔP2 > ΔP3). In the stand-by mode
(Figure 3.5a), the APC pressure is reduced on the side of the first dimension (e.g., 100 kPa – ΔP3), while it reaches the second dimension branch, passing
19
eluting from the first (apolar) column are directed to FID1. Once the solenoid valve is activated, the transfer device passes to the cutting mode (Figure 3.5b): the pressure on the first-dimension side of the interface remains unaltered,
while the pressure on the second-dimension side becomes 100 kPa – ΔP2 (a
pressure lower than 100 kPa – ΔP3). It is clear that, under such conditions, the
primary-column eluate is free to reach the second (polar) capillary. The instrument is automatically controlled by using a dedicated software that also enables the calculation of fundamental GC parameters, such as gas flows, linear velocities, and analyte recovery.
With respect to the Agilent system, the main differences are that: the capillary linked to the stand-by detector does not need to be characterized by the same flow resistance as that of the secondary column (meaning that if one wants to change the second column, then one does not need to replace the restrictor also); the external design of the (3-restrictor) transfer system is a little more elaborate. However, both the commercial instruments work in an effective manner. Among a series of MDGC experiments, a 14-cut application on perfume allergens will be herein described [16].
Recently, the connection between a series of perfumery ingredients and contact allergy has been the subject of wide scientific discussion [17]. On the basis of European legislation (7th Amendment of the Cosmetic Directive), the 26 most frequently-recognized skin allergens must be reported on the final cosmetic product if specific concentrations are reached: 10 and 100 mg L−1 in leave-on and rinse-off products, respectively. Twenty-four compounds, out of the twenty-six, are amenable to GC analysis. Prior to an MDGC experiment it is usual to inject a standard solution of target analytes to define the heart-cut windows. In the case of solutions containing perfume allergens, it is well known that they are characterized by a short life-time due to unstability. To avoid such a problem a valid alternative was found: an alkane mixture was subjected to stand-by MDGC–MS analysis, prior to the injection of the allergen standard solution. Experimental linear retention indices (LRI) were derived for each compound on the primary (5% diphenyl) column; LRI cut windows were developed by adding and subtracting 10 LRI units, with respect to the experimental value. Once an LRI cut window was established, the determination of a time window for each target analyte is straightforward. A total of fourteen cuts were extrapolated for 24 compounds, because the retention time difference between various allergens was only small. Through such an approach, the injection of an allergen solution prior to each MDGC application would not be necessary: it would be only necessary to derive the LRI values through preliminary hydrocarbon analysis. It is obvious that such an approach can be extended to any sample-type. A chromatogram relative to the
20
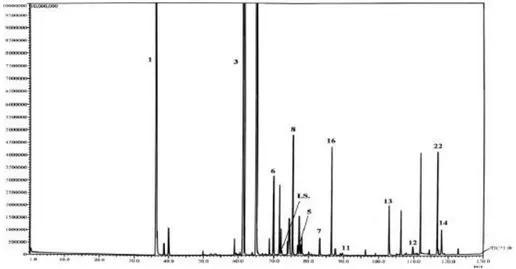
first-dimension perfume analysis, after heart-cutting (the position of each cut is shown), is illustrated in Figure 3.6. No retention-time shifts occurred during heart-cutting. The second dimension TIC MDGC-MS result is illustrated in Figure 3.7. As it can be seen, 12 allergens were nicely separated from other matrix interferences. The general mass spectral purity was very good, with MS database similarities always over 90%. Each allergen was subjected to quantification; the data attained were in good agreement with the allergens reported on the perfume container.
Figure 3.6. Chromatogram relative to a first-dimension perfume analysis, after heart-cutting and with the position of each cut indicated by a Roman number [16].
Figure 3.7. TIC chromatogram relative to a second-dimension perfume analysis. For peak identification see Ref. 16.
21
3.3.0 On-line coupled liquid-gas chromatography
On-line liquid chromatography–gas chromatography (LC–GC) methods are excellent tools for the analysis of complex mixtures. The high sample capacity and wide range of separation mechanisms of LC can be used for the selective clean-up, fractionation and preconcentration of the sample. For the final separation, GC offers high separation efficiency and a variety of selective detection methods. The main benefits from combining the two techniques are relative to the analysis time that is faster, less solvent is needed and the cost per analysis decreases. Analysis and sample preparation take place in a closed and usually automated system, where the risks of sample loss and contamination are minimized and, thus, the reliability and repeatability of the analysis are improved. In addition, the negative effects of atmospheric oxygen and moisture are eliminated. One of the main benefits of LC–GC is that, because of the efficient clean-up provided by LC, the whole sample fraction containing the analytes can be transferred to the GC. Since none of the sample material is wasted and the interfering compounds are eliminated, sensitivity is high.
In contrast to conventional GC, the LC fractions transferred to the GC are typically as large as several hundred microlitres. This cannot be done without special interfaces.
At present, most liquid chromatographic analyses are made in the reversed-phase mode (RP). Most LC–GC methods, however, are normal-reversed-phase (NP) LC– GC. In part, this is because the organic eluents used in NPLC are typically compatible with GC, making the coupling simpler. Another reason is that many of the samples analyzed by GC require extraction into an organic solvent prior to analysis, and normal-phase separation is the obvious choice. If the whole range of analytical possibilities is to be exploited, then RPLC–GC must be used as well.
On-line LC–GC systems are naturally more complicated than single chromatographic methods. It would be unreasonable, therefore, to use LC–GC for simple analytical problems that are easily solved with traditional methods. Rather, LC–GC is appropriate for samples that are difficult or even impossible to analyze by a single conventional technique. Off-line LC–GC techniques provide a good alternative to conventional techniques, when the sample amount is sufficient and the sensitivity required is not very high. Such methods offer most of the benefits of on-line techniques and the instrumentation is more flexible. The sensitivity is, however, usually lower than in on-line methods because only a part of the sample is injected to the GC. Obviously, sensitivity can be increased through the use of off-line large volume injection. The on-line
22
technique is always the best choice, however, when a wide series of samples have to be analysed, the amount of sample is limited (as, for example, in human exposure studies), or very high sensitivity is required. Figure 3.8 provides guidelines for choosing an LC–GC method. The main factors to consider in the selection are the complexity of the sample (i.e., the amount of matrix components), the characteristics of the analytes and the selectivity and sensitivity required. The analytes of interest should also be suitable for the final GC analysis, i.e., they should be sufficiently volatile and non-polar or derivatisation should be possible either before the analysis or on-line. The number of samples to be analysed is relevant. If the number is small, there is usually no need for an automated method and the time-consuming development of such a technique. The more complex the sample matrix is, the more efficient the sample clean-up must be and then LC–GC is suited for the task. LC–GC may also be preferable for relatively clean samples if very high sensitivity or selectivity is required for the analysis; for example, if the analytes of interest are present at trace levels or group-type separation of the analytes is needed before the final analysis [18]. Figure 3.9 shows a typical LC–GC apparatus, which consists of a basic LC system, an LC–GC valve interface, and a GC system with solvent vapour exit (SVE). One or two pumps are used in LC and often the separation is monitored with a UV detector. A detailed description of the instrumentation can be found in the paper published by K. Grob in 1991 [19]. Several interfaces have been developed for LC–GC coupling, even though early versions have mostly been abandoned [20-23], and only on-column [24-30], loop-type [31-37], and vaporizer interfaces [38-41], are commonly employed today. The GC part is typically a normal GC equipped with a suitable interface and a solvent vapour exit. When a vaporizer interface is used, the SVE is not always necessary. In the development of an LC–GC method, the LC method is chosen first, bearing in mind the conditions required for transfer and GC analysis.
23
Figure 3.8. Guidelines for choosing an LC-GC method [19].
Figure 3.9. An example of a basic LC-GC coupling in an on-line mode [19].
The selection of the interface and evaporation techniques is largely dependent on the volatility of the analytes. In GC, the dimensions of the retention gap and conditions during the transfer must be optimized for the selected interface and
24
evaporation techniques. The other GC conditions (i.e., column type, temperature program and detection) can then be selected quite independently.
3.3.1 Apparatus and conditions for on-line LC-GC
The LC step can be a simple separation of the target compounds from the bulk of the matrix, or a selective clean-up exploiting the selectivity of the LC column for a concentration or fractionation of the sample. The main LC-separation mechanisms have been intensively explored over the years [42,43].
Normal-phase chromatography has been employed most, since the eluents used are suitable for GC. Few applications using size-exclusion chromatography (SEC) have been published, because this technique involves high solvent volumes, which are not easily managed by the transfer device. Reversed-phase chromatography has been used less, since it requires particular effort to eliminate solvents; however there are a number of applications in this field. Generally, the column dimensions are selected taking into account that the optimum column flow has to fit the evaporation rate necessary for transfer optimization into the GC, especially when the retention-gap technique is used. Consequently, the 2-mm I.D. column seems to be the best compromise for
obtaining the optimum column flow (optimum LC flow about 0.3–0.5 mL min
-1
) and preserving the sensitivity necessary for some applications (e.g., mineral oil contamination). Larger column diameters can be employed but using a
different approach: the optimum flow (1–2 mL min-1) is applied until the
elution of the fraction of interest starts, then the flow is decreased until the end
of the transfer (generally down to 0.1 mL min-1). Backflush is a very important
step, especially when NPLC is applied. The bulk of the sample (generally polar by-products) has to be removed from the column efficiently to avoid shifting of the retention time or, what is worse, any trace of the matrix reaching the GC column. MTBE and iso-propanol are very efficient solvents for cleaning silica columns (i.e., triglycerides), but reconditioning with hexane is not easy and is usually time consuming, since it is too weak to remove solvents of such a
higher strength (e0) efficiently, so dichloromethane is usually preferred.
The heart of an LC-GC system is the transfer technique, extensively described in dedicated books [19], and by several reviews as previously reported.
The choice of a suitable interface depends on the volatility of the target analytes and the size of the fractions to be transferred. Nowdays, several different interfaces are present on the market; the reader can refer to the literature for detailed information [19]. A brief description of the programmed-temperature
25
vaporizer interface (PTV) is herein givenbecause such an interface is reported
in the experimental part (Chapter 7) of the present thesis.
In 1979, a new autoinjector interface was introduced at the Pittsburgh Conference [44,45]. The injector was modified with a flow-through side arm syringe. The volume of the fraction was limited (0.1 – 3 µL) since it was injected in a split/splitless flash–vaporization injector. The problem was solved by replacing the conventional LC column with a 1 mm microbore column, by positioning a splitter between the LC and the autoinjector interface, and by operating in the GC split mode. Several years later the LC fraction was significantly increased by using a PTV injector as interface [40]. The LC effluent was sampled from a flow-cell by a large-volume autosampler syringe and automatically injected into a PTV injector, equipped with a liner packed with different adsorbent materials. The solvent transfer can be performed in several modes, namely PTV solvent split, PTV large volume splitless, PTV vapour overflow with or without splitting. de Koning and co-workers reported various problems using the PTV interface [46], in particular recondensation in the split line or/ and in the split valve, which causes an increase in the flow resistance in the split line, and of the pressure in the injector. Consequently, both back-flow of solvent into the carrier gas flow as well as change in the split ratio, make quantification impossible. To solve such problems the split valve is positioned as close as possible to the injector and heated.
The PTV-interface is a helpful alternative to the on-column interface and presents several advantages: the packed liner retains more liquid per unit internal volume and wettability of the packing material is not required. In addition the packing material is more stable than the retention gap, especially with water and non-evaporating by-products, and it prevents high boiling compounds from reaching the GC column. Considering the diffusion of the PTV injector and the flexibility of such an interface in implementing different approaches, ranging from a normal split/splitless injection, to large volume injection and on-line LC–GC, it can be hypothesized that such an interface will enhance the introduction of LC–GC techniques in many laboratories as a routine approach. An LC–GC system exploiting the PTV syringe-type interface is commercialized by Shimadzu (Japan).
26
References
[1] M. J. E. Golay in: Gas Chromatography, V. J. Coates, H. J. Noebels, I. S. Fagerson (Editors), Academic Press, New York, USA, 1958.
[2] R. S. Gohlke, Anal. Chem. 31 (1959) 535.
[3] L. Mondello, A. C. Lewis, K.D. Bartle (Editors), Multidimensional chromatography, Wiley & Sons, Chichester, England, 2002.
[4] M. C. Simmons, L.R. Snyder, Anal. Chem. 30 (1958) 32. [5] D.J. McEwen, Anal. Chem. 36 (1964) 279.
[6] D.C. Fenimore, R.R. Freeman, P.R. Loy, Anal. Chem. 45 (1973) 2331. [7] W. Bertsch, J. High Resolut. Chromatogr. 22 (1999) 647.
[8] D.R. Deans, Chromatographia 1 (1968) 18.
[9] D. R. Deans, I. Scott, Anal. Chem. 45 (1973) 1137.
[10] R. E. Kaiser, L. Leming, L. Blomberg, R. I. Rieder, HRC & CC 8 (1985) 92.
[11] T. Veriotti, M. McGuigan, R. Sacks, Anal. Chem. 73 (2001) 279. [12] T. Veriotti, R. Sacks, Anal. Chem. 73 (2001) 3045.
[13] T. Veriotti, R. Sacks, Anal. Chem. 75 (2003) 4211.
[14] B. Quimby, J. McCurry, W. Norman, LC GC The Peak April (2007) 7. [15] K. Sasamoto, N. Ochiai, J. Chromatogr. A 1217 (2010) 2903.
[16] L. Mondello, A. Casilli, P. Q. Tranchida, D. Sciarrone, P. Dugo, G. Dugo, LC GC Eur. 21 (2008) 130.
[17] S. C. Rastogi, T. Menné, J. duus Johansen, Contact Dermatitis 48 (2003) 130.
[18] T. Hyötyläinen, M.-L. Riekkola, J. Chromatogr. A 1000 (2003) 357.
[19] K. Grob, in: On-Line Coupled LC–GC, Huthig, Heidelberg, Germany, 1991.
27
[21] I. A. Fowlis, J. High Resol. Chromatogr. 13 (1990) 213.
[22] T. V. Raglione, J. A. Troskosky, R. A. Hartwick, J. Chromatogr. 409 (1987) 205.
[23] K. Grob, D. Fröchlich, B. Schilling, H. P. Neukom, P. Nägeli, J. Chromatogr. 295 (1984) 55.
[24] F. Munari, A. Trisciani, G. Mapelli, S. Testianu, K. Grob, J. M. Colin, J. High Resolut. Chromatogr. 8 (1985) 601.
[25] H. Siren, H. Hyvönen, M. Saarinen, S. Rovio, M.-L. Riekkola, Chromatographia 34 (1992) 421.
[26] L. Mondello, P. Dugo, K.D. Bartle, B. Frere, G. Dugo, Chromatographia 39 (1994) 529.
[27] L. Mondello, P. Dugo, G. Dugo, K. D. Bartle, J. Chromatog. Sci. 34 (1996) 174.
[28] G. Jongenotter, M. A. T. Kerkhoff, H. C. M. van der Knaap, B. G. M. Vandeginste, J. High Resolut. Chromatogr. 22 (1999) 17.
[29] M. Shimmo, T. Hyötyläinen, K. Hartonen, M.-L. Riekkola, J. Microcol. Sep. 13 (2001) 202.
[30] M. Shimmo, H. Adler, T. Hyötyläinen, K. Hartonen, M. Kulmala, M.- L. Riekkola, Atmos. Environ. 36 (2002) 2985.
[31] K. Grob, J.-M. Stoll, J. High Resolut. Chromatogr. 9 (1986) 518. [32] F. Munari, K. Grob, J. High Resolut. Chromatogr. 11 (1988) 172.
[33] J. J. Vreuls, G. J. deJong, U. A. Th. Brinkman, Chromatographia 31 (1991) 113.
[34] A. Artho, K. Grob, C. Mariani, Fat Sci. Techol. 5 (1993) 176.
[35] F. Lanuzza, G. Micali, G. Calabro, J. High Resolut. Chromatogr. 19 (1996) 444.
[36] P. Tollbäck, H. Carlsson, C. Östman, J. High Resolut. Chromatogr. 23 (2000) 131.
[37] W. Kamm, F. Dionisi, L.-B. Fay, C. Hischenhuber, H.-G. Schmarr, J. Chromatogr. 918 (2001) 341.
28
[38] K. Grob, J. High Resolut. Chromatogr. 13 (1990) 540. [39] K. Grob, M. Bronz, J. Microcol. Sep. 7 (1995) 421.
[40] F. David, P. Hoffmann, P. Sandra, LC–GC Eur. 9 (1999) 550.
[41] S. de Koning, M. van Lieshout, H.-G. Janssen, U. A. Th. Brinkman, J. Microcol. Sep. 12 (2000) 153.
[42] M. Biedermann, K. Grob, J. Chromatogr. A 1255 (2012) 56. [43] G. Purcaro, S. Moret, L. Conte, J. Chromatogr. A 1255 (2012) 100.
[44] S. P. Cram, A. C. Brown III, E. Freitas, R. E. Majors, E. L. Johnson, Abstract of papers Pittsburgh Conference on Analytical Chemistry and Applied Spectroscopy, Ohio, 1979, Abstract 115.
[45] R. E. Majors, E. L. Johnson, S. P. Cram, A. C. Brown III, E. Freitas, Abstract of papers Pittsburgh Conference on Analytical Chemistry and Applied Spectroscopy, Ohio, 1979, Abstract 116.
[46] S. de Koning, H.-G. Janssen, M. van Deursen, U. A. Th. Brinkman, J. Sep. Sci. 27 (2004) 397.
29
Chapter 4
Comprehensive two-dimensional gas
chromatography
4.1
From MDGC to GC×GC
An on-line multidimensional instrument is generally characterized by the combination of two columns of different selectivity, with a transfer device located between the first and second dimensions.
There are two types of multidimensional gas chromatography: heart-cut GC extensively described in Chapter 3 (MDGC or GC-GC) and comprehensive two-dimensional GC (GC×GC or 2D GC). In MDGC experiments (Figure 4.0 a) two different columns are used, but only a small portion of the material eluting from the first dimension column (“heart-cut”) is introduced for further separation onto the second dimension. The number of heart-cuts can be increased, if only the time allowed for the separation of the cuts in the second dimension is proportionally reduced (Figure 4.0 b). When the number of heart-cuts gets high enough (and the time for their separation short enough), one accomplishes a comprehensive separation (Figure 4.0 c), in which the entire sample (or a representative fraction of each sample component) is subjected to separation in both dimensions. Consequently, one can say that GC×GC is in essence an extension of conventional heart-cut GC.
30
Figure 4.0. The concept of multidimensional GC. (a) single heart-cut GC analysis, where a large portion of the effluent from the primary column with coelutions is diverted to the second dimension column and separated over an extended period of time. (b) dual heart-cut GC analysis, where two regions with coelutions are diverted to the second dimension column, but with less time to perform each separation. (c) comprehensive two-dimensional GC analysis occurs when the size of the sequential heart-cuts is very short, as are the second dimension chromatograms [33].
In truth, the number of samples that can be re-injected onto the second dimension is limited in MDGC, because excessive (or continuous) heart- cutting would cause the loss of a substantial fraction of the primary column resolution [1].
The number of peaks that a chromatographic analysis can resolve can be
expressed by the system peak capacity (nc). In MDGC, the peak capacity equals
the sum of that of the first and second dimensions, the latter multiplied by the number (x) of heart-cuts [nc1 + (nc2 × x)] (see Figure 4.1).
31
Figure 4.1. Comparison of the 1D GC and the main types of 2D GC (MDGC and GC×GC) [2].
MDGC was used quite widely in the final decades of the twentieth century, but it never became very popular. It probably did not catch on because the instrumental setup, though considered ‘‘fairly simple’’ today, was thought to be too complex for routine use at the time. The main advantages of the MDGC approach are that, in principle, the most powerful second dimension can be selected for each individual target analysis problem, and that there are no time constraints: as regards duration of the run, the second separation is not ‘‘coupled’’ to the first one. However, MDGC has an important limitation, namely the number of heart cuts that can be subjected to a secondary analysis. For such a reason, if the entire initial sample requires analysis in two different dimensions, then a different analytical route must be taken, namely a comprehensive chromatographic approach.
In an ideal comprehensive chromatography system, the total peak capacity becomes that of the first dimension multiplied by that of the second dimension
(nc1 × nc2) (see Figure 4.1). The first example of comprehensive
multidimensional chromatography dates back to over 60 years ago. In 1944, chromatography pioneers described a two-dimensional procedure for the analysis of amino-acids on cellulose [3]: “A considerable number of solvents has been tried. The relative positions of the amino-acids in the developed chromatogram depend upon the solvent used. Hence, by development first in one direction with one solvent followed by development in a direction at right angles with another solvent, amino-acids (e.g., a drop of protein hydrolysate) placed near the corner of a sheet of paper become distributed in a pattern across the sheet to give a 2D chromatogram characteristic of the pair of solvents used”.
32
The combination of solvents to be employed in that two-dimensional analysis was chosen on the basis of RF (retardation factor) values, a parameter (movement of band/movement of solvent front) introduced in that same paper. In fact, the right combination of solvents would enable a more extensive occupation of the two-dimensional space. The amino-acid RF values, for a series of solvent combinations, were used to both to predict and construct what today we would define as “dot plots”. A predicted two-dimensional chromatogram, using collidine to develop the first dimension and a phenol-ammonia mixture to develop the second dimension, is illustrated in Figure 4.2 on the left. The excellent agreement between the predicted and experimental results can be appreciated by observing Figure 4.2 on the right.
Figure 4.2. Expected positions of a series of amino-acids on a two-dimensional paper chromatogram (on the left) and two-dimensional analysis of 22 amino-acids on paper, developed using collidine in the first dimension and a phenol-ammonia mixture in the second dimension (on the right) [3].
Proceeding onto gas-phase chromatographic separations, comprehensive two- dimensional gas chromatography was invented by Phillips in the early 1990s [4,5], and has been developed to meet the increasing need for complex sample analysis and to address limitations such as peak capacity and restricted specificity of one-dimensional (conventional) GC systems.
Comprehensive chromatographic approaches can by highly useful for the separation of a complex mixture of analytes, as schematically illustrated in Figure 4.3. Let us consider a hypothetical sample that contains a large number of analytes that differ in shape, colour, and size. Following Giddings guidelines [6], the sample can be characterized by a dimensionality of three. Under such conditions, there is practically no chance to separate all the analytes using a conventional single dimension system. By using a 1D system, the separation can either be performed according to size, but then colour and shape will
33
remain unseparated; or it can be performed according to colour, but then size and shape will remain unseparated. Or, finally, the separation can be performed according to shape, and then size and colour will remain unseparated. A viable approach to achieve the separation of all the constituents of this sample is to use an orthogonal two-dimensional separation system with a dimensionality that can match the dimensionality of the sample [6]. In such a case, one can use most of the available separation space very efficiently to accommodate the separated analytes and create a highly-structured elution pattern.
Figure 4.3. Match between separation and sample dimensionality in GC×GC. [10]
In GC×GC, everything starts by injecting and mixing the sample with the carrier gas in the injector. However, rather than entering the detector when exiting the GC column, the solutes arrive at an interface named as modulator, placed between the two separation dimensions (columns) connected in series. The modulator ensures high sampling rates and the transfer of the sample from the first to the second column [7]. The modulator acts as an on-line injector that produces very narrow injection pulses (down to 50 ms peak width) at the second column head. The entire 1D chromatogram is thus ‘‘sliced’’, on the basis of a specific modulation period (PM), and then re-injected onto the second column for a fast GC-type separation [8] (see Figure 4.4 a).
34
Figure 4.4 a-c. Scheme of the column coupling in a GC×GC setup and of how data are handled [10]. (a) The modulator allows the rapid sampling of the analytes eluting out from the first column and reinjection onto the second. The modulation process is illustrated for two overlapping compounds (X and Y) at a defined first- dimension retention time (1t). As the modulation process occurs during a defined PM , narrow
bands of sampled analytes enter the second column and are characterized by different second-dimension retention times. (b) Raw data signal as recorded by the detector throughout the entire separation process. (c) Construction of the two-dimensional contour plot from (b).
Ideally, the separation of analytes in the second dimension must be completed before another pulse is injected to avoid overlap of peaks issued from different modulation cycles (an effect called wrap around). It is interesting to note, however, that, as far as no new co-elutions are generated, there is no reason to spend time and effort to avoid wraparound in a separation procedure. And even if a specific chromatographic structure ‘‘wraps around,’’ a trained eye or a dedicated software would easily re-establish a clear picture of the separation space [9]. The most important drawback of wraparound is when peaks overlap and co-elutions occur. The second column analysis is normally much faster than the first one and sometimes a secondary GC oven is used. Because sampling (modulation) occurs during the primary-column separation, the total GC runtime of a GC×GC separation is about the same as in conventional GC. With regard to detection, everything occurs as in classical GC and a trace is monitored continuously. Specifically, a series of high-speed secondary
35
chromatograms, of a length equal to the PM (3–10 sec), are recorded one after another (Figure 4.4 b). They consist of slices that can be combined to describe the elution pattern by means of a contour plot (Figure 4.4 c).
As discussed, the potential ability to provide a substantially larger peak capacity is not the only advantage of GC×GC over 1D GC. GC×GC processes offer several advantages, such as the formation of highly-organized chromatograms, increased sensitivity, and so on [10-18]. To summarize, the main advantages of GC×GC, over conventional GC methods, are essentially five:
(1) speed - considering the number of resolved peaks /unit of time;
(2) selectivity - two stationary phase of different selectivity are used;
(3) separation - increased resolving power;
(4) sensitivity - the isolation of chemical noise has a considerable influence on sensitivity. Moreover, an analyte band compression effect is generated by modulation, which improves s/n ratios (mainly using cryogenic modulation);
(5) spatial order - the contour plot formation of chemically-similar compound
patterns for homologous series.
4.2.0 Basic intrumentation set-up
Basically, a GC×GC system can be constructed using the same equipment employed for conventional 1D GC. Samples are introduced by using any type of injector (e.g., split, splitless, large volume, programmed-temperature vaporizor, etc.); the eluate is then fractionated and re-injected through the modulator onto a second capillary column coated with a different stationary phase for further separation. The two columns can be situated in a single oven, or in two different ones, the latter option providing a higher degree of flexibility during method optimization. Dedicated detectors with high acquisition rates, negligible internal volumes, and rapid rise times are required to accurately reconstruct the narrow chromatography bands generated.
Finally, the entire GC×GC process requires data elaboration and visualization (Figure 4.5). Although basic information on the chromatographic performance can be deduced by expert operators from the modulated raw signal, a transformation process is necessary to visualize and elaborate the results. Dedicated software packages stack second-dimension chromatograms side by
![Figure 2.1. Illustration of various degrees of correlation between two separation dimensions [2]](https://thumb-eu.123doks.com/thumbv2/123dokorg/4584638.38859/14.748.79.626.700.913/figure-illustration-various-degrees-correlation-separation-dimensions.webp)
![Figure 3.3. Scheme of the Agilent Deans switch in the bypass (stand-by) and inject (cut) modes [14]](https://thumb-eu.123doks.com/thumbv2/123dokorg/4584638.38859/24.748.212.494.110.439/figure-scheme-agilent-deans-switch-bypass-stand-inject.webp)
![Figure 3.4. Schemes of the Gerstel “selectable 1D/2D GC–MS” system [15]. The one- one-dimensional GC–MS configuration is reported in (a); the transfer configuration is illustrated in (b); the two- dimensional GC–MS/backflush configuration is sho](https://thumb-eu.123doks.com/thumbv2/123dokorg/4584638.38859/25.748.123.682.105.364/selectable-dimensional-configuration-configuration-illustrated-dimensional-backflush-configuration.webp)

![Figure 3.9. An example of a basic LC-GC coupling in an on-line mode [19].](https://thumb-eu.123doks.com/thumbv2/123dokorg/4584638.38859/31.748.129.641.543.821/figure-example-basic-lc-gc-coupling-line-mode.webp)

![Figure 4.10. Twin-stage thermal desorption-modulation process on two compounds, co- eluting in the first dimension [43]](https://thumb-eu.123doks.com/thumbv2/123dokorg/4584638.38859/54.748.152.521.199.463/figure-thermal-desorption-modulation-process-compounds-eluting-dimension.webp)
![Figure 4.21. The ‘‘out-line’’ single-loop, dual-stage FM device introduced by Seeley [71]](https://thumb-eu.123doks.com/thumbv2/123dokorg/4584638.38859/68.748.137.549.105.417/figure-line-single-loop-stage-device-introduced-seeley.webp)
