1
Adsorption of C
1–C
4alcohols, C
4–C
5isoolefins and their corresponding ethers
over Amberlyst
™35
R. Soto1, N. Oktar2, C. Fité1,*, E. Ramírez1, R. Bringué1, J. Tejero1
1 Chemical Engineering Department. University of Barcelona. Marti i Franqués 1-11, 08028 Barcelona. Spain
2 Chemical Engineering Department. Gazi University. Yükseliş Sk. 5, 06570 Maltepe-Ankara, Turkey
* Corresponding author, email: [email protected]
Abstract
An experimental liquid- and gas-phase adsorption study of C1–C4 alcohols, C4–C5 isoolefins and the tert-alkyl ethers obtained thereof over Amberlyst™35 is presented. Liquid-phase adsorption experiments were performed in a batch adsorber and gas-phase adsorption experiments were carried out in a packed-bed adsorber in a defined temperature range. Adsorption entropy and enthalpy were determined from adsorption equilibrium constants of each tracer in both liquid and gas phase. Adsorption equilibrium constants of alcohols were found to be larger than those of isoolefins and ethers. The moment technique was used to estimate micro- and macropore effective diffusion coefficients of the involved species. Keywords: adsorption equilibrium, C1–C4 alcohols, C4–C5 isoolefins, tertiary ethers, diffusion coefficients
1. Introduction
Methyl tert-butyl ether (MTBE), ethyl tert-butyl ether (ETBE), propyl tert-butyl ether (PTBE), butyl tert-butyl ether (BTBE), tert-amyl methyl ether (TAME) and tert-amyl ethyl ether (TAEE) have attracted considerable attention of researchers in the last decades due to their potential as environmentally benign gasoline high octane additives [1–5]. These ethers are manufactured from the corresponding reactions of C1–C4 primary alcohols, methanol (MeOH), ethanol (EtOH), propanol (PrOH) and butanol (BuOH), with C4–C5 isolefins, namely isobutene (IB), 2-methyl-1-butene (2M1B), and 2-methyl-2-butene (2M2B). Macroreticular sulfonic ion exchange resins (IER), such as Amberlyst™35 (A-35), and Amberlyst™15 (A-15) are excellent catalysts for such reactions.
Several kinetic studies have been focused so far on the syntheses of tertiary ethers using IER as catalysts [1,6–9]. Adsorption thermodynamic properties of compounds on IER are usually determined from kinetic experiments by non-linear regression by assuming a certain kinetic model. Some spread in published estimated values is found. In fact, individual information on the adsorption of involved compounds cannot often be explicitly drawn due to the form of kinetic equations, which in most cases assume a catalytic surface saturated by reactants and products [6,10–12]. Experimental determination of adsorption related properties is of interest
2 to contrast the non-linear regression outcomes and to reduce the number of variables in
kinetic equations.
Macroreticular IER consist of agglomerates of microspherical particles with free space between them, which provides permanent porosity [13] (see Fig. 1). The resin functional groups (–SO3H) can be divided into those located on the surface of the microparticles and those located within the microparticles. When located on the microparticles surface, they are more accessible due to the presence of permanent pores and macropore diffusion rules the transport of molecules. To access to the inner functional groups, molecules need to penetrate through the polymer matrix, so micropore diffusion within the resin gel-phase controls this stage. Macro and micropore diffusion resistances can be evaluated by the moment technique [14–17].
Figure 1
To date, experimental studies on adsorption of tertiary olefins, alcohols and ethers on IER, are scarce, particularly on A-35 [15,18,19]. Besides, data about effective diffusion coefficients on IER are rarely available. The present work aims to provide a detailed study about the
adsorption of primary alcohols, olefins and ethers on A-35. Estimation of adsorption
equilibrium constants, heat of adsorption, macro- and micropore diffusion coefficients are the main goals.
2. Experimental
2.1. Chemicals
The following chemicals were used for system calibration, liquid- and gas-phase adsorption experiments: n-heptane (>99 %GC, Merck KGaA, Darmstadt, Germany), n-hexane (>99 %GC, Merck KGaA, Darmstadt, Germany), MeOH (>99.8 %GC, Merck KGaA, Darmstadt, Germany), EtOH (>99.8 %GC, Sigma Aldrich, Steinheim, Germany), PrOH (>99.8 %GC, Sigma–Aldrich, Tres Cantos, Spain), BuOH (>99.8 %GC, Sigma–Aldrich, Tres Cantos, Spain), 2M1B (>99 %GC, TCI Europe, Zwijndrecht, Belgium), 2M2B (>99 %GC, TCI Europe, Zwijndrecht, Belgium), IB (>99 %GC, Air Products, Paris, France) and MTBE (>99.5 %GC), ETBE (>99.9 %GC), PTBE (>99.5 %GC), BTBE (>99.5 %GC) and TAEE (>99.7 %GC) were synthesized in our lab and purified after successive distillations. 2.2. Setup and procedure
Liquid-phase experiments were carried out in a glass batch adsorber (60 mL) tightly covered with a Teflon plate to which a total reflux condenser and a sampling septum were attached. Temperature was controlled within ±1K by a thermostatic bath. A liquid mixture of n-heptane (solvent) and the tracer was stirred at 1000 rpm in all experiments, conducted at five different initial concentrations (< 0.5% mol.). An amount of 0.28 g of dry catalyst were used for each
3 run. Samples of 2.5 µL were taken with a syringe periodically from the liquid mixture and analyzed in a gas chromatograph (GC, Agilent 6890N) equipped with a packed column (2m, 15% FFAP on Chromosorb AW) and a flame ionization detector (FID).
Pulse response gas-phase experiments were conducted in a stainless steel packed bed adsorber of ¼ i.d. connected to the GC oven. Linear velocity of carrier gas (He) was varied from 10 to 100 mL·min-1. The packed bed, consisting of 0.1 g of dry catalyst, was fixed in the tube with glass wool in both sides of the bed. Total bed length was 12 mm and a bed void fraction of εb=0.407 was estimated using empirical correlations [20]. Before each run, the column was
conditioned for 1 h at 373 K with constant flow of He. At the beginning of the runs, 0.2 µL of liquid was injected to the GC for all the tracers, except for IB, where 100 µL of gas was injected. The response peaks were quantified using a FID.
2.3. Catalyst characterization
All runs were conducted with commercial A-35, since this macroreticular oversulfonated IER has been proved to be highly active and selective for etherification reactions [4]. The
crosslinking degree of A-35 is 20% and its acid capacity 5.36 ± 0.02 eqH+ kg-1. An average particle diameter (D0) of 0.531 mm was determined by laser diffraction in air in a previous
work [21]. Generally, the particle size does not influence adsorption equilibria, but diffusion affects the rate at which the solid surface is filled. A pore volume of 0.211·10-3 m3 kg-1, a mean pore diameter of 2.92·10-8 m, a surface area of 34 000 m2 kg-1, and a catalyst
macroporosity (εa) of 0.245 were obtained from sorption-desorption of N2 at 77 K, and an
apparent density (ρp) of 1,164 kg m-3 from helium displacement.
Additionally, a set of characterization techniques were applied to obtain information on the inner nature of the catalyst. The fresh catalyst was dried 15 h at 373 K in an atmospheric oven before each run. Fourier transform infrared (FTIR) spectroscopy analysis (Spectrum™100, PerkinElmer, equipped with attenuated total reflectance accessory) of pyridine adsorption was performed for A-35 at 353 K. FTIR spectra obtained can be found in the Supporting
Information Sect. Scanning Electron Microscopy (SEM) was performed in a QUANTA 400F Field Emission Instrument using crashed and uncrashed particles of fresh A-35, previously coated with gold to make them conductive. Particles were crashed to better observe the inner structure of the catalyst.
2.4. Theory and calculations
Similar procedures to those described by Doğu et al. [22] for liquid-phase batch adsorber and by Oktar et al. [15] for gas-phase packed bed adsorber were followed in this work. The
species conservation equation for an adsorbed tracer (j), Eqs. 1 and 3, and the definition of the nth moment (mn,L for liquid phase, and mn,G for gas phase), Eqs. 2 and 4, depend on the
4 Ideal batch adsorber:
0 , 0 3 j s j a a p R R dC m C D dt ρ R R = ⎛ ⎞⎛ ⎞ ∂ = −⎜⎜ ⎟⎜⎟ ⎟ ∂ ⎝ ⎠ ⎝ ⎠ (1) , , ,0 , 0 j j eq n n L j j eq C C m t dt C C ∞⎛ − ⎞ = ⎜⎜ ⎟⎟ − ⎝ ⎠
∫
(2)Packed bed adsorber:
(
)
0 2 , 0 2 0 3 1 j j b j a j z a b R R C C C dC D U D z z R R dt ε ε = ∂ ∂ − ∂ − − = ∂ ∂ ∂ (3) , 0 n n G j m =∞∫
C t dt (4)Diffusing species within the macropores of macroreticular IER adsorb on the external surface of microspheres, and then adsorbed species penetrate into the microspheres by diffusion [22]. Such process may be modeled by considering adsorption on the external surface of the
catalyst followed by diffusion of adsorbed species into the pellet [15]. For this model, species conservation equations in the macropores for a batch and a packed bed adsorber are Eqs. 5 and 6, respectively. For both type of adsorbers, species conservation within the microspheres is expressed by Eq. 7. 0 , , 2 2 0 3 j a j a a p i a r r C C D q R D R r R r ρ r = ε t ∂ ∂ ⎛ ⎞ ∂ − ∂ = ⎜ ⎟ ∂ ⎝ ∂ ⎠ ∂ ∂ (5)
(
)
0 , , 2 * 2 0 3 1 j a a j a a p i a r r C C D q R D R R R r r t ε ρ ε = ∂ ⎛ − ⎞ ∂ ⎛ ⎞ ∂ − ∂ = ⎜ ⎟ ⎜ ⎟ ∂ ⎝ ∂ ⎠ ⎝ ⎠ ∂ ∂ (6) 2 2 i D r q q r r r t ∂ ⎛ ∂ ⎞ = ∂ ⎜ ⎟ ∂ ⎝ ∂ ⎠ ∂ (7) where 0 j j a, r r q = = K C (8)Partial differential Eqs. 5 to 7 can be solved in the Laplace domain [24]. The zeroth moment equation derived for the bidisperse system for the liquid-phase batch adsorber is eventually expressed by Eq. 9 [22].
(
)
' 2 2 , 0 0 0, ' ' , 15 1 p j L L a i s a p j L p K R r m D D m K ρ ε ρ ρ ⎛ ⎞ = ⎛ ⎜ + ⎟ ⎞ ⎝ ⎠ + + ⎜ ⎟ ⎜ ⎟ ⎝ ⎠ (9)5 where D’i = Di ρp K’j,L is the effective microsphere diffusivity and K’j,L = qm Kj,L is the apparent
liquid-phase adsorption equilibrium constant. qm is the maximum adsorption capacity.
Analogously, the moment equations for a packed bed adsorber (gas phase) are expressed by Eqs. 10 and 11 [15,23]. The first absolute moment (μ1) represents the time delay of the
response curve and the second central moment (μ2) represents the variance of the response
peak.
(
)
, 1, 1 0, 0 1 1 1 p j G G b b a G b a K m L m U ρ ε ε ε μ ε ε ⎡ − ⎛ ⎞⎤ = = ⎢ + ⎜ + ⎟⎥ ⎝ ⎠ ⎣ ⎦ (10) 2, 2 2 1 0. 0 2 G b d f a i G m L m U ε μ = −μ = ⎡⎣δ +δ + +δ δ ⎤⎦ (11)The gas-phase adsorption equilibrium constant of an adsorbing tracer (Kj,G) can be evaluated
from μ1, and effective diffusivities may be estimated from μ2, which includes the
contributions of film mass transfer (δf), axial dispersion (δd), macropore diffusion (δa), and
micropore diffusion (δi) resistances. Such contributions are a function of Kj,G and they can be
expressed by Eqs. 12−15:
(
)
2 2 , 0 1 1 3 p j G b a f b f a K R k ρ ε ε δ ε ε − ⎛ ⎞ = ⎜ + ⎟ ⎝ ⎠ (12)(
)
2 , 2 0 1 1 b a 1 p j G z b d b a K D U ρ ε ε ε δ ε ε ⎡ − ⎛ ⎞⎤ = ⎢ + ⎜ + ⎟⎥ ⎝ ⎠ ⎣ ⎦ (13)(
)
2 2 2 , 0 1 1 15 p j G b a a b a a K R D ρ ε ε δ ε ε − ⎛ ⎞ = ⎜ + ⎟ ⎝ ⎠ (14)(
)
2 0 , 1 15 b i p j G b i r K D ε δ ρ ε − = (15)Finally, the dimensionless parameter α, Eq. 16, characterizes the ratio of diffusion times in the macro and micropore regions [22,25]. For α >>1, micropore diffusion resistance may be neglected, and thus the bidisperse structure can be approximated to a monodispersed-like.
2 ' 0 0 i a R D r D α = ⎜⎛ ⎞ ⎛⎟ ⎜ ⎞⎟ ⎝ ⎠ ⎝ ⎠ (16)
6
3. Results and discussion
3.1 Characterization of Amberlyst™35
FTIR technique allows to assess the surface acidic properties of supports and catalysts, since the characteristic bands in the FTIR spectrum indicate whether pyridine is protonated through the nitrogen atom (by surface Brønsted acid sites) or bonded to coordinative unsaturated sites (Lewis acids). Upon interaction with a Brønsted acid site, pyridine is protonated to a
pyridinium ion and adsorbs with a characteristic band around 1545–1540 cm-1 [26]. Interaction of pyridine with Lewis acid sites creates a coordinatively bonded pyridinium complex with a well-resolved band centered around 1452–1447 cm-1. A band located around 1490 cm-1 is common to both adsorbed species. The A-35 FTIR spectra expansion in the area of interest is shown in Fig. 2. Acid sites of A-35 are mostly Brønsted type or Brønsted-Lewis, since two well-defined bands are observed at 1544 and 1488 cm-1, respectively.
Figure 2
SEM images (Fig. 3) show that the catalyst is formed by an aggregation of microspheres, thus it can be appropriately considered as a bidisperse catalyst (Fig. 1) for modeling adsorption processes. From several images at the same magnification as in Fig. 3b, an average
microsphere diameter (d0) of 3.11·10-8 m was estimated from the measurement of 22 different
microspheres.
Figure 3
3.2 Liquid-phase adsorption results
A preliminary run was performed at room temperature using n-hexane as solvent and n-heptane as tracer. Since concentration did not change with time in the batch adsorber, it is concluded that paraffins hardly adsorb on A-35. n-Heptane was chosen as the solvent, because its boiling point (372 K) is higher than that of n-hexane (342 K), and thus suitable for working in a temperature interval of 323-353 K. Special care was taken for the solubility of all tracers in n-heptane to assure a homogeneous liquid phase in all the runs. In the case of very low concentrations of tracers, adsorption isotherms can be approximated by the Langmuir model [18], see Eq. 17. , , , , 1 1 eq j L j L S m j L j L j q K C q K C = = ⎛ ⎞ + ⎜ ⎟ ⎝
∑
⎠ (17)where qeq = (Cj,0-Cj,eq)/ms is the adsorbed concentration at equilibrium and ms=mcat/VT,L is the
mass of dry catalyst divided by the total volume of solid free liquid (solvent plus tracer). Linearization of Eq.17 can provide adsorption equilibrium constant Kj,L and the maximum
7 Liquid-phase adsorption experiments were conducted successfully only for C1–C4 alcohols and 2M2B. In an attempt to carry out this type of experiments with ethers, it was observed that reverse reactions of etherification took place leading to ethers decomposition into olefin and alcohol. Therefore, Kj,L could not be experimentally determined for ethers. As expected,
symmetric ethers from dehydration of C1–C4 primary alcohols were not detected, since such reactions usually take place at temperatures higher than 353 K [27,28]. Fig. 4. Shows
examples of the obtained concentration decay curves.
Figure 4
Concentration decay curves for each tracer at different temperatures revealed that alcohols adsorption was more significant in terms of (Cj,0-Cj,eq) than that of 2M2B, what indicates a
preferential adsorption of alcohols. MeOH and EtOH were adsorbed in higher extent than PrOH and BuOH. For the runs at 353 K with 2M2B, adsorption equilibrium was not reached after 2 h for any assayed concentration. It may be due to chemisorption of the olefin at high temperature as intermediate step for the olefin dimerization. Consequently, 2M2B adsorption was not studied at 353K. For the other cases, Kj,L and K’j,L values were obtained at each
temperature from the Langmuir type isotherms, see Fig. 5. All regression results are gathered in Tab. 1.
Figure 5
Table 1
Generally K’j,L decreased in the order MeOH>EtOH>PrOH>BuOH>2M2B. Molecular size
can explain the decreasing trend of K’j,L as the number of carbon atoms of alcohol increased.
Smaller alcohols can more easily access inner active sites located in the densest polymer zones. Also, the different polarity of alcohols, for which swelling of the polymeric matrix decreases in the same order, may present some influence. qm and K’j,L values obtained for
alcohols, especially for MeOH and EtOH, were found to be 2-5 fold higher than those of 2M2B. The obtained values are comparable to those determined for similar tracers over A-15 [18,22].
As expected, K’j,L of alcohols and 2M2B decreased with temperature in the range
investigated, as expected. In previous studies [18], it has been reported that Kj,L increases with
temperature above 334 K, what suggests chemisorption of EtOH on the active sites. However, such a behavior has not been observed for any of the alcohols used in this work. From the van’t Hoff equation (Eq. 18), the standard liquid-phase adsorption enthalpy (∆adsH°j,L) and
entropy (∆adsS°j,L) can be obtained, see Fig. 6. These values are gathered in Tab. 2. The
dimensionless adsorption equilibrium constants (K*j,L) used for van’t Hoff plots were
estimated by transformation of values from Tab. 1 using Eq. 19. The total concentration C0
8 coefficients of the species, γj, were calculated at every temperature by means of the
UNIFAC-Dortmund method [29,30]. , , * , ln o o ads j L ads j L j L H S K RT R −Δ Δ = + (18) , 0 * , j L j L j K C K γ = (19)
Figure 6
Table 2
The obtained ∆adsH°j,L values were very similar for alcohols. Their low values indicate weak
temperature dependence of adsorption equilibrium constants. On the contrary, ∆adsH°2M2B,L and
∆adsS°2M2B,L were notably larger than those of alcohols. These unexpected large values could be
attributed to chemisorption of the olefin, since isomerization reaction is expected to be significant within the explored temperature range. The fulfillment of the Boudart rules was checked to assess the thermodynamic consistency of estimated data. The rules that can be applied to IER are [38]: i) ΔadsS°j,L<0, because the adsorption process implies a loss of
entropy, ii) –ΔadsS°j,L<S°j,L (Tab.2), because the loss of entropy cannot be larger than the total
entropy and, iii) ΔadsH°j,L<0, because adsorption is an exothermic process. The obtained
ΔadsHj,L values are in reasonable agreement with those estimated from gas-phase studies on
A-15 [19], see Tab. 2.
3.3 Gas-phase adsorption results
Pulse-response experiments were performed for PrOH, BuOH, IB, 2M1B, 2M2B, MTBE, ETBE, PTBE, BTBE and TAEE. The first moment showed a linear dependence on space time (LU0-1) at different temperatures with R2 values ranging from 0.94 to 0.99 for all the tracers.
Alcohols response peaks presented very long tails to the right (positive skew), taking about 5-10 h to obtain the whole peak. Response peaks for olefins and ethers presented also positive skew, though 1 or 2 h were typically enough for total elution. This fact clearly indicates a strong interaction of alcohols in the packed bed resulting in very high retention times. Typical results obtained for first absolute moment are depicted in Fig. 7. Responses with long tails suggest an important contribution of micropore diffusion phenomena to the second absolute moment.
Figure 7
The ρpKj,G values obtained from the slopes (passing from the origin) of linear relations µ1 vs.
L/U0 are gathered in Tab. 3. When gas-phase adsorption data could not be obtained, they were
estimated from liquid-phase values following the procedure described elsewhere [18,39]. As it can be seen, very similar values of ρpKj,G were obtained for MTBE, ETBE, PTBE and TAEE,
9 and slightly lower for BTBE. With respect to olefins, ρpK2M1B,G and ρpK2M2B,G were similar
and slightly lower than ρpKIB,G, whose values are very similar to those of ethers. This suggests
that IB is more prone to be adsorbed on the resin than isoamylenes. Among 2M1B and 2M2B, the former presented slightly lower values of ρpKj,G. Generally, it can be concluded that
adsorption equilibrium constants of olefins and ethers are of the same order of magnitude, implying comparable adsorption. ρpKj,G of alcohols were about two order of magnitude larger
than those of olefins and ethers, showing a preferential adsorption of alcohols, in agreement with literature [15]. As for the liquid-phase case, this fact can be explained by the formation of hydrogen bonds between the –SO3H network of active sites and the hydroxyl group of alcohols and by the swelling induced by alcohols that favors adsorption. Differences between experimental ρpKj,G and those from liquid-phase data could be due to a different swelling of
the resin in liquid and gas-phase experiments.
The estimated gas-phase apparent heat of adsorption (ΔadsHºj,G) from Van’t Hoff equation for
all tracers, see Tab. 3, are in reasonable agreement with those determined over A-15 [15]. As a whole, gas-phase adsorption of alcohols was more exothermic than those of olefins and the corresponding ethers. 2M1B adsorption was slightly more exothermic than that of 2M2B. Generally, obtained ΔadsHºj,G were notably larger than ΔadsHºj,L, indicating that adsorption
process in the gas phase is more temperature dependent. Globally, the obtained ρpKj,G and
ΔadsHºj,G values are in reasonable agreement with those obtained for these tracers over A-15
[15].
Table 3
Empty tube experiments were performed for BuOH, TAEE and 2M2B to assess the possible contributions to the moments caused by dead volumes in the setup. Such contributions were estimated as lower than 1% for µ2 and less than 5% for µ1, therefore no corrections were
applied to calculated moments. Decomposition of ethers was expected in gas-phase runs, but only the tracer peak was observed in the signals. It can be explained by the short contact time with the packed bed adsorber compared to the batch adsorber [15], and by the fact that gas-phase reaction rates are around 25 times slower than in the liquid gas-phase [1].
3.4 Diffusion resistances 3.4.1 Gas-phase diffusivities
As for the second central moment (Eq. 11), the contributions of δd, δf, δa and δi have been
evaluated. If adsorption and desorption within porous particles is sufficiently rapid and strong, the concentration profile within the particle may be asymmetric, which can lead to significant contribution of axial dispersion arising from the transport through the porous solid. The axial dispersion coefficient Dz in the packed bed was estimated by means of Eq. 20, as Wakao
proposed for porous particles [16], where υ is the kinematic viscosity (the ratio of dynamic viscosity to gas-phase density of tracers), and Dv is the gas-phase molecular diffusivity of the
10 Dynamic viscosity has been estimated by means of the corresponding states method,
accounting for correction factors for polarity of compounds as described by Lucas [40]. Critical properties for viscosity calculations have been estimated from Joback method [40]. Gas-phase densities have been calculated from the Redlich-Kwong Equation for real gases, but ideal-gases law can also be safely used, since deviations from ideal behavior have been found to be lower than 0.8% for all tracers and temperatures. Dv values have been estimated
following the Chapman and Enskog equations and the method described by Fuller [40]. The contribution of δd to µ2 varied from 1 to 5%.
0 0 20 1 20 1 2 2 2 2 z b D D R R ReSc υ υ ε υ ⎛ ⎞ = ⎜ ⎟+ = + ⎝ ⎠ (20)
The film mass transfer coefficient (kf) has been estimated by Eq. 21 [41]. The values range
was from 6 to 23 m s-1. The contribution of δf to µ2 was negligible, less than 0.001 %.
1/3 1/2 0 0 0 2 2 1.15 f v v k R v R U D D v ⎛ ⎞ ⎛ ⎞ ⎛ ⎞ = ⎜ ⎟ ⎜ ⎟ ⎜ ⎟ ⎝ ⎠ ⎝ ⎠ ⎝ ⎠ (21)
The macropore gas-phase diffusion coefficient (Da) is a function of the Knudsen diffusion
coefficient (DT) and it can be calculated through Eq. 22. DT has been estimated by Eq. 23 as
described by Smith [42]. The tortuosity factor (τ=1/εa) for A-35 was estimated as 4.1. Da
values varied from 8·10-8 to 3.6·10-7 m2s-1 for all tracers. The final contribution of δa to the µ2
was less than 7%.
a T a D D ε τ = (22) 1 2 9700 T a j T D r M ⎛ ⎞ = ⎜⎜ ⎟⎟ ⎝ ⎠ (23)
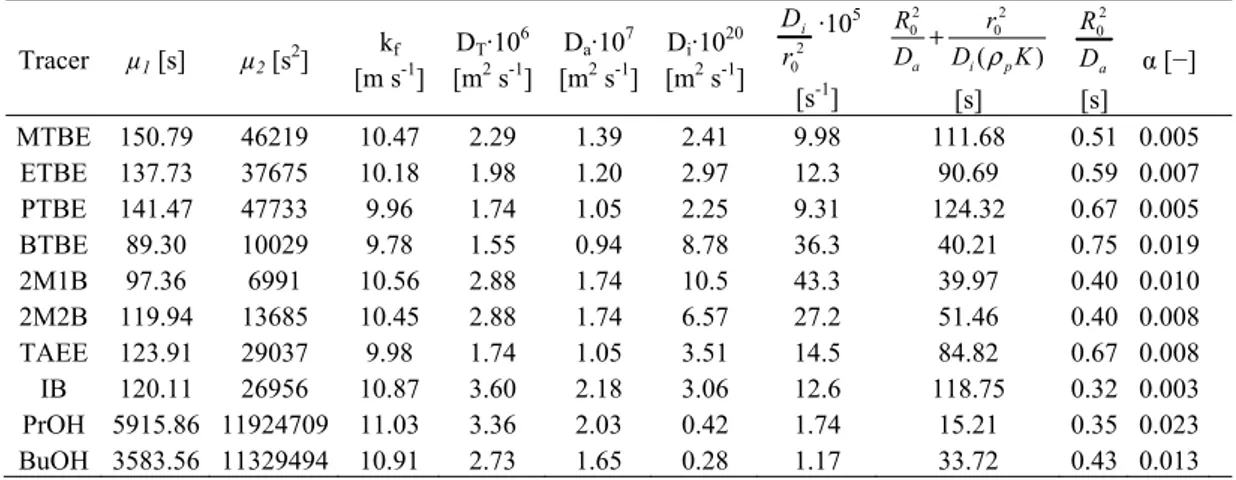
Once µ2, δd, δf and δa were known, δi was calculated and micropore diffusivities (Di) have
been estimated using the r0 value determined by SEM. Di obtained values have been of the
order 10-20–10-21 m2s-1. Contributions of δi to µ2 were larger than 85%, hence important
micropore diffusion limitations occur in commercial particles of A-35. Obtained Da and Di
values are reasonable, since Di is usually smaller than Da [25]. Typical values obtained from
µ2 analysis for evaluated tracers are gathered in Tab. 4.
Finally, the obtained α values in the gas phase ranged from 0.005 to 0.05, what indicates that both macro and micropore diffusion resistances are significant and they cannot be neglected. Obtained values are in agreement with those reported for A-15 [15], but micropore diffusion resistance has resulted to be more significant on A-35.
11 3.4.2 Liquid-phase diffusivities
Dimensionless concentration profiles, (Cj-Cj,eq)/(Cj,0-Cj,eq) vs. time, were built and the area
under these curves, the zeroth moment (Eq. 2), was used to estimate liquid-phase effective diffusion coefficients. The obtained m0,L values ranged between 250–800 s for alcohols and 500–2000 s for 2M2B. R02/Da and r02/Di’ terms in Eq. 9 are the characteristic times of
diffusion in the macropores and within the gel-like microspheres. Da values are expected to be
different in liquid and gas phase, but Di is expected to be the same, since it occurs by strong
interactions of the adsorbed molecules and the catalyst matrix by forming hydrogen bonds with the catalyst –SO3H groups [22].
The parameter α in liquid-phase, which ranged from 30 to 150, has been estimated by Di’
values shown in Tab. 4. As seen, micropore diffusion was the most relevant contribution to the diffusion times (R02/Da + r02/Di’) for gas-phase adsorption (Tab. 4). However, obtained α
values indicate that micropore diffusion resistance is much smaller than macropore diffusion resistance within the filled pores in the liquid phase. This result is supported by those obtained for A-15 [22,43], where it was found that the efficiency of the catalyst operating in liquid-phase reactions is mainly due to the process occurring in the macropores since the efficiency in the gel microspheres is unity. As a consequence, Eqs. 5 and 9 can be rewritten as Eqs. 24 and 25, respectively. 2 2 a D q q R R R R t ∂ ⎛ ∂ ⎞ = ∂ ⎜ ⎟ ∂ ⎝ ∂ ⎠ ∂ (24)
(
)
2 0 0, ' , 15 1 L s a a p j L p R m m D ε ρ K ρ = ⎛ ⎞ + + ⎜ ⎟ ⎜ ⎟ ⎝ ⎠ (25)Da can be estimated once the values of m0,L and K’j,L are known. Tab. 5 summarizes some
typical values obtained for the different tracers evaluated in the liquid phase. Generally, Da
values for alcohols were larger than those obtained for 2M2B. This result can be ascribed to resin swelling caused by alcohols, which eventually favors diffusion of adsorbing species after the widening of the catalyst pores. Among alcohols, slightly higher Da values were
obtained for MeOH and EtOH that can be related to the molecular size, since the smaller the molecule the easier the diffusion through the catalyst macropores. Although Da values are
expected to increase with temperature and tracer concentration, no clear trends have been observed for the explored range. Da values estimated on A-35 are lower than those on A-15 in
the presence of the same tracers [22]. This is coherent, since A-35 is the oversulfonated version of A-15. The larger amount of sulfonic groups of A-35 resulted in a denser structure through which adsorbing species had found more hindrances to diffuse. The smaller surface area, pore volume and diameter obtained by BET analysis for A-35 compared to A-15 enforced this conclusion [44]. Liquid-phase macropore diffusion times (R02/Da) calculated
from Tab. 5 ranged from 550 to 1000 s, being about 10 times larger than micropore diffusion times (r02/Di’), which confirms the higher importance of macropore diffusion resistance in the
12
Table 5
Finally, it is to be noted that errors associated with the determination of effective diffusion coefficients are typically of about one order of magnitude with respect to the estimated value, thus the uncertainty of such coefficients is strongly influenced by the accuracy of the
experimental and characterization of morphological data. Resin swelling generally depends on the polarity of the liquid where they are immersed, what induces changes in the resin
morphology, affecting porosity, pore size, particle radius and microspheres radius, and consequently effective diffusion coefficients. In very dilute systems, as in the present study, this effect can be neglected and the approximation of constant morphological properties, determined in dry state by BET technique can be considered accurate enough for calculations. Since obtained values were in concordance with previous studies over a similar catalyst, diffusion data presented in this work are considered as reliable. In non-diluted systems, swelling effects are expected to be more noticeable, and other characterization techniques as Inverse Steric Exclusion Chromatography would be more suitable.
Furthermore, adsorption must be taken into account as a complex process in which several species are competing for the active sites. As previously demonstrated, adsorption equilibrium constants of olefins increase when the catalyst is previously pretreated with alcohols [15], indicating that the adsorption of one tracer influences the adsorption of others. This presents a remarkable effect on estimated diffusion coefficients, apart from possible effects of varying liquid-phase concentrations.
4. Conclusions
Liquid and gas-phase adsorption of C1–C4 alcohols, C4–C5 isoolefins and tertiary ethers obtained thereof has been studied on Amberlyst™35 in the temperature range from 323 to 353 K. Adsorption equilibrium constants of olefins and ethers are similar, and notably lower than those of alcohols. The estimated liquid-phase adsorption enthalpy indicates that alcohols adsorption depended less on temperature whereas the larger values for 2M2B suggested chemisorption of the olefin as intermediate step of isomerization reaction.
The moment technique has been used to assess the effective diffusion coefficients of
adsorbing species. Macropore resistance has been found to be more significant than diffusion within the gel-like microspheres in the liquid phase, while both macro and micropore
diffusion are important in the gas-phase. Diffusion and adsorption are influenced not only by the molecular size of adsorbing species, but also by swelling caused by alcohols.
Acknowledgement
Authors are grateful to Rohm & Haas France SAS (The Dow Chemical Company) for providing the used ion-exchange resin Amberlyst™35, to Middle East Technical University, Ankara, for performing the SEM images, and to Gazi University, Ankara, for providing the
13 installations and resources to carry out the experimental work. Finally, the authors gratefully acknowledge Prof. Dr. T. Doğu and Prof. Dr. G. Doğu for their valuable contribution. Symbols used
C0 [mol m–3] total concentration of species
Cj [mol L–1] tracer concentration in the bulk phase (liquid or gas)
Cj,0 [mol m–3] initial tracer concentration in the liquid phase
Cj,a [mol m–3] tracer concentration in the macropores
Cj,eq [mol m–3] tracer concentration at equilibrium in the liquid phase
d0 [m] average microsphere diameter
D0 [m] average diameter of catalyst particles Da [m2 s–1] effective macropore diffusion coefficient
Di [m2 s–1] diffusion coefficient within the gel-like microspheres
D’i [m2 s–1] effective microsphere diffusion coefficient
DT [m2 s–1] Knudsen diffusion coefficient
Dz [m2 s–1] axial dispersion coefficient
Dν [m2 s–1] molecular diffusivity of tracers in the carrier gas
ΔadsHºj [kJ mol–1] standard molar heat of adsorption of compound j
∆vHj [kJ mol–1] enthalpy of vaporization of compound j
kf [m s–1] film mass transfer coefficient
Kj [m3 kg–1] adsorption equilibrium constant of compound j
K*j [–] dimensionless adsorption equilibrium constant of compound j
K'j [m3 kg–1] apparent adsorption equilibrium constant of compound j
L [m] packed-bed length mcat [kg] mass of dry catalyst
mn,G [sn+1] nth moment in the gas phase
mn,L [mol sn+1 m–3] nth moment in the liquid phase
ms [kg m–3] ratio of catalyst dry mass to liquid volume Mj [kg mol–1] molecular weight of compound j
q [mol kg–1] adsorbed concentration
qeq [mol kg–1] adsorbed concentration at equilibrium qm [mol kg–1] maximum adsorption capacity (at saturation)
r [m] microsphere radius
14 r0 [m] average microsphere radius
R0 [m] average radius of catalyst particles
ra [m] macropore radius
Re [–] Reynolds number
Sºj [J (mol K)–1] standard molar entropy of formation of compound j
ΔadsSºj [J (mol K)–1] standard molar entropy change of adsorption of compound j
Sc [–] Schmidt number
t [s] time
T [K] temperature
u [m s–1] linear velocity U0 [m s–1] linear velocity VT,L [m3] total liquid volume
z [m] position in the axial direction (tube length)
Greek letters
α [–] ratio of diffusion times in the macro and micropore regions γj [–] activity coefficient of species j
δa [s] contribution of macropore diffusion resistance
δd [s] contribution of axial dispersion resistance δf [s] contribution of film mass transfer resistance δi [s] contribution of micropore diffusion resistance εa [–] macroporosity of the catalyst
εb [–] bed void fraction
µ1 [s] first absolute moment in the gas phase µ2 [s2] second central moment in the gas phase ν [m2 s–1] kinematic viscosity
ρp [kg m–3] apparent catalyst density
ρ*p [kg m–3] density of catalyst microspheres
τ [–] macropore tortuosity factor
Subscripts
ads adsorption eq equilibrium G gas phase
15
L liquid phase
n number of moment evaluated
References
[1] C. Fité, M. Iborra, J. Tejero, J.F. Izquierdo, F. Cunill, Ind. Eng. Chem. Res. 1994, 33, 581–591.
[2] C. Fité, J. Tejero, M. Iborra, F. Cunill, J.F. Izquierdo, AIChE J. 1998, 44, 2273–2279. [3] J.A. Linnekoski, A.O. Krause, L.K. Struckmann, Appl. Catal. A Gen. 1998, 170, 117–
126.
[4] J.H. Badia, C. Fité, R. Bringué, M. Iborra, F. Cunill, Top. Catal. 2015, 58, 919–932. [5] R. Soto, C. Fité, E. Ramírez, R. Bringué, F. Cunill, Fuel Process. Technol. 2016, 142,
201–211.
[6] R. Soto, C. Fité, E. Ramírez, R. Bringué, F. Cunill, Chem. Eng. J. 2017, 307, 122–134. [7] J.A. Linnekoski, A.O. Krause, L.K. Rihko, Ind. Eng. Chem. Res. 1997, 36, 310–316. [8] G. Bozga, A. Motelica, R. Dima, V. Plesu, A. Toma, C. Simion, Chem. Eng. Process.
Process Intensif. 2008, 47, 2247–2255.
[9] H. Hamid, M.A. Ali, Handbook of MTBE and other gasoline oxygenates, 1st ed., Marcel Dekker Inc., New York, 2004.
[10] M.A. Pérez, R. Bringué, M. Iborra, J. Tejero, F. Cunill, AIChE J. 2016, 62, 180–194. [11] J. Guilera, R. Bringué, E. Ramírez, C. Fité, J. Tejero, AIChE J. 2014, 60, 2918–2928. [12] R. González, Ph.D. Thesis, University of Barcelona 2011.
[13] S.K. Ihm, J.H. Ahn, Y.D. Jo, Ind. Eng. Chem. Res. 1996, 35, 2946–2954. [14] G. Doğu, C. Ercan, Can. J. Chem. Eng. 1983, 61, 660–664.
[15] N. Oktar, K. Mürtezaoğlu, G. Doğu, T. Doğu, Can. J. Chem. Eng. 1999, 77, 406–412. [16] D.M. Ruthven, Principles of Adsorption and Adsorption Processes, John Wiley &
Sons, New York, 1984.
[17] N. Hashimoto, J.M. Smith, Ind. Eng. Chem. Fundam. 1974, 13, 115–120.
[18] T. Doğu, N. Boz, E. Aydin, N. Oktar, K. Mürtezaoğlu, G. Doğu, Ind. Eng. Chem. Res. 2001, 15, 5044–5051.
[19] P. Słomkiewicz, Adsorpt. Sci. Technol. 2006, 24, 239–256.
[20] F. Benyahia, K.E. O’Neill, Part. Sci. Technol. 2005, 23, 169–177.
[21] R. Soto, C. Fité, E. Ramírez, J. Tejero, F. Cunill, Catal. Today. 2015, 256, 336–346. [22] T. Doğu, E. Aydin, N. Boz, K. Murtezaoğlu, G. Doğu, Int. J. Chem. React. Eng. 2002,
1, 1. DOI: 10.2202/1542-6580.1012
[23] K. Kawazoe, M. Suzuki, K. Chihara, J. Chem. Eng. Japan. 1974, 7, 151–157. [24] T. Furusawa, M. Suzuki., J. Chem. Eng. Japan. 1975 ,8, 119–122.
[25] T. Doğu, Ind. Eng. Chem. Res. 1998, 37 (6), 2158–2171.
16 [27] M.A. Pérez, R. Bringué, M. Iborra, J. Tejero, F. Cunill, Appl. Catal. A Gen. 2014, 482,
38–48.
[28] P. Kiviranta-Pääkkönen, L.K. Struckmann, J.A. Linnekoski, A.O. Krause, Ind. Eng. Chem. Res. 1998, 37, 18–24.
[29] J. Gmehling, J. Li, M. Schiller, Ind. Eng. Chem. Res. 1993, 32, 178–193.
[30] J. Gmehling, J. Lohmann, A. Jakob, J. Li, R. Joh, Ind. Eng. Chem. Res. 1998, 37, 4876–4882.
[31] H.G. Carlson, E.F.Westrum. Jr., J. Chem. Phys. 1971, 54, 1464. [32] O. Haida, H. Suga, S. Seki, J. Chem. Thermodyn. 1977, 9, 1133–1148.
[33] J.F. Counsell, E.B. Lees, J.F. Martin, J. Chem. Soc. A Inorganic, Phys. Theor. 1968, 1819-1823.
[34] J.F. Counsell, J.L. Hales, J.F. Martin, Trans. Faraday Soc. 1965, 61, 1869-1875.
[35] R. M. Stephenson, S. Malanowski. Handbook of the thermodynamics of organic compounds, 1st ed., Elsevier, New York, 1987.
[36] V. Majer, V. Svoboda, Enthalpies of Vaporization of Organic Compounds: A Critical Review and Data Compilation, 1st ed. Blackwell Scientific Publications, Oxford, 1985. [37] J. Chao, K.R. Hall, J. Yao, Thermochim. Acta. 1983, 64, 285–303.
[38] M. V. M. Boudart, D.E. Mears, Kinetics of heterogeneous catalytic reactions, Ind. Chim. Belge. 1967, 32, 281-284.
[39] L. Boulicaut, S. Brandani, D.M. Ruthven, Microporous Mesoporous Mater. 1998, 25, 81–93.
[40] R. C. Reid, J. M. Prausnitz, B. E. Poling, The properties of gases and liquids, 5th ed., Mc Graw Hill, New York 2001.
[41] J.J. Carberry, Chemical and Catalytic Reaction Engineering, 1st ed., McGraw Hill, New York 1976.
[42] J.M. Smith, Chemical engineering kinetics, 3rd ed., McGraw Hill, New York 1981. [43] R.M. Quinta Ferreira, C.A. Almeida-Costa, A.E. Rodrigues, Ind. Eng. Chem. Res.
1996, 35, 3827–3841.
[44] J.H. Badia, C. Fité, R. Bringué, E. Ramírez, M. Iborra, J. Ind. Eng. Chem. 2016, 42, 36-45.
17
Tables with headings
Table 1. Liquid-phase adsorption equilibrium constants on A-35 and associated standard error
Parameter T [K] MeOH EtOH PrOH BuOH 2M2B
Kj,L·103 [m3mol-1] 323 23.2 ± 3.8 31.9 ± 4.0 21.1 ± 4.4 21.67 ± 1.24 7.05 ± 0.21 333 19.0 ± 2.6 28.6 ± 4.7 17.4 ± 2.5 15.37 ± 1.52 4.15 ± 0.13 343 15.0 ± 3.4 25.2 ± 2.3 13.4 ± 2.1 13.78 ± 1.35 3.388 ± 0.028 353 13.30 ± 1.10 20.56 ± 0.82 12.6 ± 2.4 10.59 ± 0.21 - K’j,L·103 [m3kg-1] 323 229.8 ± 45.5 153.8 ± 26.6 136.8 ± 28.1 105.7 ± 8.3 25.2 ± 4.0 333 187.2 ± 33.2 147.1 ± 34.7 119.1 ± 17.1 96.7 ± 15.5 31.4 ± 8.8 343 152.7 ± 49.9 131.4 ± 18.0 98.5 ± 15.3 77.1 ± 13.2 21.3 ± 2.2 353 167.3 ± 21.5 116.0 ± 8.1 91.4 ± 17.5 74.3 ± 3.2 -
Table 2. Liquid-phase adsorption thermodynamic properties and associated standard error when available Tracer ∆adsHj,L (This work) [kJmol-1] ∆adsSj,L (This work) [J(molK)-1] S°j,L [J(molK)-1] ∆vHj [kJmol-1] ∆adsHj,G [kJmol-1] ∆adsHj,L [kJmol-1] MeOH -6.3 ± 0.5 -3.2 ± 1.5 127.19a 37f -39.7h -2.7i EtOH -8.1 ± 0.9 -3.7 ± 2.8 159.86b 41.3f -43.5h -2.2i PrOH -7.0 ± 0.3 -2.9 ± 1.0 192.80c 44.7f -50.5h -5.8i BuOH -6.9 ± 0.3 -3.4 ± 1.0 225.73d 50.1f − − 2M2B -33.7 ± 8.1 -72.5 ± 24.5 251.2e 28.4g -76.9h -48.5i
Data from the National Institute of Standards and Technology (NIST) book: a) [31], b) [32], c) [33], d) [34], e) [35], f) [36], g) [37], h) [19], i) estimated from gas-phase data and enthalpy of vaporization of compounds (∆vHj) as: ∆adsHj,L =∆vHj +∆adsHj,G
Table 3. Adsorption equilibrium constants (ρp Kj,G) and apparent heat of adsorption obtained
in the gas phase from 323 to 353 K over A-35 ρpKj,G [-] ΔadsHºj,G [kJmol-1] Tracer 323 K 333 K 343 K 353 K MTBE 169.3 147.6 114.1 90.2 -20.3 ± 2.1 ETBE 168.4 135.8 116.7 90.3 -19.1 ± 1.5 PTBE 168.5 146.1 116.7 86.9 -20.9 ± 2.7 BTBE 139.3 130.6 102.6 69.8 -21.8 ± 5.2 2M1B 125.5 111.0 87.8 58.4 -21.7 ± 1.1 2M2B 136.8 118.4 106.0 72.1 -19.1 ± 4.5 TAEE 162.9 133.0 105.4 82.0 -23.8 ± 4.7 IB 168.8 135.3 112.6 66.8 -27.9 ± 5.9 MeOH 3485.1a 2341.5a 1619.2a 1392.7a -29.7 ± 3.4 EtOH 4775.5 a 3666.9a 2697.5a 1984.2a -27.9 ±1.2 PrOH 13399.5a 8658.9a 5508.4a 8576.0 3983.0a 3868.4 -38.9 ± 1.4 BuOH 28877.7a 18784.9a 10594.3a 5888.1 7973.8a 2556.9 -41.8 ± 2.4
18 Table 4. Second central moment analysis for some tracers at 353 K and L·U0-1= 0.64 s in
gas-phase adsorption experiments
Tracer µ1 [s] µ2 [s2] [m skf-1] DT·106 [m2 s-1] Da·107 [m2 s-1] Di·1020 [m2 s-1] 2 0 i D r ·105 [s-1] 2 2 0 0 ( ) a i p R r D +D ρ K [s] 2 0 a R D [s] α [−] MTBE 150.79 46219 10.47 2.29 1.39 2.41 9.98 111.68 0.51 0.005 ETBE 137.73 37675 10.18 1.98 1.20 2.97 12.3 90.69 0.59 0.007 PTBE 141.47 47733 9.96 1.74 1.05 2.25 9.31 124.32 0.67 0.005 BTBE 89.30 10029 9.78 1.55 0.94 8.78 36.3 40.21 0.75 0.019 2M1B 97.36 6991 10.56 2.88 1.74 10.5 43.3 39.97 0.40 0.010 2M2B 119.94 13685 10.45 2.88 1.74 6.57 27.2 51.46 0.40 0.008 TAEE 123.91 29037 9.98 1.74 1.05 3.51 14.5 84.82 0.67 0.008 IB 120.11 26956 10.87 3.60 2.18 3.06 12.6 118.75 0.32 0.003 PrOH 5915.86 11924709 11.03 3.36 2.03 0.42 1.74 15.21 0.35 0.023 BuOH 3583.56 11329494 10.91 2.73 1.65 0.28 1.17 33.72 0.43 0.013
Table 5. Diffusivities of tracers evaluated in the liquid phase
Tracer T [K] Cj,eq [molm-3] Da·10 12 [m2s-1] MeOH 323 41.87 11.08 333 50.78 11.10 343 59.25 9.68 353 71.13 12.41 EtOH 323 26.50 11.32 333 19.94 7.48 343 26.24 12.29 353 37.34 9.44 PrOH 323 74.72 8.87 333 33.85 9.38 343 33.25 6.98 353 92.66 9.12 BuOH 323 59.07 7.68 333 44.17 7.62 343 44.54 9.15 353 77.21 8.57 2M2B 323 38.16 1.99 333 37.70 1.71 343 36.62 2.05 353 10.78 2.56
19
Figure legends
Figure 1. Schematic representation of a bidisperse-like macroporous catalyst consisted of sulfonated polystyrene-divinylbenzene. Adapted from [9]
Figure 2. Expansion of FTIR spectra of adsorbed pyridine over A-35 at 353 K
Figure 3. SEM images of the inner face of a crashed pretreated A-35 particle at different magnifications: (a) 200,000x, and (b) 400,000x
Figure 4. Concentration decay curves obtained for: (a) different initial concentrations of EtOH at 323 K, (b) BuOH at several temperatures, and (c) different initial concentrations of MeOH, EtOH, PrOH, BuOH and 2M2B at 323 K
Figure 5. Linearized liquid-phase adsorption isotherms on A-35 at 323 K
Figure 6. van’t Hoff plot for tracers used in liquid-phase adsorption experiments on A-35 Figure 7. First absolute moment data obtained for: (a) ETBE at different temperatures, (b) ethers at 333 K, and (c) IB, 2M1B, 2M2B, PrOH and BuOH at 333 K
Table of contents section
Research article: Liquid- and gas-phase adsorption equilibrium
constants of C1–C4 alcohols, C4–
C5 isoolefins and their
corresponding ethers on Amberlyst™35 have been estimated from 323 to 353 K, and thereof adsorption enthalpy and entropy. Macro and micropore diffusion coefficients have been calculated from experimental data by means of the moments technique.
Adsorption of C1–C4alcohols,
C4–C5 isoolefins and their
corresponding ethers over Amberlyst™35
R. Soto, N. Oktar, C. Fité*, E. Ramírez, R. Bringué, J. Tejero.
Chem. Eng. Technol. 20XX, XX (X),
20
![Table 2. Liquid-phase adsorption thermodynamic properties and associated standard error when available Tracer ∆ ads H j,L (This work) [kJmol -1 ] ∆ ads S j,L (This work) [J(molK)-1] S° j,L [J(molK) -1 ] ∆ v H j [kJmol -1 ] ∆ ads H j,G [kJm](https://thumb-eu.123doks.com/thumbv2/123dokorg/4425958.29249/17.892.183.711.493.658/liquid-adsorption-thermodynamic-properties-associated-standard-available-tracer.webp)