UNIVERSITÀ DEGLI STUDI DI SASSARI CORSO DI DOTTORATO DI RICERCA
Scienze Agrarie
Curriculum Scienze e Tecnologie Zootecniche
Ciclo XXIX
Investigation on meteorological variables affecting sheep bulk
milk quality in Sardinian farming systems
dr. Rita Marras
Coordinatore del Corso Prof. Antonello Cannas Referente di Curriculum Dott. Corrado Dimauro Docente Guida Prof. Nicolò P.P. Macciotta
Acknowledgements
I would like to acknowledge all people who contributed to any extent to this Ph.D. thesis: Professors, researchers and postgraduate fellows of the Section of Animal Science of the Department of Agriculture, Sassari.
Furthermore, I would like to thank Ilaria Peana (Meteorological Department of Sardinia Environmental Agency, ARPAS), Antonio Natale and Paolo Oppia (Sardinian Breeders Association, ARAS) for providing data.
Summary
Chapter 1: Introduction ... 8
-Overview of world milk production ... - 9 -
Sheep milk composition ... - 13 -
Quality of sheep milk ... - 21 -
Heat stress ... - 36 -
Objectives of the Thesis ... - 47 -
Bibliography ... - 49 -
Chapter 2: A survey on dairy sheep farming in Sardinia ... 63
-Introduction ... - 64 -
Materials and methods ... - 65 -
Farm structural information and database editing ... - 65 -
Bulk milk quality in Sardinia ... - 66 -
Statistical Analysis ... - 67 -
Results ... - 67 -
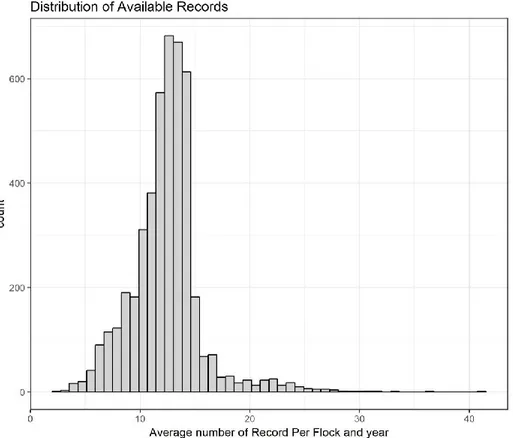
Dataset characteristics ... - 67 -
Bulk milk quality in Sardinia ... - 74 -
Factors influencing milk characteristics... - 77 -
Discussion ... 80
Bibliography ... 85
Chapter 3: Influence of bio-meteorological variables on bulk milk composition of Sardinian farms ... 88
-Introduction ... - 89 -
Materials and methods ... - 91 -
Data collection and database description ... - 91 -
Statistical analysis ... - 96 -
Results and discussion ... - 98 -
Descriptive statistics of THI... - 98 -
Bulk milk composition and relationship with THI ... - 103 -
Regression analysis ... - 111 -
Bibliography ... 120
Chapter 4: Assessing bulk milk composition variability in Sardinian farms as influenced by meteorological factors ... 123
Introduction ... 124
Materials and methods ... 125
Bio-meteorological and milk composition farm data... 125
Statistical analysis ... 127
Results and discussion ... 130
Linear mixed modelling of THI ... 130
Factor analysis on meteorological variables ... 137
Conclusions ... 144
Bibliography ... 146
Overview of world milk production
Humans started the consumption ruminant milk during in the Neolithic Age after the first agricultural revolution, when they evolved from a nomadic to a sedentary society, A consequence of such a transformation was the domestication of animals, used both for providing work and food. At a first stage, animals were used only to obtain meat, but afterwards all the other secondary products were known. Milk became a desired and appreciated product and an important source of nutrients, providing energy, high quality proteins, essential vitamins and minerals (Balthazar et al., 2017). Thus, dairy breeds were selected to obtain domesticated animals with higher milk yield than their wild ancestors (Barłowska et al., 2011). Sheep and goats were the first domesticated species about 10,000 years ago (Haenlein, 2007), because well-adapted to grazing or browsing (goat) of poor marginal lands.
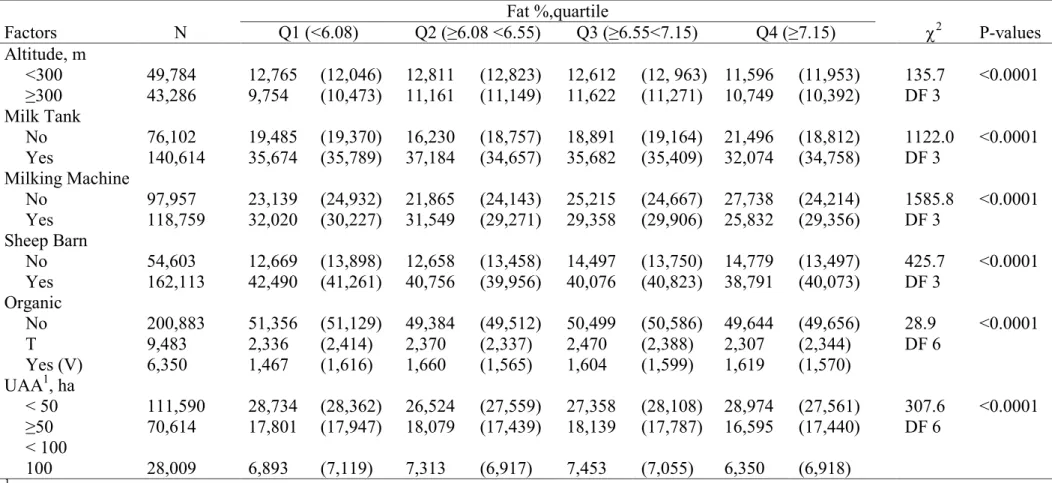
Global production of milk worldwide in 2016 has been estimated in 798 million tonnes (FAOSTAT, 2016). Further of the total official milk production, unknown quantities exist that are destined for family or local consumption and processed directly by farmers or dairies. Most of world’s (Figure 1) is produced by cows (82.6%), whereas the remaining amount derives from camel (0.3%), sheep (1.3%), goat (1.9%) and buffalo (13.9%).
Figure 1 World milk production in 2016 (FAOSTAT)
0 200 400 600 800 Buffalo milk Camel milk Cow Milk Goat Milk Sheep Milk Millions Tonnes
Even if sheep milk has a lower importance compared to cows, ovine breeds are widely farmed in different regions worldwide. Sheep products contribute to the sustenance of a large number of people in rural areas and have high economic relevance. Most of the sheep milk produced in the world is processed into cheese, fresh sheep milk is seldom consumed or turned into yogurt. According to FAO statistics (2016) China (13.1%) is the major world’s producer of sheep milk, followed by Turkey (9.0%) and Greece (6.9%) (Table 1).
Table 1 Top world sheep and goat milk producers in 2016 (FAOSTAT)
Sheep milk tonnes % Goat milk Tonnes %
Asia 4,727,694 45.6 Asia 8,043,749 52.7
Europe 3,004,607 29.0 Africa 3,928,719 25.7
European Union 2,804,965 27.1 India 3,767,866 24.7
Africa 2,543,757 24.5 Europe 2,537,787 16.6
China 1,361,360 13.1 European Union 1,856,985 12.2
Turkey 929,432 9.0 Sudan 1,104,620 7.2
Greece 711,577 6.9 Bangladesh 1,051,493 6.9
Syrian Arab Republic 651,867 6.3 Pakistan 824,098 5.4
Romania 631,419 6.1 Americas 751,823 4.9
Spain 539,405 5.2 France 603,040 4.0
Mali 529,373 5.1 South Sudan 466,672 3.1
Italy 424,841 4.1 Spain 410,977 2.7 Sudan 403,008 3.9 Greece 384,903 2.5 Somalia 396,217 3.8 Somalia 377,733 2.5 Iran 326,555 3.1 Indonesia 375,453 2.5 France 292,945 2.8 Turkey 344,192 2.3 Algeria 282,759 2.7 Iran 317,910 2.1 India 204,104 2.0 Niger 289,702 1.9 World 10,366,980 World 15,262,116
European Union produces itself a large amount (29.0%) of sheep milk, but many differences could be observed among the member states. The highest milk sheep production can be found in southern Europe, mainly in the Mediterranean area (Greece, Romania, Spain and Italy) (FAOSTAT, 2016). In 2016, Italy produced about 425 thousand tonnes of sheep
milk, representing 4.1% of the global production (FAOSTAT, 2016). In particular, in Italy ovine milk production represents 1.1% of the Italian gross production value in agriculture, with 87,174 farms and 7,149,000 ovine head all over the country (Ismea, 2016).
Sheep breeding system and milk in Sardinia
According to Ismea (2016), about twelve thousand sheep farms are located in Sardinia, representing the 20% of the Italian total, and Sardinia itself produces the 65% of Italian sheep milk. Around 3,300,000 ovine heads, mainly belonging to the Sarda breed, are farmed (Istat, 2016). Sarda breed is an autochthonous and specialized breed of the Island of Sardinia. Its milk is almost all used for cheese production. In particular, three Protected Designation of Origin (PDO) cheeses are manufactured, Pecorino Romano, Pecorino Sardo, and Fiore Sardo, products that are very closely associated with Sardinia. Sarda breed ewes produce on average 216 L of milk per lactation, ranging from about 140 L in primiparous to 228 L multiparous (≥3 lactations) (ASSONAPA, 2017).
Figure 2 Examples of sheep breeding systems in Sardinia
Sarda sheep farming system is strongly influenced by the Mediterranean climate, with dry summer and mild winter. As rainfalls occur mainly in autumn and spring, grass is available only in these seasons (mostly in spring). The husbandry is mainly semi-extensive,
with animals kept outdoors (Figure 2) and housed only during the night in the coldest l-2 months. The flocks graze natural pastures and winter fodder crops. Supplementation with hay and concentrates is provided during autumn and winter, when herbage availability is low.
The productive cycle of Sarda sheep milk is strictly seasonal: with few exceptions, in the typical system ewes have one lambing per year, concentrated in autumn (October/December) for mature ewes and in late winter/spring for primiparous ewes, respectively. Lambing occurs when vegetative growth resumes and allows the optimal exploitation of the herbage growth cycle (Figure 3).
Figure 3 Energy requirements and pasture availability (from Sitzia and Ruiz, 2016)
Mating season starts in late spring for mature ewes and in early autumn for ewe lambs. After a suckling period of about 30 days, lambs are slaughtered or weaned. Ewes are usually milked twice a day from January to July. Despite of the period of lambing, drying-off happens in July and it is simultaneous for yearlings and mature ewes, when a pronounced fall of
pasture quality happens for the summer drought (Carta et al., 1995; 2009; Cappio-Borlino et al., 1997a).
Sarda sheep breeding programme include selection for milk yield, and, starting from 2004, resistance to scrapie, a transmissible spongiform encephalopathy that affects sheep and goats (Carta et al., 2009).
Sheep milk composition
Many aspects of milk composition can influence milk technological properties. Milk consists of a liquid part, whose main component is water, and the dry matter. Dry matter is further composed by: a) fats and fat-soluble vitamins in emulsion; b) proteins and minerals linked to caseins in suspension; c) soluble proteins, fats and vitamins in solution; c) soluble carbohydrates, minerals, non-protein nitrogenous compounds (Pulina et al., 2001).
The average composition of milk varies among the species. While cow milk is expected to have minimal changes throughout the year, due to the year-round breeding, sheep and goat production is generally seasonal and changes occur across seasons (Balthazar et al., 2017; Barłowska et al., 2011). The chemical composition varies depending on animal feeding (dietary composition and availability), management, characteristics of the animal (breed, stage of lactation, body condition) and environmental factors such as cold and heat stress (Jaramillo et al., 2008; Nudda et al., 2014). Sheep milk contains higher total solids and fat and proteins than goat and cow milk. The higher content in fat and proteins makes it very suitable for cheese production. Although a large variability for both milk yield and composition can be observed across different breeds (Table 2). Carta et al. (2009) suggest caution in performing comparisons because a confounding effect can exist due to the genetic background of the breed, its management and their interaction.
Sarda breed milk, thanks to its high protein, fat and total solids concentrations, is very suitable for production of dairy products (Table 3), since cheese yield is strongly related to milk protein and fat.
Table 2 Milk in different sheep breeds
Breed Fat, % Protein, % Casein, % pH Lactose, % SCC, log cells/mL References
Brogna 6.60 5.74 - - 5.06 4.89 BITTANTE ET AL., 2014
Chios 4.97 5.18 - - 4.66 2.40 KOUTSOULI ET AL., 2017
East Friesian 6.64 5.14 - - - - HERNANDEZ ET AL.,2014
Foza 5.45 5.71 - - 5.28 4.35 BITTANTE ET AL., 2014
Guirra 8.72 6.64 5.17 6.60 4.59 5.51 JARAMILLO ET AL., 2008
Houtland 2.61 4.98 - - 4.89 - VITURRO ET AL., 2015
Karagouniko 5.51 5.35 - - 4.47 2.72 KOUTSOULI ET AL., 2017
Lamon 6.69 5.51 - - 5.08 5.96 BITTANTE ET AL., 2014
Manchega 8.68 6.39 4.97 6.72 4.21 5.23 JARAMILLO ET AL., 2008
Massese 6.44 5.71 4.73 - 4.49 3.05 MARTINI ET AL., 2008
Racka 4.48 5.83 - - 4.57 - VITURRO ET AL., 2015
Sarda 6.00 5.41 4.20 6.55 4.83 4.31 MANCA ET AL., 2016
Soay 4.49 5.71 - - 4.71 - VITURRO ET AL., 2015
Walachian 3.33 5.14 - - 5.18 - VITURRO ET AL., 2015
-. Not available
Table 3 Average composition of ovine milk produced in Sardinia in 2016 (ARA, 2017)
Milk Characteristic Mean
Fat, % 6.55
Protein, % 5.59
Casein, % 4.34
pH 6.72
Lactose, % 4.79
Somatic cells count, cells/mL of milk 1010 Total bacterial count, CFU/mL of milk 230
Milk proteins
Proteins are the main components of milk that influence milk suitability for cheese making (technological characteristics). Proteins can be divided into insoluble proteins (caseins) and soluble proteins (whey proteins) in lactoserum. Caseins are phosphoproteins synthesized in the mammary gland, whose function is to transport calcium phosphate, to provide a source of calcium, phosphorus and amino acids. Caseins are the most represented and the most important proteins in milk, constituting in sheep 76-83% of total proteins (Park et al., 2007). They are not homogenous substances and their behaviour changes in presence of calcium: while the calcium-sensitive caseins precipitate, the calcium-insensitive caseins are responsible for stabilizing the former against precipitation (Selvaggi et al., 2014a; 2014b). Precipitation occurs at pH lower than 4.6 or after rennet addition (Park et al., 2007). Encoded by genes mapped to chromosome 6, four types of casein exist: αs1-, αs2-, β- (calcium-sensitive
caseins) and κ- (calcium-insensitive caseins). Their proportion and characteristics varies among species, mainly because of the existence of different genetic polymorphism, i.e. mutations in the nucleotide sequence of the gene that result in different amino acid sequences (Amigo at al., 2000; Selvaggi et al., 2014a). Casein and calcium phosphate are combined in the form of colloidal aggregates, termed micelles. Micelles are composite structures where casein molecules are held together by different interactions (hydrophobic and electrostatic) and hydrogen bonds (Hickey et al. 2015). The κ-casein is mainly sited on the surface of micelles, to stabilize them by means of its hydrophilic amino-acids. The micelle structure is similar in cow, goat and sheep milk, but the latter has caseins richer in calcium and with intermediate size between goat and cow (Park et al., 2007; Selvaggi et al., 2014a).
Freezing point, °C 0.58
Whey protein represents 17-22% of total proteins and they separates from caseins during milk coagulation process. Whey proteins have high contents of sulfur amino acids, mainly methionine and cystine. Sheep milk has more whey protein than cow or goat milk. The principal whey proteins are β-lactoglobulin, α-lactalbumin and minor protein fractions as immunoglobulin, serumalbumin and lactoferrin (Nudda et al., 2003). β-lactoglobulin is the major whey protein in sheep, goat and mare milk, but its physiological function has not been well defined yet. α-lactalbumin is a calcium metalloprotein and it stimulates lactose synthesis in the mammary gland, playing a crucial role in milk secretion (Selvaggi et al., 2014a; 2014b). Lactoglobulins and immunoglobulins originate from blood and are highly hydrated. They show high heat resistance and act protective effect on caseins, impeding milk coagulation if their concentration is high.
Milk lipids
Lipids are the most important substances influencing the energetic value of milk and they account for many of the physical properties, manufacturing characteristics, and organoleptic qualities of milk and dairy products (Bauman et al., 2006). Lipids are emulsified in the aqueous phase as fat droplets, and can be found as singular globular shapes, coalesced fat globules or free fat. The number and average diameter of droplets vary depending on several elements, such as genetic, physiological and environmental factors (Martini et al., 2004). Comparing goat, cow and sheep milk, the latter has the smallest globules, with an average diameter of 3.30 μm (Park et al., 2007). Fat drops are rounded by a triple-layer membrane deriving from a portion of the mammary cell membrane, made mainly of phospholipids and glycoprotein. The membrane, thanks to its hydrophilic characteristics, has a major role in stabilizing droplets. The dispersion of fat influences the creaming rate and other important features of milk such as optical, rheological, and technological characteristics (colour, viscosity, conductance, separation rate, emulsion stability, and suitability for cheese
and butter production) (Barłowska et al., 2011). Increased quantities of long-chain fatty acids accelerate the rising of fat globules and the formation of a cream layer (Sevi et al., 2002).
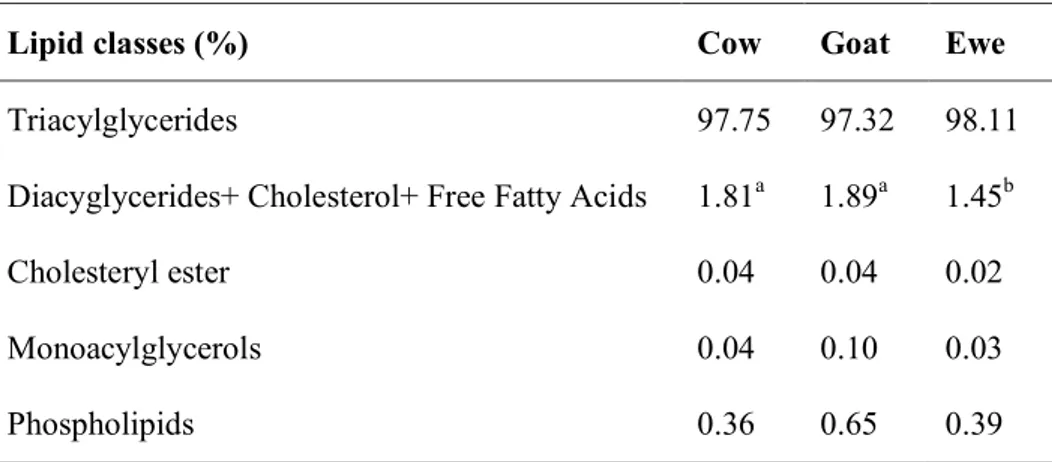
Triglycerides are the most represented lipids in milk (Table 4), representing more than 98% of sheep milk fat. Triacylglycerols are composed of glycerol and three fatty acids with different carbon chain lengths and degree of saturation, produced in the rough endoplasmic reticulum of alveolar cells. Furthermore, the lipid composition includes diacylglycerols, monoacylglycerols, cholesterol esters, phospholipids and liposoluble compounds (Park et al., 2007).
Table 2 Lipid classes content of cows, goats and ewes milk fat (adapted from Rodríguez-Alcalá and Fontecha, 2010).
Lipid classes (%) Cow Goat Ewe
Triacylglycerides 97.75 97.32 98.11
Diacyglycerides+ Cholesterol+ Free Fatty Acids 1.81a 1.89a 1.45b
Cholesteryl ester 0.04 0.04 0.02
Monoacylglycerols 0.04 0.10 0.03
Phospholipids 0.36 0.65 0.39
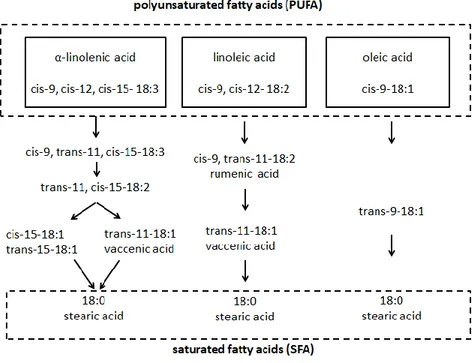
Milk composition in terms of fatty acids is plastic and can be modified by modifying diet (Pulina et al., 2005; Vera et al., 2009). The final content of fatty acids in milk and meat is influenced by biohydrogenation of unsaturated fatty acids, mainly linoleic and linolenic acids, (Figure 4) and their transformation to saturated ones (stearic acid) as a result of microbial ruminal activity(Maia et al., 2007).
Figure 4 Biohydrogenation pathways of α-linolenic, linoleic, and oleic acids (modified from Jenkins et al., 2008).
Short chain fatty acids (C6-C10) are synthesised ex novo in the mammary gland, starting from acetate and β-hidroxybutyrate produced by rumen fermentation. Medium chain fatty acids, with a chain length varying from 12 to 16, can originate either by ex novo synthesis or uptake from bloodstream. Sheep milk contains large quantities of short and medium chain fatty acids (caproic, caprylic, capric, and lauric), that contribute to its aroma (Park et al., 2007). Long chain fatty acids (C>18) come from lipids circulating in blood, originated from mobilization of body adipose tissues or from the diet. Furthermore, both mammary gland and intestine can modify fatty acids with a chain length varying from 14 to 18 by means of desaturase enzymes (Nudda et al., 2014). For example, the vaccenic acid, the most abundant trans fatty acid in goat and sheep milk, is desaturated in the mammary gland into rumenic acid, the major conjugated linoleic acid (CLA) isomer in milk (Scintu and Piredda, 2007). The contribution of the different sources (mobilized body fat, ex novo
synthesis by mammary gland, diet or rumen fermentation) to milk composition is influenced by the energy balance of the animal, lactation status and nutrient balance (Vera et al., 2009). More than 75% of fatty acids in sheep and goat milk are capric (C10:0), myristic (C14:0), palmitic (C16:0), stearic (C18:0), and total C18:1 (Park et al., 2007). Compared to cow, sheep milk and meat have a higher concentration of CLA positional and geometric isomers of linoleic acid, that have positive effects on human health (Park et al., 2007; Barłowska et al., 2011).
Lactose
Lactose is the main milk glucyde. It is entirely synthesized in the udder from precursors and in bovine it is responsible for 60% of the osmotic-coupled water flow that produces milk volume (Silanikove et al., 2000). The synthesis of lactose determines the rate of daily milk production, so its content shows little variation during lactation (Vera et al., 2009). The concentration of lactose follows the pattern of milk yield: it is low at the beginning of lactation in colostrum, rises and then decreases during lactation, with an opposite trend than that observed for protein, caseins and fat content (Bencini and Pulina, 1997; Sevi et al., 2000; Nudda et al., 2003). With the increase of number of lactations, Sevi et al. (2000) found a decrease in the lactose concentration in milk.
Somatic cell count
Different types of somatic cells can be found in milk: epithelial cells, blood cells and cytoplasmic particles. The proportions of the different categories vary during the lactation and they depend also on the health status of the animal. Indeed, most of the blood cells are lymphocytes, macrophages and leukocytes that reach the mammary gland as a response to a local infection (Bergonier and Berthelot, 2003; Albenzio et al., 2011). The Somatic Cell Count (SCC) can increase not only as a consequence of an inflammatory process (being the
most important cause of increase), but also for non-pathological conditions due to physiological processes, as changes in milking frequencies (Nudda et al., 2002), oestrus or advanced stage of lactation, that is the main cause of SCC increase in healthy udder (Raynal-Ljutovac et al., 2007). SCC determination generally uses fluoro-optoelectronic method, automated by Fossomatic devices (Foss Electric, Hillerød, Denmark), that shows a good accuracy (Raynal-Ljutovac et al., 2007).
Milk mineral components
The main mineral compounds in milk are calcium and phosphorus (in the form of phosphate), but also sodium, potassium, chloride, iodine, magnesium, and small amounts of iron are contained. In sheep Ca, P, Mg, Zn, Fe, and Cu are present in higher contents than in cow, but their presence is more variable depending on changes in diet and period of the year.
Minerals in milk show high interest for their nutritional and healthy value. Calcium, sodium and phosphorous have a high bioavailability and they have a major effect on structure and texture of cheese. Minerals can be in soluble phase (as Na, K and Cl) or can be associated with micelles (Ca, Mn, P). This influences, during cheese-making process, their lost in the whey or retention in the curd. Milk mineral content, together with lactose, is responsible for the osmotic balance of a healthy udder and it is correlated to milk yield (Park et al., 2007).
Milk vitamins
Milk contains both water-soluble and fat-soluble vitamins. In sheep milk vitamin A, thiamine, riboflavin, niacin, pantothenic acid, vitamin B6, biotin, vitamin B12 and vitamin C are higher than in cow and goat milk (Park et al., 2007). The greater content of vitamin A than cow milk corresponds to a lower quantity of β-carotene, resulting in a whiter colour (Barłowska et al., 2011). Sheep milk can be considered an important source of vitamin C, because of its concentration of about 4mg/100mL of milk.
Quality of sheep milk
Sheep milk quality is often considered as its capability to be transformed into cheese and dairy products. Cheese making requires milk coagulation, that occurs for the addition of rennet or acidification. The first step of rennet coagulation is enzymatic hydrolysis, where rennet cleaves k-caseins at Phe105-Met106 bond, originating para-k-Casein (residues 1-105) and casein-macropeptide (106-169). This transformation results in a reduction of repulsion, leading to the aggregation of the rennet-altered micelles (Lucey, 2002), that spontaneously expels whey. This process, termed syneresis, can occur by externally applying pressure onto the curd. The processing properties of milk, intended as the amount and quality of cheese that can be obtained from each litre of milk, can be evaluated through different methods. Since cheese yield is strongly related to milk protein and fat, it can be predicted through analytical determination of these parameters (Pirisi at al., 1994). Other methods refer to its clotting properties. Clotting properties are generally determined through the use of a mechanical lactodynamograph, as Formagraph instrument (Foss Electric A/S, Hillerød, Denmark), that provides a diagram illustrating formation and development of curd after the addition of rennet. Traditionally, milk-coagulation properties registered are: i) the renneting clotting time (RCT), which is the time when coagulation start appearing and casein micelles form visible flocks after the addition of rennet; ii) the curd firming time (k20), which is the rate of curd formation, and it measures how quickly the curd firms; iii) curd firmness (A30), which is the consistency of the curd measured 30 minutes after adding rennet (Bencini, 2002; Bittante et al., 2012).
Great variability exists in milk coagulation properties, depending on ruminant species (cattle, buffalo, sheep, and goats), breed within species, and individuals. The most of the studies refer to cows, while for small ruminants, and sheep particularly, milk coagulation properties are less known, even if they are heritable and their knowledge is very useful for the
dairy industry. Processing properties of milk can be affected by various factors, that are endogenous (depending on milk characteristics) or exogenous (related to the process).
Factors influencing milk yield, composition and processing properties vary depending on several issues, some of which can be controlled by the farmer, as feeding or milking technique, while others are specific of the animal (i.e. breed, age and parity, stage of lactation).
Genetic factors affecting milk yield, quality and composition
Milk yield is currently the selection criterion in most of dairy sheep breeds. The selection scheme of Sarda ewes, realized since the early 1960s, provides a genetic gain of 2.0 L/year. In sheep, heritability for fat and protein percentages is about 0.50-0.60 while milk, fat, and protein yields is lower, around 0.30. The phenotypic and genetic correlations between milk and fat and protein yields are positive and range between 0.77 and 0.93, whereas genetic correlation between milk yield and content are negative and show high variability (Carta et al., 2009).
A genetic factor that influences greatly cheese-making properties is the polymorphism in ovine milk proteins, strongly associated with quantitative and qualitative milk parameters (Amigo et al., 2000; Carta et al., 2009; Selvaggi et al., 2014a). The genetic variant of β-casein (in dairy cows) or αs1-casein (in goats) produces differences in texture and taste in cheese
(Coulon et al., 2004). In sheep, αs1-casein exist in eight different forms (A, B, C, D, E, F, H
and I), seven variants have been found for αs2-Casein (A, B, C, D, E, F, G) and five for β-CN
(A, B, C, X, Y). κ- Casein is considered monomorphic in sheep (Selvaggi et al., 2014a). The αs1-casein variants differ by amino acid substitutions and degree of
phosphorylation. The C variant shows higher total protein and casein content, smaller micelles diameters and higher clotting capacity. The D variant, detected also in Sarda breed, is
associated with detrimental effects to ovine milk, with lower casein content and poorer technological properties (Amigo at al., 2000; Carta et al., 2009; Selvaggi et al., 2014a).
In Merino sheep, the GG genotype for β-Casein is associated with an increase in milk production but lower protein and fat percentages, whereas the AA has the highest milk fat and protein percentages (Corral et al., 2010).
Three variants of β-lactoglobulin exist (A, B and C), whose influence on composition and cheese-making properties is controversial and no conclusive evidence exist about their effect (Giaccone et al., 2000; Selvaggi et al., 2014a;). Nudda et al. (2003) noticed in Sarda breed a significant depressive effect of B variant on milk yield.
The main objective of molecular genetics studies is discovering and mapping genetic markers and genes that control production, quality, fertility and health traits for increasing both knowledge of genetic mechanism and to maximise the genetic gain. The use of microsatellites on the sheep linkage map allowed to identify Quantitative Trait Loci (QTL), highly specific for each population, that affect several traits (e.g. milk traits, SCC, nematode resistance, FA contents in milk fat, and udder traits). QTL for lactation persistency and longer period of milkability in sheep were studied, but results suggest that these traits are not controlled by the same genes that control milk composition (Jonas et al., 2011). Since fat and protein contents have negative genetic correlation with milk yield, the selection criterion would lead to a reduction of the genetic gain of each trait. In this view, the potential advantage of gene-assisted selection applied to sheep seems to be attractive (Carta et al., 2009). At the moment, genes that encode enzymes directly involved in FA metabolism are under study and two genes with polymorphism influencing the content of fat and protein in milk and CLA are identified (Carta et al., 2009). These QTL, obtained through traditional linkage mapping studies, are not used in selection programs because of low significance levels and large confidence intervals. More recently, the availability of high efficient single
nucleotide polymorphism (SNP) typing technologies have made possible genome-wide association (GWA) analyses and genomic selection approach (Meuwissen et al., 2001) useful either to identify regions influencing traits of economic interest or to estimate genomic breeding values to score the selection candidates in breeding program, respectively. To date, only a few studies exist at genome wide scales in sheep aimed at quantifying the effects of single nucleotide polymorphism on milk characteristics and processing properties, whereas many more exist for cattle. The close phylogenetic relationship between sheep and cows promoted comparative studies on the Spanish Churra dairy sheep to assess the genetic variability of various genes influencing milk production traits in dairy cows (García-Fernández et al., 2011). Nevertheless, the associations between SNPs identified in these genes and milk production traits (test day milk yield, test day protein percentage and test day fat percentage) were not significant (García-Fernández et al., 2011), showing that outcomes of cattle cannot be completely referred to dairy small ruminants. Garcia-Gámez et al. (2012) conducted on Spanish Churra sheep a GWA analysis, identifying on chromosome 3 a QTL influencing milk protein and fat contents. The SNP with the highest significant association was placed on the α-lactalbumin gene, but further studies are required to establish if this SNP is the true causal polymorphism or it is in linkage disequilibrium with it. In Sarda breed, 29 SNPs are identified on the promoter region and 3’-UTR of the four casein genes, with a significant level of polymorphism. These SNPs may perform regulatory effects on genes associated with milk protein and casein contents and processing properties (rennet coagulation time, curd firming time and curd firmness) (Noce et al., 2016). For a greater quality in mapping QTL, the use of three approaches is suggested, one based on linkage analysis information, the other combing linkage disequilibrium and linkage analysis (LDLA) and the latter using a GWA analysis (Garcia-Gámez et al., 2013). In fact, while linkage analysis allowed to discover three significant QTL on sheep chromosome 2 influencing milk
yield, protein yield, and fat yield, the LDLA method identified 34 genome-wise significant QTL regions (Garcia-Gámez et al., 2013).
Nutritional and non-nutritional factors affecting milk yield, quality and composition
Feeding
Feeding is the environmental factor that most strongly impacts sheep milk composition, particularly for highly productive animals. The most relevant factors influencing milk yield and composition are net energy intake, protein and fibre content of the diet.
Milk fat concentration is easier to modify by nutritional means than protein content. Ewe’s net energy balance strongly influences fat content in milk, especially in the first part of lactation. Milk fat depends also on the dietary content of non-degradable fibre, that is positively correlated to milk fat content for a reduction in milk production. Fat supplements and their characteristics (like doses, physical form protecting against rumen fermentation, etc.) play an important role in increasing fat percentages and modifying the content in milk of fatty acids useful for human health, such as conjugated linoleic acid and omega-3 fatty acids (Nudda et al., 2001; Pulina et al., 2006; Voutzourakis et al., 2014).
Milk protein content is less alterable by diet. Generally, a higher energy content of the diet, and particularly a higher quantity of carbohydrates, corresponds to an increase of the percentage of milk protein, but diet protein and amino acid supplementation influence only to a limited extent milk protein amount and its characteristics (Nudda et al., 2001; Pulina et al., 2006; Voutzourakis et al., 2014).
Diet impacts also the content in vitamin A, carotenoids and tocopherols, minerals as Mn, Co, I, Se and other compounds as condensed tannins (Voutzourakis et al., 2014), especially in milk from pasture fed animals.
Physiological factors
Persistency of lactation, the rate of milk yield decrease after the lactation peak, depends on numerous physiological factors. Many hormones are involved in maintaining lactation in sheep, as growth hormone, prolactin and oxytocin. Growth hormone stimulates the production of insulin-like growth factor-I (IGF-I), recognized by IGF-I receptors in the mammary gland, with a positive effect on yield and characteristics of milk (Pulina et al., 2001; 2007). Prolactin influences milk synthesis by inhibiting the mammary apoptosis. Oxytocin influences myoepithelial cell contraction and milk let down and may also be involved in mammary cell maintenance and metabolism (Pulina et al., 2007).
Furthermore, milk constituents can modulate milk secretion. Some fractions of proteins contained in milk, if not removed by milking, carry out chemical inhibition and influence the rate of secretion when milk is stored in the secretory tissue (Pulina et al., 2007). This behaviour has been confirmed by experiments where unilateral frequent milking has no effect on milk secretion by the other udder half (Nudda et al., 2002). The degree of feed-back inhibition is determined by the concentration of inhibitor in the alveolar lumen (Wilde at al., 1988).
Plasmin-Plasminogen system is a physiological pathway affecting milk yield and characteristics able to carry on short-term regulation of milk secretion and induction of milk involution in case of milk stasis (Silanikove, 2016). Plasmin-plasminogen system is a complex protease-protease inhibitor system (Figure 5), formed by active and inactive forms, respectively Plasmin (PL) and plasminogen (PLG), modulated by the plasminogen-activator and the inhibitors and influenced by somatic cells (Silanikove et al., 2000, 2016; Kelly at al., 2006; Pulina et al., 2007; Ismail and Nielsen, 2010).
Figure 5 Plasminogen-plasmin system in milk (adapted from Ismail and Nielsen, 2010)
PL is a protease responsible in milk for the hydrolysis of α- and β- casein, leading to the formation of γ- casein and boiling-resistant peptides (proteose peptone), which then diffuse into the whey. This decomposition occurs both in the udder and during storage, modifying protein patterns of milk. PL originates from blood and enters milk in soluble form, then associating with casein micelles (Kelly at al., 2006), mainly in its inactive form, plasminogen (PLG).
Sevi et al. (2004) found in Comisana ewes significantly higher presence of both plasmin and plasminogen with the advance of lactation, regardless of the lambing season. Since plasmin plasminogen system seems to be involved in the gradual involution of the mammary gland, its effect increases as lactation proceeds. Levels of PL and PLG in milk are higher at the end of lactation, in older animals, and in mastitic milk, as it happens in dairy cows (Ismail and Nielsen, 2010).
Lambing season, parity and type of lambing
Lambing season can influence persistency of lactation because of the different availability and quality of pasture, particularly in extensive systems. If lambing occurs when the availability of forage is higher, a higher milk production is expected. The characteristics of milk produced by sheep that lambed in the spring can be related to the presence of high
quantities of fresh forage in their diet (Martini et al., 2008). Considering that lactation occurs when days are lengthening, photoperiod can be another element of influence. In fact, in dairy ewes a higher number of hours of light seems to coincide to higher feed intake and milk production (Pulina et al., 2007). Carta et al. (1995) found that seasonal period of production had an important influence on milk yield in Sarda breed, ranging from - 332 mL in August to + 206 mL in April (-31% and +19% of overall mean). Seasonal effects were considerable on milk composition too, since fat yield varied from -19.2 g to +11.7 g (-27% and +17% of overall mean) and protein yield from - 17 g to + 11 g (-28% and +18% of overall mean). Furthermore, while fat percentages changed irregularly, protein percentages tended to remain constant.
Number of parity influences milk yield and the higher production is registered after the third or fourth lactation (Carta et al., 1995; Bencini and Pulina, 1997; Cappio-Borlino et al., 1997a, 1997b; Macciotta et al., 1999: Nudda et al., 2003; Jaramillo et al., 2008). The effect of the order of parity and age is difficult to be distinguished, but younger ewes produce less milk than older ones and milk quality is strongly affected by the increase of the number of lactations.
Higher milk yield is registered for multiple births. This can be explained by the influence of placental weight on the development of the mammary gland in ovine breed.
Stage of lactation
Stage of lactation is an important source of variation of milk yield and components. After parturition, milk production starts and daily yields increase rapidly for the first few weeks. Around the third to fifth week of lactation, peak yield is reached. The lactation peak is the highest daily yield reached during lactation. After that, lactation declines.(Figure 6) Generally, the greater persistency is, the greater the total milk produced all over lactation (Bencini and Pulina, 1997; Pulina et al., 2007).
Figure 6 Lactation curve typologies in Sarda breed. Filled squares: classical lactation curve; solid line: atypical curve without peak; dashed line: double peak curve (from Pulina and Bencini, 2007).
With regards to composition, the concentration of fat (Figure 7a), proteins (Figure 7b), total solids and somatic cells is higher at the beginning and at the end of lactation than at peak lactation, while lactose follows lactation yield. Stage of lactation also affects mineral contents: chloride and magnesium tend to increase in milk, while potassium decreases during lactation (Bencini and Pulina, 1997).
Figure 7 Milk a) fat and b) protein production along lactation (from Pulina and Bencini, 2007)
Weaning system, milking techniques and frequency
Weaning technique can affect milk yield after weaning. Studies carried out in the first 30 days of lactation showed similar length of average lactation period for different weaning systems. Nevertheless, higher milk yield was recorded when ewes were suckled for part of the day and machine milked once in the morning, after separation from lambs during the night. This was probably due to a more efficient udder evacuation by the suckling lambs combined with machine milking (Pulina et al., 2007).
The rate of milk secretion is also influenced by milking techniques and frequency. An high quality milk can be obtained with a regular and complete milking. A reduction of milking frequency can accelerate the involution process of the mammary gland and reduce lactation persistency, with losses in milk production, even if the response is not constant across breeds (Pulina et al., 2007; Castillo et al., 2008; Koutsouli et al., 2017). The reduction of milking frequency affects also milk composition, resulting in higher protein and lower lactose content and, for some breeds (e.g. Sarda), in higher SCC values (Nudda et al., 2002). The decline of milk yield leads on to losses in the total fat (Castillo et al., 2008; Koutsouli et al., 2017) and the total protein yield (Koutsouli et al., 2017).
Hand milking and machine milking do not produce differences on the concentration of protein and fat in the milk, but differences can occur because of worse hygiene conditions, resulting the former in higher microbial counts and SCC (Bencini and Pulina, 1997; Gonzalo et al., 2005).
Udder morphology and cistern dimension
The number of mammary secretory cells and their metabolic activity influence the yield (Wilde at al., 1987), but some milk constituents exert inhibiting action on the rate of secretion when milk is stored in the secretory tissue. Since these components are inactive in the cistern, their influence should be fainter in animals with wider cisterns, because less milk
is in contact with the alveoli, while a large part keeps in the mammary cistern. Furthermore, mammary gland size and cistern dimension seem to have positive effect on milk production (Pulina et al., 2007). Because of the diffusion of milking machines, udder morphology has become an important trait influencing time and costs of milking. In fact low-implanted teats and low depth udders (i.e., close to the abdomen) are easier to be completely emptied. Selective breeding focuses on udder conformation traits and morphology to improve machine milkability, even if direct improvement of udder depth is difficult because of its high negative genetic correlation with milk yield (Carta et al., 2009).
Mastitis and somatic cell count
Mastitis is an inflammation of the udder that has a major role in the impairment of milk yield and quality. It has important economic and hygienic effects. Mastitis is generally caused by pathogenic bacteria belonging to various etiological groups, that exert physical damage to the epithelial cells of the mammary gland.
It is possible to distinguish between clinical and subclinical mastitis. Clinical mastitis have general and local signs (as, for example, fever, anorexia, udder inflammation and oedema) and the major pathogens causative are Escherichia coli, Staphylococcus aureus,and streptococci. Sub-clinical mastitis is more complicated to be detected, because of the absence of external symptoms, and it produces quantitative and qualitative functional modifications, as an increase in somatic cell count. It is generally caused by Coagulase-Negative Staphylococci (CNS) (Auldist and Hubble, 1998; Gonzalo et al., 2002; Bergonier and Berthelot, 2003; Rovai et al., 2014). Prevalence of clinical mastitis in dairy sheep is generally smaller than 5%, while subclinical mastitis infections range from 5 to 30% per lactation (Bergonier and Berthelot, 2003): these percentages make the latter a crucial phenomenon influencing milk yield and cheese-making. In fact, as often subclinical mastitis is not identified, milk coming from infected udders goes into the bulk milk tank, worsening its
characteristics (Gonzalo et al., 2002). Numerous authors (Gonzalo et al., 2002; Bergonier and Berthelot, 2003; Martí De Olives et al., 2013) emphasized the need to prevent subclinical mastitis in dairy sheep to improve the quality of milk and minimize losses.
The global effect of an intramammary infection depends on different elements, such as infection severity, type of bacteria involved and number of infected glands (1 or 2). Gonzalo et al. (2002) found in Churra breed losses in milk yield that ranged between 2.6% and 10.1% in accord to type of pathogens and the uni- or bilateral distribution of the infection. Martí De Olives et al. (2013), in a study on Manchega ewes on a half-udder basis, found that the drop in individual milk production depended on the stage of lactation. When the onset of infection happened in the first week postpartum, losses were of 17% of production compared to a healthy sheep, while in ewes infected later during lactation losses were of 15%. An earlier onset of subclinical mastitis during lactation in Comisana ewes was described by Sevi et al. (2000) as number of lactations decreased. This may be explained by a less efficient natural defence mechanisms in younger ewes, probably because the endocrine-metabolic status and immune system development can play a role on susceptivity and sensitivity to mastitis (Albenzio at al., 2002).
SCC values can be useful to differentiate ewe milk for its overall quality and to establish whether a sheep is affected by mastitis or not, but huge disparity exist in the literature with regards to the SCC thresholds (Albenzio et al., 2002, 2011; Pulina et al., 2007; Raynal-Ljutovac et al., 2007). High values of SCC influence many characteristics of milk, and Albenzio et al. (2011) found in dairy sheep an impairment of udder efficiency starting from 300,000 cells/mL. The same authors suggested to consider the range from 300,000 to 1,000,000 cells/mL as a transition from normal to mastitic milk.
Even if the wider bibliography is referred to cow’s milk, also in sheep and goats the negative relationship between a high SCC and milk yield and quality has been confirmed.
Nudda et al. (2003) found in Sarda breed a significant reduction of milk yield and lactose for SCC greater than 1,000,000 cells/mL, as well as in Churra and Comisana breed (Gonzalo et al., 2002; Albenzio et al., 2011).
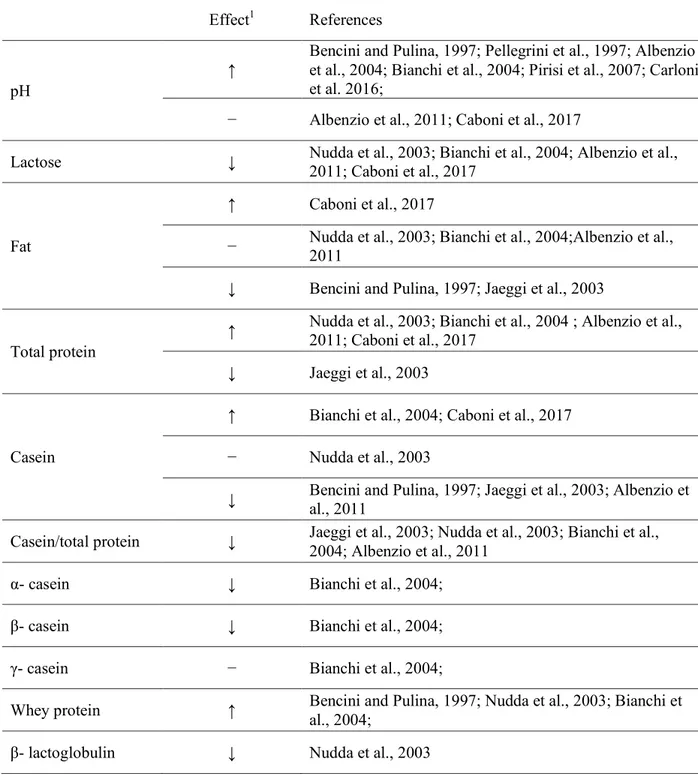
Various aspects of milk composition are related to high SCC (Table 5).
Table 3 Changes in sheep milk composition associated with an increase of SCC
Effect1 References
pH
↑ Bencini and Pulina, 1997; Pellegrini et al., 1997; Albenzio et al., 2004; Bianchi et al., 2004; Pirisi et al., 2007; Carloni et al. 2016;
− Albenzio et al., 2011; Caboni et al., 2017
Lactose ↓ Nudda et al., 2003; Bianchi et al., 2004; Albenzio et al., 2011; Caboni et al., 2017
Fat
↑ Caboni et al., 2017
− Nudda et al., 2003; Bianchi et al., 2004;Albenzio et al., 2011 ↓ Bencini and Pulina, 1997; Jaeggi et al., 2003
Total protein
↑ Nudda et al., 2003; Bianchi et al., 2004 ; Albenzio et al., 2011; Caboni et al., 2017 ↓ Jaeggi et al., 2003
Casein
↑ Bianchi et al., 2004; Caboni et al., 2017 − Nudda et al., 2003
↓ Bencini and Pulina, 1997; Jaeggi et al., 2003; Albenzio et al., 2011 Casein/total protein ↓ Jaeggi et al., 2003; Nudda et al., 2003; Bianchi et al., 2004; Albenzio et al., 2011
α- casein ↓ Bianchi et al., 2004;
β- casein ↓ Bianchi et al., 2004;
γ- casein − Bianchi et al., 2004;
Whey protein ↑ Bencini and Pulina, 1997; Nudda et al., 2003; Bianchi et al., 2004; β- lactoglobulin ↓ Nudda et al., 2003
Serum albumin ↑ Nudda et al., 2003
Immunoglobulin ↑ Nudda et al., 2003
↑ increase; ↓ decrease; − not significant effect
High SCC in milk can perform an enhanced proteolytic and lipolytic activity through the release of enzymes, leading to modifications in the protein characteristics and resulting in reduction of cheese yield and quality (Auldist and Hubble, 1998; Hurley et al., 2000; Albenzio at al., 2004; Silanikove et al., 2006; Raynal-Ljutovac et al., 2007; Albenzio et al., 2011). For values of SCC greater than 1,000,000 cells/mL, higher contents and activity of plasmin and an increase of pH were found (Albenzio et al., 2004;2011; Bianchi et al., 2004). The effect of high SCC on the fat percentage in sheep milk has not been clarified yet but fat content seems generally to decrease with the increase of SCC (Bencini and Pulina, 1997; Jaeggi et al., 2003). Such a trend can be explained with a reduced synthetic and secretory capacity of the mammary gland and with an enhancement of the lipase activity in milk due to the release of lysosomal enzymes of somatic cells, as reported for dairy cows by Auldist and Hubble (1998). An increased lipolysis produces higher levels of free fatty acids, causing off-flavours. Furthermore, high SCC produces a reduction in casein concentrations, due to degradation of casein by proteinases originating from bacteria, leucocytes, leucocytes or the blood (Auldist and Hubble, 1998). SCC increases can modify the cheese-making aptitude of the milk also through changes in concentration of minerals.
Furthermore, bulk tank SCC had a statistically significant correlation with total bacterial count, suggesting the application of programs to improve hygiene and health quality in bulk tank milk involving both variables (Gonzalo et al., 2005).
Total bacterial count
Milk contains microorganisms that can be advantageous for transformation into cheeses, such as Lactobacillus spp., Lactococcus spp., Streptococcus spp., while others can be unfavourable. In fact, some microorganisms can cause human diseases (e.g. Listeria, Salmonella, Brucella) or can negatively compromise the maturation of the dairy products (e.g. Enterobacteriaceae, coliforms, psychrotrophs, Clostridium spp.) (Bencini and Pulina, 1997).
The total bacterial count (TBC) is the number of aerobic microorganisms which develop in a millilitre of milk at a temperature of 30°C, expressed as a number of colony-forming units (CFU/mL). The maximum thresholds for sheep and goat milk are ruled by the EU Directives. The routine analysis in dairy laboratories uses automated flow cytometry devices, such as Bactoscan FC, Foss Electric. This device does not allow differentiation of the milk flora (lactic, psychrotrophic, pathogenic bacteria) (Pirisi at al., 2007).
The microbiological safety of milk, the occurrence of undesirable bacteria and the quality control are delicate tasks involving different conditions. At the farm level, contamination can come from different sources such as flora and pathogens present in beds and getting in touch with the external surface of the udder and teats, milking facilities, wash water, milking system, or animal health (e.g. mastitis) (Elmoslemany et al., 2010; de Garnica et al., 2013). Contamination can be avoided by applying correct milking and milk handling procedures (Bencini and Pulina, 1997). In bovine, Jayarao et al. (2004) found that herd size and farm management practices had considerable influence both on somatic cell and bacterial counts in bulk tank milk. In fact, as the herd size increased, so did the use of automatic milking equipment that allows better hygiene standards. The lower values of TBC and SCC were found where automatic milking detachers, sand as bedding material, and strategies of mastitis prevention and control (such as dip cups for teat dipping instead of spraying, and pre- and post-dipping) were practiced. For instance, de Garnica et al. (2013) found in ovine milk
TBC higher than the ones reported in literature for cattle. An explanation can be found in the management practise in sheep, as the absence of teat washing before milking, that is not a usual practice in dairy ewes, and poorer facilities than those for cattle (Bergonier and Berthelot, 2003; de Garnica et al., 2013; Gonzalo et al., 2006). Furthermore, as hygiene can vary within the same flock depending on the season and management practices (as confinement versus grazing), in winter higher concentrations of psychrotrophic and coliform flora were noticed (de Garnica et al., 2013). Pirisi et al. (2007) pointed up that the lack of milking machines and refrigeration tanks at the farm and transport of milk in unsuitable vehicles have a notably influence on high TBC.
Stress
Sheep can face different sources of stress, that affect quantity and quality of milk produced, impairing the efficiency. In fact stress leads to the activation of the hypothalamus-pituitary-adrenocortical axis and liberates cortisol into blood plasma, resulting in a decrease of milk synthesis (Silanikove et al., 2000). Management practices are potential stressing factors, because sheep and goats suffer sudden from changes in rearing practices (e.g. time, place and stockmen involved in milking or when regrouping and relocation occur frequently) or excessive and rough handling (Sevi et al., 2009).
Heat stress
Weather can determine stressful conditions, producing a detrimental impact on production when environmental temperature and humidity fall outside the thermal comfort zone. The sensitivity to heat stress varies among species and within the same species, it depends on numerous factors such as the age or feeding characteristics. Effects of heat stress on production are widely studied on cattle, while only a few studies exist on sheep (Finocchiaro et al., 2005; Peana et al., 2007a; 2007b; 2017; Ramon et al., 2016; Sevi et al.,
2001). In spite of that, it is widely accepted that exposure to adverse weather conditions has important economic effects, because it leads to losses in milk production, morbidity and mortality, impairing production and reproduction traits of the animal (Figure 6).
Figure 8 Heat stress influence on different activities in sheep (adapted from Sejian et al., 2017)
Although heat stress occurs more frequently in hot climates, even in Mediterranean environments animals experience this state. In fact, temperatures reached in Mediterranean area during the summer are above the comfort zone and often hot conditions happen quickly and they are prolonged, impeding the animal to acclimatize. Several studies (West et al., 2003; Finocchiaro et al., 2005; Sevi and Caroprese, 2012) suggested an improvement of animal welfare and productivity in hot climates by means of both management techniques for reducing heat stress and sheep breeding programmes including multi trait selection.
Thermoregulation and heat dissipation mechanisms
The control of cellular reactions and physiological responses of metabolism require homeotherms to keep their temperature variation in a fairly narrow range. The thermoneutral zone is the temperature interval at which the animal expends the less energy to maintain its temperature constant, and produces the less metabolic heat (Kadzere et al., 2002; Al-Dawood, 2017). Above the comfort zone, the animal has to apply behavioural and physiological strategies of thermic dissipation for increasing heat loss and reducing heat production with an increase in animal maintenance requirements, because part of the energy is used for thermoregulation. In spite of that, with the exposure to heat, dry matter intake decreases significantly. In dairy cattle, dry matter intake drops of 0.85 kg for each degree (°C) of increase in the mean air temperature beyond the thermal comfort zone (West et al., 2003). The decline in dry matter intake causes a reduction in metabolic heat generated by digestion. Other consequences are reduction of feed transit through the digestive tract, reduction of rumination and nutrient absorption, which result in altered performances and in a decrease of milk yield. Immediate responses as behavioural changes occur, such as increased water intake, sweating and panting, and heart rate reduction. If the exposure to heat is protracted, changes interest physiological processes: modification of rectal temperature, heart and respiratory rate; alteration of enzyme and hormones production; modification of metabolism of water, protein and mineral balances (Marai et al., 2007; Bernabucci et al., 2010; Al-Dawood, 2017). When the thermal stress on the animal is too high, body temperature rises up to hyperthermia and can lead to death.
Heat is transferred to environment through physiological processes. Four main ways for heat exchange exist: conduction, convection, radiation and evaporation. Conduction, convection and radiation are based on a thermal gradient, thus their efficiency is reduced when air temperature rises. On the other hand, evaporation is based on a vapour pressure
gradient, and it is the most effective mean to lose heat at high temperature, sometimes compromised by high relative humidity. When heat stress occurs, external temperature rises and heat exchanges between the animal and the environment are inhibited. Sensitivity to heat stress can be increased by genetic selection for production traits: high productive animals produce higher metabolic heat and are more vulnerable and sensitive because of higher body weight, larger nutrient intake and more effective use of nutrients. The relationship between high production and susceptivity to heat could be explained also by the surplus of heat associated to the production of extra milk (Kadzere et al., 2002; Bernabucci et al., 2010).
For the majority of species, the thermoneutral zone can be placed between 13° C and 18°C (Peana, 2005). For lactating cows it is placed between 5 and 25°C (Kadzere et al., 2002; West, 2003). Sheep and goats, in spite of being considered animals adapted to harsh environment, are more sensible than how generally estimated, especially when high temperature persist for long periods (Peana et al., 2007a). Ramón et al. (2016) found in Manchega sheep a comfort region between 10 and 22°C for daily average temperature, and 18 and 30°C for daily maximum temperature.
The stressful effects of heat can vary depending on several environmental elements. Components such as radiation, air temperature and movement, humidity can influence the dissipation of heat. So, management precaution can produce differences in the effect of the same climatic conditions. Shade can improve welfare and production of animals, reducing solar accumulation, and protecting them from direct and indirect radiation (Armstrong, 1994; Sevi et al., 2001). At high temperature, air movement around the animal can modify the rate of heat loss, because high speed of wind can support heat dissipation by means of a more intense evaporation. Also precipitation has a positive effect in alleviating heat stress, because rain can wet animal coat. High air humidity can result in a discomfort, because it compromises evaporative cooling (West, 2003). The colour of the coat and its texture impact
the heat gain. A black-coated animal will have a higher absorbance than a white one, influencing heat exchanges through radiation (Silanikove, 2000). Heat stress can be relieved by a correct diet and water availability (Marai et al., 2007), and changing of feeding time to the afternoon, to reduce heat production in the warmer hours of the day (Sevi et al., 2001). Water intake increases up to 50% during heat stress, while water losses in the faeces and urine decrease (Marai et al., 2007). In addition, minimum nocturnal temperatures are crucial in hot weather. In Holstein cows, if a cold period of less than 21°C occurs at night for 3-6 hours, the loss of heat gained is favoured and the effects of heat stress on milk production are reduced (Igono el al., 1992). In sheep, a reduction of THI below 72 for a number of hours relieves part of the stress associated with diurnal heat and humidity (Sevi et al., 2001).
Estimation of heat stress degree
Evaluation of heat stress can use different parameters. Direct measurements on animals, such as rectal temperature, respiration rate and heart rate, in spite of being very sensitive indicators of thermal stress, are really expensive to be defined and not feasible on a large scale. It is important to determine thresholds of heat stress in a cheap determination. Scientists developed biometeorological indices to predict when animals start experiencing heat stress. Many of these combine different environmental factors, but their use is reduced by the poor availability of data. An indicator of thermal climatic conditions often used is the Temperature Humidity Index (THI). The THI is a thermal index that represents the combined effect of humidity and temperature, quantifying heat stress in relation to these climatic parameters. Humidity and temperature are two variables that can be easily measured and obtained from meteorological services. In literature, a number of THI exist (Table 6), weighting differently the effect of temperature and humidity.
Table 4 Equations for calculating THI (modified from Berman et al., 2016)
THI Equation Unit Reference
0.4∙ (Tdb + Twb) + 15 °F units Thom, 1959
1.8Tdb– (1 – RH : 100)∙(Tdb – 14.3) + 32 °C units Kliber, 1964
(0.55∙ Tdb + 0.2∙ Tdp) + 15 °F units Cargill and Stewart, 1966 (1.8Tdb+ 32) − [(0.55 − 0.55∙ RH): 100 ] ∙
[(1.8 Tdb+ 32) − 58]
°C units Kelly and Bond, 1971
0.72 ∙ (Tdb + Twb) + 40.6 °C units Maust et al., 1972 Tdb – (0.55 – 0.55∙ RH) ∙(Tdb−58) °F units Ingraham et al., 1974 Tdb + 0.36∙ Tdp + 41.2 °C units Oliveira and Esmay, 1982 0.8∙ Tdb + RH ∙(Tdb – 14.4)+ 46.4 °C units Hahn et al., 2009
Tdb dry bulb temperature; Tdp dew point temperature; Twb wet bulb temperature; RH relative humidity
Humidity is an important factor influencing the evaporative loss through sweating and panting, because evaporative rate differs depending on the saturation of air. Air humidity can be expressed as wet bulb temperature (Thom, 1959; Maust et al., 1972), relative humidity (Kelly and Bond, 1971; Ingraham et al., 1974; Hahn et al., 2009) or dew point temperature (Cargill and Stewart, 1966; Oliveira and Esmay, 1982). Relative humidity (RH) gives information about the air saturation at a given temperature. It is expressed as a percentage and it is the ratio between the measured vapour pressure and the saturated vapour pressure at the same temperature: RH depends on the dry bulb temperature. Keeping constant the quantity of vapour (grams) in each kilogram of dry air, RH raises when T increases. In fact, at a lower air temperature, miscibility of air steam decreases. The dew point temperature (Tdp) is the
temperature at which the measured vapour pressure is equal to the saturated vapour pressure and RH is 100%. Wet bulb temperature (Twb) is the temperature that air would have if it were
is covered by a water-wetted cloth. Air flow produces evaporation of water, removing heat from the bulb.
A recent study by Berman et al. (2016) showed that temperature and humidity have a different weight in the variance of THI values. Assessing by regression procedures the relative weights of the THI components, Berman et al. (2016) observed that the temperature resulted as the major component explaining from 82 to 95% of THI variance. In spite of accounting only for 5 to 12% of THI variance, relative humidity has a great importance in heat stress. At high temperature, a rise in RH reduces evaporation and increases the intensity of stress. This behaviour results in a higher rectal temperature, reduction of feed intake and reduced milk production, as demonstrated in studies that analyse the production at the same temperature but with different percentages of RH (Kadzere et al., 2003).
Temperature humidity index is often represented as a graphical scale (Figure 6), showing if the animal suffers a stress, depending on temperature and humidity, since different temperatures and humidities can produce the same THI.
Normal: ≤ 74 Alert: 75-78 Danger: 79-83 Emergency: ≥84
Figure 9 Temperature-Humidity Index (THI) chart (from Hahn et al., 2009)
Various THI can be calculated according to the use of different temperatures (average, minimum and maximum) and humidity (average, minimum or maximum) registered during the day (Ravagnolo et al., 2000; Finocchiaro et al., 2005; Peana et al., 2007b; 2017; Brügemann et al., 2012; Bertocchi et al., 2014). THI maximum includes daily highest temperature and minimum humidity and it is representative of the worst daily environmental conditions. THI minimum is calculated using daily minimum temperature and maximum humidity and it is generally considered as indicator of refers night conditions; while average THI utilizes daily average values of both temperature and humidity.
Furthermore, a delay in the full impact of climatic variables on production exists. This effect can be ascribed to the reduction of feed intake, deferring between intake and utilization of nutrients, or variations in the endocrine status of the animal (West, 2003; Bertocchi et al., 2014). For this reason, Finocchiaro et al. (2005) used meteorological data referred to a period of four days before the day of milk recording, even if little differences were found, probably because the stable weather in the sampling period. On the contrary, Ramon et al. (2016) ascribe the greater effect on milk yield to weather conditions on the test day and the two previous days, with a reduced effect of conditions in the preceding days.
Effects of heat stress on milk production
One of the main economic influences of heat stress in dairy animals is the decrease in quantity and quality of milk. THI threshold that indicates negative effects on milk yield can greatly vary across species, and within the same species across breeds. In cows, the critical values for minimum, average and maximum THI are estimated in 64, 72, and 76, respectively (West, 2003), even if reduction in milk yield for highly productive cows is registered at an
average THI around 68 (Bernabucci et al., 2010). In dairy sheep, negative correlations are registered for milk yield and maximum daily temperature or THI and positive correlations with air humidity decreases. For Valle del Belice breed, losses in milk production are reported at a THI equal to 23 (calculated using the equation by Kelly and Bond, corresponding to a value around 73) and, beyond this value, each unit of increase in THI produced a decrease of 4.2% in daily milk yield. (Finocchiaro et al., 2005). In Manchega breed, the comfort region for milk yield is placed between 11.5-21.0°C for average temperature and 19.1-29.6°C for the maximum temperature, corresponding to values of 10.3-18.0 for average THI and of 13.9- 22.0 maximum daily THI (calculated using the equation by Kelly and Bond). The decay in production was of 1-5 g/d for milk yield for each °C (or THI unit) above the threshold (Ramon et al., 2016). In Comisana breed not provided with shade in the summer, milk yield was approximately 20% lower when temperature exceeded 35°C, with values of THI greater than 80 (Sevi et al., 2001). In Sarda breed, milk yield decreased at average and maximum THI higher than 65 and 68 (Peana et al., 2017). A daily decrement of milk yield up to 15% (about 0.30 kg/d per head) was detected when maximum temperatures were higher than 21-24°C and mean temperatures overcome 15-21°C. When average THI passed from 60-65 to 72-75 the reduction of milk yield was of 20% (0.38 kg/d per head) (Peana et al., 2007b). These data show how sensitive sheep are to heat stress, in spite of the general conviction of their resistance.
In dairy cattle suffering heat stress, milk yield undergoes a rapid and acute (within 24 h) reduction and changes occur on its composition. Fat and protein percentages increase, even not compensating for the drops in yields caused by the fall in milk yield. The reduction in milk secretion originates from the increased activity of plasmin-plasminogen system: β-casein is cleaved and β-Casein-(1–28)-fragment is created, blocking the apical membrane of mammary epithelial cells (Silanikove et al., 2009). Also in ewe milk exposure to high