UNIVERSITA’ DEGLI STUDI DI SASSARI
CORSO DI DOTTORATO DI RICERCA
Scienze Agrarie
Curriculum Biotecnologie microbiche agroalimentari Ciclo XXIX
The ability of ovine whey powder to improve quality of
Sardinian bakery products
Dr. Nicola Secchi
Coordinatore del Corso Prof. Antonello Cannas
Referente di Curriculum Dr. Severino Zara
Docente Guida Dr. Costantino Fadda
1 Introduction ... 5
1.1 Typical bakery products in Sardinia ... 5
1.2 The raw material for bakery products ... 7
1.3 The role of water in the bakery products ... 9
1.4 Techniques to preserve high quality in bakery products ... 11
1.5 Retrogradation of starch ... 14
1.6 Whey powders (WP) in bakery products ... 15
1.7 Objectives ... 17
1.8 References ... 18
2 The role of ovine whey powder in improving the properties of a semolina-based dough for baking ... 21
2.1 Introduction ... 21
2.2 Materials and Methods ... 22
2.1. Raw materials, dough preparation and analyses ... 22
2.2. Stress relaxation test ... 23
2.3. Leavening trial ... 24
2.4. Fourier transform infrared (FT-IR) spectroscopy ... 24
2.5. Statistical analysis ... 25
2.3 Results and Discussion ... 26
3.1. Characteristics of LGSs and ovine whey powders ... 26
3.2. Effect of ovine whey powders on rheological and leavening properties of the dough ... 26
3.2. Effect of whey powders on the secondary structure of gluten ... 29
2.4 Conclusions ... 31
2.5 Figures and tables ... 33
2.6 References ... 45
3 The ability of ovine whey powder to improve quality of Sardinian breads ... 47
3.1 Introduction ... 47
3.2 Materials and methods ... 48
3.2.1 Bread making process ... 48
3.2.2 Chemical-physical analyses ... 50
3.2.3 Texture analysis ... 50
3.2.4 NIR FT-Raman Spectroscopy ... 51
3.2.5 Bread image analysis ... 52
3.2.6 Colour determination ... 52
3.2.7 Sensory analysis ... 53
3.2.8 Statistical analysis ... 53
3.3 Results and Discussion ... 54
3.4 Conclusions ... 60
3.6 References ... 81
4 Effectiveness of modified atmosphere packaging and ovine whey powder addition in extending the shelf life of whey cheese cakes ... 83
4.1 Introduction ... 83
4.2 Materials and methods ... 84
4.2.1 Sample preparation ... 84
4.2.2 Microbiological analysis ... 85
4.2.3 Chemical-physical analyses ... 85
4.2.4 Texture and colour determination... 86
4.2.5 Gas analysis ... 87
4.2.6 Statistical analysis ... 88
4.3 Results and discussion ... 88
4.3.1 Changes in tray gas concentrations over time ... 88
4.3.2 Chemical-physical and microbiological analysis ... 89
4.3.3 Texture, colour and sensory analysis ... 90
4.4 Conclusions ... 91
4.5 Figures and tables ... 93
4.6 References ... 99
5 Final conclusions and future perspectives ... 102
6 Posters and papers ... 105
Article ... 105
Oral communication ... 106
1 Introduction
1.1 Typical bakery products in Sardinia
We not know with precision where and when man has begun to produce and consume bakery foods, but we have news that the Egyptians and the Babylonians were able to produce leavened bread and that our civilization has co-evolved along with these products. Only in last century it was proved that yeast is the leavening agent in bread-making.
The evolution and the characteristics of bakery products are linked to the environment, and to the social and economic background of each country, which in turn affects the selection of the raw material used to make bread.
In the Mediterranean area different types of bakery products with different flavours and tastes are produced, and they are consumed daily or prepared with different ingredients depending on the period and particular events. In particular, in Sardinia hundreds of bakery goods are produced, for different periods of the year: the “papassinos”, a rectangular or rhomboidal sweet cookie, which can contain almonds or hazelnuts are prepared to celebrate the all Hallows Day; a typical bread named “su pane de sos isposos” is produced for marriage; in the central part of Sardinia typical heart breads are preferred during the winter season (named moddizzosu, zicchi, chivalzu or pane russu), whereas in summer and spring a typical flat crispy bread (bistoccu or carasau) is consumed. For Easter, a typical cheese cake named “pardulas” or “casadinas” are produced, whose main component is ovine ricotta cheese or ovine cheese, depending on the economic situation of the family or of the village, since the ricotta cheese is cheaper than ovine cheese. In North Sardinia the “spianata” bread a typical double round layered flat bread is produced; in western centre of the region, this bread with some modification in the recipe, and thickness of leaves becomes “zichi ladu” bread, whereas in eastern centre of Sardinia the spianata bread is split in two leaves which are toasted at very high temperature to obtain the “carasau” bread.
Nowadays the economic situation is different with respect to the past, and also the bakery products have changed their characteristics to meet the requirements of modern market: fresh bread must be available in the market every morning, then it needs to be packed, and a long shelf life and standard shape and weight are required. The needs in quality of raw materials are also changed, since the increasing production of bakery goods needs greater amounts than the past, and, to reach a standard level in the quality of the product, also a standard level of quality in raw materials is required. Addictives that often affect taste and flavour of the typical bakery products are used, turning them away from their original characteristics. Fortunately, local people know and remember “old” tastes and flavours of typical bakery products, so in the last decade, consumers became reluctant to buy products that contains additives and that are made in far countries and have no-typical or unknown ingredients.
This consumer behaviour is not a return to the past, and not must be seen as a step back toward a world of backwardness, of marginalization and poverty, even if it is from this context that our typical products were originated; but study them now, with modern techniques and modern means, being aware of the importance they have on the sustainability of natural resources and on their productions, on the food health and biodiversity of species cultivated or bred, will result in the development of the excellence in food productions where the rural matrix corresponds to modernity, to wealth and well-being. The link between the past and this kind of innovation will represent the added value of our food productions. This PhD thesis has the general objective to test how two baked local products (spianata and ricottine) could meet today's market needs, by suggesting solutions with a strong imprint from our territory. In this context we propose the use of ovine whey powder (which will be discussed further below) and the use of an old variety of durum wheat (Senatore Cappelli), which now lives an increase of its use in the bakery productions in Sardinia.
1.2 The raw material for bakery products
In Sardinia the main raw material in bread-making is low-grade semolina from durum wheat (Triticum turgidum subsp. durum). It is worldwide used to make dry pasta, and this is the reason why durum wheat breeding programs have focused on improving pasta cooking quality, through improving gluten strength indices. This has caused the progressive replacement of the old landraces and the ancient varieties with the new cultivars. Moreover, as the world market demand has increased, many countries (table 1) increased their production of durum wheat (Canada, Turkey, Mexico), which is now imported and used in Sardinia to make bread, although it has developed to make high quality pasta. At the same time the cultivation of old varieties of durum wheat has become not competitive, due to their low yield.
Table 1 – World Durum wheat production (International Grain Council, 2015)
Country 2014/15 production 2015/2016 estimation Country 2014/15 production 2015/2016 estimation World 32.6* 36.1 Argentina 0.3 0.3 UE 7.1 7.5 Syria 0.8 1.4 France 1.5 1.8 Turkey 2.1 2.4 Greece 0.8 0.7 India 1.3 1.2 Italy 3.7 3.9 Algeria 1.3 2.5 Spain 0.8 0.9 Libya 0.1 0.1 Kazakhstan 2.0 2.1 Morocco 1.4 2.3 Canada 5.2 4.8 Tunisia 1.3 1.3 Mexico 2.3 2.3 Australia 0.5 0.5 USA 1.4 2.1 Others 5.7 5.5 *Millions of tons
The use of semolina milled from commercial cultivars of durum wheat and well suited to modern bread-making plants allows obtaining bread more quickly and easily than in the past.
The characteristic required to semolina to be defined of high quality, is the ability to obtain a strong visco-elastic matrix during dough mixing, with good rheological properties, that is a high resistance to extension (dough elastic and not sticky) combined with a good extensibility that should guarantee a high volume of the loaf during the baking process. Several studies (Liu et al., 1996) pointed out that many durum wheat cultivars do not have good bread-making quality, since they show very strong gluten, and that it would be necessary to develop varieties with less elastic and more extensible gluten. However, the use of durum wheat flours in bread making has many other advantages, as an intense colour (yellowish), a characteristic taste and a fresh baked flavour, a longer shelf life that is appreciated by consumers. Indeed, as described from Troncone and Auricchio (1991) semolina based bread seems to contain a lower quantity of toxic epitopies than bread wheat, and could be therefore considered healthier for people who suffer of intolerance to wheat gluten (this topic is under intense research).
Semolina is composed mainly by starch and protein. Starch is the main component in durum wheat flour (60-75%). After hydration of semolina and during the mixing phase starch granules swell, due to absorption of water. The higher the amount of damaged starch, the higher is the swelling of the granules. Starch granules are composed of amylose and amylopectin, which affect the nutritional value of bread and its shelf life, as a consequence of a physical phenomenon known as retrogradation of starch (this topic will be discussed later on). The average protein content in semolina from durum wheat ranges from 10 to 15%. The two main important proteins are gliadin and glutenin, which during mixing with water form a complex network known as gluten, whose formation confers to the dough its visco-elastic properties, a well balanced equilibrium between elasticity and extensibility. The interaction between these two properties is essential to form a network able to trap the gases during the fermentation and during baking in the oven. Gluten accounts from 75% to 85% of total protein content in wheat flour (Shewry et al., 2009).
The microscopic structure of the gluten is still not known in deep, but it seems that the glutenins form an elastic network by means of strong covalent disulfide
bonds, whereas the gliadins interact with such basic structure via non-covalent forces (i.e., hydrogen bridges and hydrophobic interactions), thus conferring viscosity and extensibility to the dough. For this reasons the gliadins play an important role in obtaining a good dough volume during the fermentation and a good loaf volume during baking, whereas the glutenins affect the elastic behaviour of the dough, giving strength to the dough. Other authors explain that the glutenin fraction also has a central role in cooking quality of semolina-based pasta, whereas variation in gliadin amount does not affect physical differences in dough properties (Liu et al., 1996). Gluten quality plays also a significant role on crumb characteristics, such as texture and cell size distribution (Fois et al., 2012). The quality of gluten matrix is the first parameter able to distinguish semolinas milled from new and old varieties of durum wheat. Indeed, the old genotypes show the HMG-20 (High Molecular Weight) glutenin patterns, which are well recognized as a marker for gluten weakness. Moreover, previous studies demonstrated that the differences in quality characteristics between durum wheat varieties containing γ -gliadin 45 and γ -gliadin 42 are a consequence of a different glutenin pattern, mainly related to low molecular weight glutenins (LMW), since γ -gliadin 42 is marker for the LMW-1 pattern, which is, again, related to weak gluten characteristics, whereas γ -gliadin 45 is marker for LMW-2, which is related to strong gluten properties (Shewry et al., 2009). Due to their protein pattern, ancient varieties unfortunately show low suitability to be employed in modern plants; on the other hand, new varieties sometimes show too strong and tenacious gluten, which does not fit with bread-making technology. 1.3 The role of water in the bakery products
Another important element in durum wheat is water, whose amount ranges widely from 8 to 18%, and changes with environmental, agronomic and climatic grow conditions. Water is an essential ingredient for bakery products since it is needed for gluten development. Water is added to semolina during mixing of ingredients or is part of the same ingredients that are added to semolina. During bread-making the added water is needed to develop the dough, while during cheese cakes or
eggs. During mixing, water plays the important role to regulate the consistency of the dough, although during baking in the oven it is partially removed. The distribution of water in the final product explains several phenomena that will affect the quality and the shelf life of the final product. Moreover, during storage, due to free water availability, the quality of bakery products is threatened by microbial spoilage and chemical-physical alterations, as moisture loss and water redistribution or migration, both related to high values of water activity (aw). The
aw is definite by the ratio:
aw= p/p0
where p is the actual partial pressure of water vapour and p0 is the maximum
possible water vapour pressure of pure water (saturation pressure) at the same temperature (Scott, 1957). The values range between 0, that means total absence of free water, and 1 that is aw value of the pure distilled water. Moreover there is a
relationship between the equilibrium relative humidity (ERH) and aw values, as
shown below:
ERH = aw X 100
where aw is a fraction of 1, the equilibrium relative humidity is a percentage
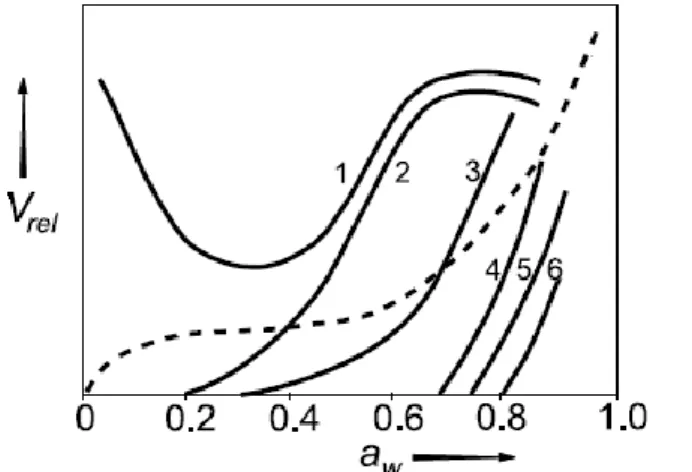
(Scott, 1957). Water activity is one of the most important parameters in the study of bakery foods, because it plays a critical role in the staling phenomena, particularly, it drives the redistribution of water under gradient between the centre and the crust of the product, and also determines the quality loss and microbiological degradation of food (Figura and Teixeira, 2007). The consequences of staling include both hardening of the crumb and loss of the fresh-baked flavour. Figure 1 shows the kinetic of different spoilage reactions as a function of aw and the minimum critical aw values required by microorganisms to
growth on a sample material.
The knowledge of the critical values of water activity, for each microbiological species, is useful to preserve healthiness of food goods. In the past, many authors studied the correlation between the microbial growth in food and the water activity values of food matrix, and the results are summarized in table 2, where it
is clearly evidenced that for each species exist minimal conditions for growth or for influencing the toxin-forming ability.
Figure 1 Relative rate (Vrel) of different spoilage reactions as a function of
aw in food. 1: lipid oxidation; 2: browning reactions; 3: enzymatic reactions; 4:
moulds; 5: yeasts; 6: bacteria. The dashed line indicates the sorption isotherm of the sample material. (Figura and Teixeira, 2007)
This “hurdle effect” has a fundamental importance for food preservation, which can be improved to prevent food-related infections, food poisoning and deterioration due to microorganisms. It is very useful in monitoring fermentation process of food as dairy products, meat products (for example raw sausage and raw ham) or bread dough. There are different well known traditional food preservation methods (salting, sugaring, drying, freezing), which modify the concentration of the particles dissolved in the water, decreasing aw values of the
matrix (Rödel et al., 1979). These methods delay or inhibit microbial growth with the aim to obtain a stabilizing or preserving effect on the food, although unfortunately they change textural and sensorial properties.
1.4 Techniques to preserve high quality in bakery products
Nowadays several non-invasive techniques are used in stabilization of bakery products (Smith et al., 2004), especially with food products that for their high values of aw are very perishable, as cheese cakes or some kind of bread, such as
Table 2. Minimum aw values for microorganisms growth associated with foods
(Leister et al., 1981)
aw Bacteria Yeasts Moulds
0.98 Clostridium, Pseudomonas
0.96 Flavobacterium, Klebsiella, Shigella
Lactobacillus, Proteus,Pseudomonas,
0.95
Alcaligenes, Bacillus, Citrobacter, Clostridium, Enterobacter, Vibrio Escherichia,Propionibacterium, Proteus,Pseudomonas, Serratia, Salmonella,
0.94
Bacillus, Clostridium, Lactobacillus, Micobacterium,Pediococcus, Vibrio, Streptococcus
Stachybotrys
0.93 Bacillus, Micrococcus, Lactobacillus, Streptococcus
Botrytis, Mucor, Rhizopus 0.92 Pichia, Rhodotorula, Saccharomyces 0.91 Corynebacterium, Streptococcus
0.90 Bacillus, Lactobacillus, Micrococcus,
Staphyloccus, Vibrio Hansenula, Saccharomyces 0.88 Candida, Debaryomyces, Hanseniaspora Cladosporium 0.87 Debaryomyces
0.86 Micrococcus, Staphylococcus, Vibrio
0.84 Paecilomyces Alternaria,
Aspergillus
0.83 Staphylococcus Debaryomyces Penicillium
0.81 Saccharomyces Penicillium
0.79 Penicillium
0.78 Aspergillus,
Emericella
0.75 Halobacterium, Halococcus Wallemia
0.70 Aspergillus,
Chrysosporium
0.62 Saccharomyces Eurotium
The most employed technologies to extend the shelf life are modified atmosphere packaging (MAP) or active packaging (AP), product reformulation and the use of preservatives, alone or in combination. Nowadays MAP technology has become very popular and used by the bakery industries. MAP consists in substituting the ordinary atmosphere of the package with a mix of gases. Packaging materials (films or trays) must show gas and water vapour barrier characteristics to keep constant the concentrations of the mix of gases into the packaging and to prevent product dehydration. In bakery food MAP, in order to preserve the freshness and improve food safety, the O2 concentration is reduced to 0% and CO2
concentrations are kept at relatively high levels (20%), whereas N2 is used as inert
filler gas to prevent the packaging collapse. Bacteriostatic and fungistatic activities of high concentrations of CO2 depend on several factors such as target
microorganism, concentration, storage temperature and aw of food (Smith et al.,
1988; Farber, 1991). However, the combination of high CO2 and low O2
percentages in the package headspace does not warrant a mould-free shelf life of bakery products (Ellis et al., 1993, 1994). This is possible because, often O2 is
trapped into the food matrix and after 24 to 48 hours this gas mixes with gas headspace, increasing O2 concentration up to 0.5% that is the critical value to
obtain a mould free product (Tabak and Cook, 1978). The advantages of this packaging method can be summarized as follow: it is cheap, has the capacity to greatly increase the shelf life of products, provided that film permeability, package airtight sealing, gas flushing and mixing are made in a right way. The use of AP, through the use of iron-based oxygen absorbers, is a method to prevent O2
presence into the packed tray and obtain a mould-free bakery product (Salminen
et al., 1996; Guynot et al., 2003), but the concern of European (Italian) consumers
and producers hinder a greater use of active packaging methods.
As mentioned above the use of preservative in bakery products is decreasing due to consumer concern, thus the reformulation of recipe (with the addition of
natural ingredients where possible) to decrease the spoilage risk should be
combined with MAP technology that is well accepted by both consumers and producer.
Among the different phenomena that affect staling in bread products, retrogradation of starch is considered a primary determinant (Piccinini et al., 2012). Moreover water loss and migration within the food matrix may lead to recrystalliation of sucrose resulting in the increase of hardness in cookies or cheese cakes (Secchi et al., 2011).
1.5 Retrogradation of starch
As summarized by Piccinini et al. (2012), staling is defined as the sum of physicochemical reactions and microbiological phenomena that leads to the loss of quality in bakery products. We do not know deeply all the mechanisms that are involved in the staling process, but we know that staling process leads to the hardening of the bread crumb, to the weakening of the crust, and to modifications in the texture of fresh baked bread, as a consequence of starch and gluten interactions and the concomitant movement of water from the crumb to the crust and between gluten and starch. In cookies or cheese cakes the staling process leads to movement of water between the different phases of the product, which consequently harden. The difference in the time needed for these physical phenomena to occur, together with the microorganism growth, represents the untimely shelf life of the product. As above mentioned, starch is the most abundant constituent in wheat flour, therefore any action devoted to reduce the retrogradation of starch, would directly impacts positively the shelf life of the product. Starch is composed of a mixture of two homopolymers: amylopectin and amylose, that are in turn composed of chains of α-1,4-linked D-glucose units, branched via α-1,6 glycosidic links. They differ in the number of branched chains, since amylase is almost linear or with few branched chains. During bread making process, this crystalline structure suffers important physical transformations: with the addition of water (mixing) starch granules swell, after that, during baking in the oven starch gelatinizes and during cooling and storage it recrystalises. The retrogradation of amylose occurs immediately after baking, whereas the
principal cause of bread crumb firming (Gray and BeMiller, 2003; Fadda et al., 2014). Starch retrogradation can be monitored with several analytical methods but one of the most rapid and reliable is visible and near-infrared (NIR) spectroscopy, inasmuch it is able to search changes during storage time of the hydrogen bonding in the starch crystalline network (Wilson et al., 1991; Osborne 1996, 1998). Piccinini et al. (2012) and Xie et al. (2003) compared NIR spectroscopy analysis and texture analysis to detect changes in bread during storage; they verified that NIR FT-Raman spectroscopy can give direct information about starch molecular changes, indeed the spectra can be acquired in a few minutes, and the analyses can be performed on samples without any pre-treatment. This method as reported by Thygesen et al. (2003) has been applied to evaluate starch molecular changes in other food matrix as potato, almond, wheat grain, and barley, but Piccinini et al. (2012) were the first that applied Raman spectroscopy for the investigation of starch retrogradation in bread and particularly in the crumb of semolina-based bread.
1.6 Whey powders (WP) in bakery products
Whey is the main by-product of cheese making (Díaz et al., 2004). In Sardinia whey is the principal waste product of ovine dairy industry and reaches the amount of 250.000 tons per year. In the centre of Sardinia there is a plant that collects the 20% of liquid whey produced in the region, which comes from cheese factories, to convert it in spray dried ovine whey powder. The remaining amount of liquid whey is mainly used in ricotta cheese production and as liquid feed, but the management of this by-product represents a serious environmental problem. Whey products are produced in different forms: dry whole whey powder, which is obtained by evaporation and spray drying, whereas the whey protein concentrates (WPCs) are obtained by ultrafiltration and further spray drying. Protein in WPCs can range from 30% to 75%, whereas whey powder from 10% to 35% of protein. To obtain delactosed and demineralised dry whey, ion exchange or membrane technology prior to spray drying, are used (Kinsella and Whitehead, 1989). Dry whey and whey powders are widely used in the food industry, in dairy,
powder components are lactose and proteins, primarily β-lactoglobulin and α-lactalbumin (Zadow, 1993). In bakery these products can be a potential source of low cost functional proteins, giving an added value to the bread, due to the nutritional value of the proteins.
The addition of lactose and proteins from whey can modify the texture of food thanks to their gelling, film-forming, foaming and emulsifying properties. Indeed, the excellent gelling and foaming properties of whey have been exploited to replace the egg white in bakery products (Zadow, 1993). Whey products contribute to the functionality of the product relay in the fact that they are a good source of protein, carbohydrates and calcium (Zadow, 1993). Nevertheless, whey proteins are known to exert negative effects on bread quality, by depressing loaf volume, and increasing crumb firmness, although their denaturation seems to eliminate this effect (Erdogdu-Arnoczky et al., 1996; Kadharmestan et al., 1998). Indrani et al. (2007) studied the effect of replacement of wheat flour with different amount of WP on Parotta bread (Indian traditional unleavened flat bread product) to evaluate the influences on dough, pasting properties and quality of baked bread. They demonstrated a proportional increase in dough stability and resistance to extension and a decrease in water adsorption, extensibility and viscosity with addition of different WP levels. Secchi et al. (2011) demonstrated that the addition of 5% ovine WP in the formulation of amaretti cookies (Italian traditional cookies), resulted in delayed firming and increased shelf life of cookies, while it did not influence the sensory properties. The water-binding properties of ovine WP reduced the effect of the increase of aw during storage as
consequence of sugar re-crystallization. Büşra Madenci and Nermin Bilgiçli (2014) studied the effect of WP and buttermilk powder (BP) on rheological properties of bread dough. They concluded that WP and BP addition increased the mineral content and improved the dough rheological properties as dough stability and development time, thus strengthening the dough.
1.7 Objectives
This PhD thesis has been organized in three main chapters, devoted to face three different critical points in bakery industry. First of all, we tried to improve the leavening performance of innovative dough, prepared using both “modern” semolina, and semolina milled from the cultivar Senatore Cappelli. We expected that the second one would have given a bad performance in terms of handling properties, due to the stickiness of its gluten, then we tested six different formulations for each semolina, introducing the ovine whey powder as an improver in the dough, at different substitution rates. Two different powders were tested, differing in their protein content. The dough formulations were analyzed for their rheological characteristics, by means of a fitting procedure built on stress relaxation data. A spectroscopy technique has been used in order to study in deep molecular structure of gluten in the new formulation.
As far as the bakery products concern, we have chosen a typical double layered flat bread, named spianata, and a cheese cake, named ricottine, whose formulation contain a typical ovine ricotta cheese (ricotta gentile). The spianata was prepared in our pilot plant following the traditional recipe of our region, and it was tested for its quality and shelf life properties. Modern semolina and semolina milled from Senatori Cappelli were compared to check any difference between them, and the ovine whey powder was added to the formulation. Only a type of powder was used, at three different concentrations. Also a control pan-bread was prepared, to verify the better suitability to produce bread with crumb rather than a flat bread, of the new formulations. WP was added to study the effect on the texture, the sensory properties, and the staling phenomena on the breads. Raman spectroscopy has been used to monitor starch retrogradation,
Ricottine have been prepared in a small plant sited in the centre of Sardinia, following the traditional recipe. One type of WP was used at two different concentrations. They have been packed in ordinary and MAP atmosphere and shelf life was monitored, to check if the combination of the bacteriostatic and fungistatic effect of MAP together with the “hurdle effect” of WP, that is its capability to decrease aw values, could extend the shelf life of the cakes.
1.8 References
Büşra Madenci A, Nermin Bilgiçli (2014) Effect of whey protein concentrate and buttermilk powders on rheological properties of dough and bread quality. Journal of Food Quality. 37; 117-124.
Díaz O, Pereira CD, Cobos A (2004) Functional properties of ovine whey protein concentrates produced by membrane technology after clarification of cheese manufacture by-products. Food Hydrocolloids. 18; 601-610.
Ellis WO, Smith JP, Simpson BK, Ramaswamy H (1993) Effect of inoculum level on aflatoxin production by Aspergillus flavus under modified atmosphere packaging (MAP) conditions. Food Microbiology. 10; 525–535.
Ellis WO, Smith JP, Simpson BK, Ramaswamy H, Doyon G (1994) Growth of and aflatoxin production by Aspergillus flavus in peanuts stored under modified atmosphere packaging (MAP) conditions. International Journal of Food Microbiology. 22; 173–187.
Erdogdu-Arnoczky N, Czuchajowska Z, Pomeranz Y (1996) Functionality of whey and casein in fermentation and in breadbaking by fixed and optimized procedures. Cereal Chemistry. 73, 3; 309-316.
Fadda C, Sanguinetti MA, Del Caro A, Collar C, Piga A (2014) Bread Staling: updating the view. Comprehensive Reviews in Food Science and Food Safety. 13, 4; 473-492.
Farber JM (1991) Microbial aspects of modified-atmosphere packaging technology – a review. Journal of Food Protection. 54; 58–70.
Figura LO, Teixeira AA (2007) Food Physics Physical Properties – Measurement and Applications Springer.
Fois S, Fadda C, Tonelli R, Sanna M, Urgeghe PP, Roggio T (2012) Effects of the fermentation process on gas-cell size two-dimensional distribution and rheological characteristics of durum-wheat-based doughs. Food Research International. 49; 193 -200.
Gray JA, BeMiller JN (2003) Bread Staling: Molecular Basis and Control. Comprehensive Reviews in Food Science and Food Safety. 2; 1–21.
Guynot, M.E., Sanchis, V., Ramos, A.J. Marin, S. (2003). Moldfree shelf life extension of bakery products by active packaging. Journal of Food Science. 68; 2547–2552.
Indrani D, Prabhasankar P, Jyotsna Rajiv, Venkateswara Rao G (2007) Influence of whey protein concentrate on the rheological characteristics of dough, microstrure and quality of unleavened flat bread (parotta). Food Research International. 40; 1254-1260.
International Grain Council (2015) http://www.igc.int
Kadharmestan C, Baik BK, Czuchajowska Z (1998) Whey protein concentrate treated with heat or high hydrostatic pressure in wheat-based products. Cereal Chemistry. 75, 5; 762-766.
Kinsella JE, Whitehead DM (1989) Proteins in whey: chemical, physical and functional properties. In Kinsella J (Ed.), Advances in food and nutrition research, Vol. 33; 343-438. San Diego Ca: Academic Press Inc.
Leister L, Rödel W, Krispien K (1981) ‘Microbiology of meat products in highand intermediate-moisture ranges’. In Water Activity: Influences on Food Quality, Rockland LB, Stewart GF (eds), Academic, New York, 855– 916.
Liu CY, Sheperd KW, Rathjen AJ (1996) Improvement of Durum Wheat Pastamaking and Breadmaking Qualities, Cereal Chemistry. 73,2;155-166. Osborne BG (1996) Near infrared spectroscopic studies of starch and water in
some processed cereal foods. Journal of Near Infrared Spectroscopy. 4;195– 200.
Osborne BG (1998) NIR measurements of the development of crystallinity in stored bread crumb. Analytical Magnetism. 26; 55–57.
Piccinini M, Fois S, Secchi N, Sanna M, Roggio T, Catzeddu P (2012) The application of NIR FT-Raman spectroscopy to monitor starch retrogradation and crumb firmness in semolina bread. Food Analytical Method, 5; 1145-1149.
Rödel W., Krispien K. and Leister, L. (1979) ‘Messung der Wasseraktivita¨t (aw-Wert) von Fleisch and Fleischerzeugnissen’. Fleischwirtschaft. 59; 831– 836.
Salminen A, Latva-Kala K, Randell K, Hurme E, Linko P, Ahvenainen R (1996) The effect of ethanol and oxygen absorption on the shelf life of packaged slice rye bread. Packaging Technology and Science. 9; 29–42.
Scott WJ (1957) Water relations of food spoilage microorganisms. In Advances in Food Research, vol. VII, Mrak EM, Stewart GF (eds), Academic Press, New York, 83–127.
Secchi N, Stara G, Anedda R, Campus M, Piga A, Roggio T, Catzeddu P (2011) Effectiveness of sweet ovine powder in increasing the shelf life of Amaretti cookies. Food Science and Technology-LEB. 44; 1073-1078.
Shewry PR, D’Ovidio R, Lafriandra D, Jenkins JA, Clare Mills EN Bekers F (2009) Wheat Grain Protein. 223-298. In Wheat: Chemistry and technology, 4th edition. AACC International Khan K, Shewry PR.
Smith JP, Daifas DP, El-Khoury W, Koukotsis J, El-Khouri A (2004) Shelf life and safety concerns of bakery products e A review. Critical Reviews in Food Science and Nutrition. 44; 19-55.
Smith JP, Khanizadeh S, Vand de Voort FR, Hardin B, Ooraikul B, Jackson ED (1988) Use of response surface methodology in shelf life extension of a bakery product. Food Microbiology. 5; 163–176.
Tabak HH, Cook WB (1978) The effect of gaseous environments on the growth and metabolism of fungi. Botanical Reviews. 34; 126–252.
Thygesen LG, Løkke MM, Micklander E, Engelsen SB (2003) Vibrational microspectroscopy of food. Raman vs. FT-IR Trends in Food Science and Technology. 14; 50–57.
Troncone R, Auricchio S (1991) Gluten‐sensitive enteropathy (celiac disease) - Food Reviews International. 7,2; 205-231.
Wilson RH, Goodfellow BJ, Belton PS, Osborne BG, Oliver G, Russell PL (1991) Comparison of fourier transform mid infrared spectroscopy and near infrared reflectance spectroscopy with differential scanning calorimetry for
the study of the staling of bread. Journal Science Food Agricolture. 54; 471– 483.
Xie F, Dowell FE, Sun XS (2003) Comparison of near-infrared reflectance spectroscopy and texture analyzer for measuring wheat bread changes in storage. Cereal Chemistry. 80,1; 25–29.
Zadow JG (1993) Whey and whey powders. In Macrae R, Robinson RK, Sadler MJ (Eds.), Encyclopedia of food science food technologies and nutrition 7: 4888-4895. San Diego Ca: Academic Press Inc.
2 The role of ovine whey powder in improving the properties of
a semolina-based dough for baking
2.1 Introduction
Semolina from durum wheat is used to make different types of local breads in the Mediterranean area, particularly in Southern Italy (Fadda et al., 2010a). The chemical and rheological characteristics of semolina greatly affect the handling properties of the dough, its leavening capacity, and the final quality of the finished bread. Semolina characterized by a strong gluten network, resulting in a high gluten index and P to L values, is suitable to produce soft bread with low specific weight (Armero and Collar, 1998) due to the high leavening and gas retention capacity. In contrast, semolina with a weak gluten network results in dough that is not able to expand well, producing bread that is heavy and hard with an inhomogeneous structure (Oates, 2001). In recent years, an increasing consumer desire for high food quality has led to renewed interest in ancient raw materials and traditional food production (Gallo et al., 2010). The importance of this topic was stated at the Universal Exhibition hosted in Milan in 2015 (EXPO, 2015) where “the best of the agri-food and gastronomic traditions of each of the exhibitor countries” were presented. In this context, local bread wheat landraces and old durum wheat varieties have recently been rediscovered, and there has been a general effort to reintroduce them into the bakery industry. However, the replacement process has been hindered by their poor agronomic characteristics and poor gluten quality, which renders them unsuitable for bread making in modern bakery plants. The functional properties of dough can be improved by the addition of food ingredients or additives such as whey powder, which is used as a food fortifier or as a source of low-cost proteins (Fadda et al., 2010b). Whey lactose and proteins can be added to introduce for food texture modifications (gelling, film-forming, foaming, and emulsifying) (Kinsella and Whitehead, 1989; Zadow, 1993). Whey proteins also have important nutritional and biological functions, since the protein components and their peptide fragments are bioactive; for example, they exert antimicrobial and antiviral actions as well as anticarcinogenic activity and they have the capacity to modulate the innate
immune system (Ko and Kwak, 2009). Moreover, 1 million tons of ovine whey is produced annually in Southern Italy (Sansonetti et al., 2010), resulting in a number of environmental problems that include pollution. Currently, the conversion of by-products from the dairy industry into dry products is one of the main industrial conversion processes. A number of scientific papers are available on the use of whey powders derived from bovine milk. In Mediterranean countries, whey powder from ovine milk is also readily available and has been used to increase the shelf life of cookies (Secchi et al., 2011).
The objective of this study was to investigate the role of ovine whey powder (OWP) on the leavening performance of semolina-based dough for making pan-bread, with particular emphasis on dough produced with semolina from the Senatore Cappelli cultivar, an old and tall wheat durum genotype characterized by weak gluten and sticky dough, features that poorly fit with the technological requirements of modern industrial plants. In addition, the effects of increasing substitution rates with two OWPs on two different types of dough were investigated. Specifically, dough was produced with commercial low-grade semolina derived from a blend of strong wheat cultivars or with semolina obtained from the Cappelli cultivar. The physical-chemical properties and rheological behaviour of the dough were evaluated and leavening trials were conducted. Potential molecular modifications in gluten conformation caused by the addition of OWPs were investigated using Fourier transform infrared (FTIR) spectroscopy.
2.2 Materials and Methods
2.1. Raw materials, dough preparation and analyses
Two commercial low-grade semolina (LGS) were used (Molino Galleu, Sardinia, Italy), referred to as 4T and 48T. The 4T was obtained by milling the Cappelli cultivar, whereas the 48T was derived from a blend of wheat cultivars that are commonly used to make pasta and typical semolina-based breads. Two commercial OWPs referred to as A15 (Alim21 A.SP1, Alimenta Srl, Sardinia,
formulations at different substitution rates (0, 5, 10, and 15% w/w). Hereafter, dough samples will be denoted by the LGS name plus OWP name and relative percentage (e.g., 4T A15 10 or 4TC for the control sample). Raw material characterization was performed for: moisture (%), ash (%), protein content (%), calculated on a dry basis (d.b.), gluten index (%), and dry gluten content (% d.b.), using AACC Approved Methods: 44-15A, 08-12, 46-12, 66-20, 38-12A, and 54-30A (AACC, 2000) respectively. The latter method was adapted to durum wheat according to Dubois et al. (2008).
The Alveo-Consistograph (Chopin, France) was used to determine water adsorption capacity at a consistency of 2,200 mbar (fixed moisture basis of 15%), the pressure drop after 450 s of mixing (D450, mbar), and the time to reach the target consistency of 2,200 mbar (TPrMAX), according to the AACC Approved Method 54-50 (AACC, 2000).
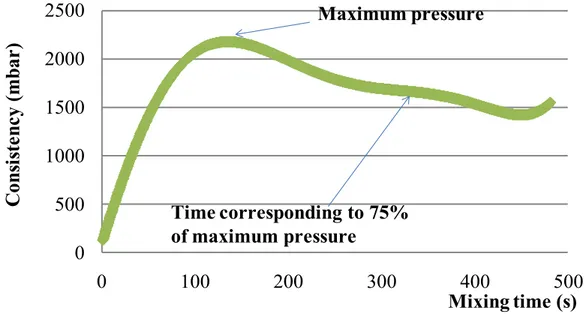
The dough was prepared in the Consistograph mixer bowl at a fixed temperature (24°C) and at adapted hydration. OWP at different percentages, semolina, and yeast (1% w/w, total weight of LGS plus A15 or A35) were mixed in the Consistograph mixing bowl for 2 min before adding 2.5% saline solution. The chosen mixing time was the time needed to reach 75% of the maximum pressure (i.e., 2,200 ± 7% mbar) (figure 1), as measured on the Consistograph (Vinci et al., 2013). After reaching the desired consistency, the dough was sheeted and formed for alveographic analysis. Another dough was prepared for each treatment, and when the desired consistency was reached, it was extruded, sheeted and divided into five pieces that were used for a stress relaxation test. The third dough for each treatment was prepared in the same way in triplicate and used in the leavening trial.
2.2. Stress relaxation test
The TA.XT2i Texture Analyser (Stable Micro Systems Ltd., Surrey, UK) equipped with a 30 kg load cell and P50 probe was used for the stress relaxation test on the dough [15], and force (N) vs. time (s) curves were recorded using Texture Expert Exceed software version 2.64. The test speed was 1 mm s-1. The
instantaneous strain applied to the dough was 10%, and the resulting stress was recorded for 40 s. A generalized Maxwell model was used to interpret the stress relaxation data in accordance with Campus et al. (2010). The generalized Maxwell model is as follow:
e e Ci t i t n i
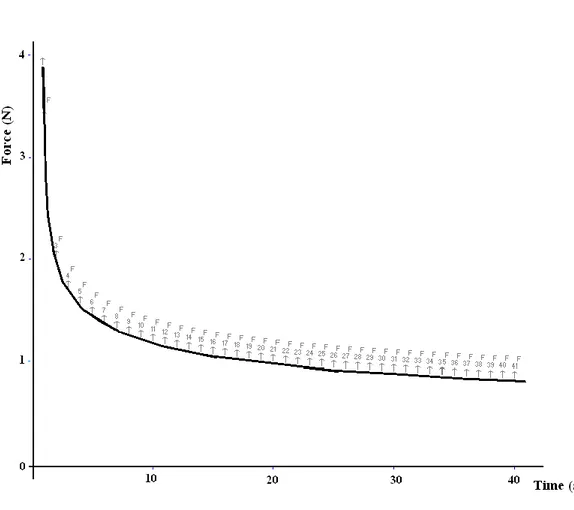
( ) ) ( ) / ( 1where σ is the stress (N) at a given time, t is the time (s), Ci is the stress relaxation constant (N), σe is the equilibrium stress (N), and τi is the relaxation time of the Maxwell element (s). TableCurve 2D version 5.01 (Systat Software Inc., San Josè, CA, USA) was used to perform regression analyses on the stress relaxation data using the Levemberg-Marquardt method. R2 (i.e., the percentage of explained variation), and maximum relative difference (MRD) were used to evaluate the goodness of fit. Only the relaxation part of the curve was used for the fitting procedure (figure 2). A model with three Maxwell elements (n=3) was optimal to describe the visco-elastic behaviour of the dough (R2 ≤0.98 and MRD ≤7). The maximum force achieved in the stress relaxation test was the same in all dough, confirming that homogeneous dough were obtained in terms of consistency. The value of maximum force obtained was 3.8±0.3 N.
2.3. Leavening trial
Leavening tests were performed as described by Vinci et al. (2013). For each treatment, the dough was prepared in the Consistograph mixing bowl, as described above. After dough preparation, 100 g was transferred to graduated glass cylinders (250 mL capacity and 15 mm diameter) and left at 25°C until maximum leavening height was attained. The increase in dough height was recorded every 15 min.
FT-IR spectral measurements were performed under vacuum condition using the Bruker infrared Vertex 70 interferometer (Ettlinger, Germany) equipped with a deuterated triglycine sulfate detector, and spectral data were processed by using Bruker OPUS 6.5 software. The dough samples were freeze dried before FT-IR analysis to avoid interference from water (Sivam et al., 2013). After freeze drying, each dough sample was homogenized using an agate mortar and pestle, after which an aliquot of 3 mg was mixed with 297 mg anhydrous potassium bromide (KBr, >99%; Sigma-Aldrich, St. Louis, MO, USA) and pelleted for the analyses. The spectra were recorded in the 400–4000 cm-1 range by averaging 128 scans at a 4 cm-1 resolution. The background was evaluated by measuring the KBr signals. Three replicates were measured for each treatment. Spectra were recorded between 1710 and 1580 cm-1 for studying the amide I band. After normalization, A15 and A35 spectra were subtracted from the spectrum for the dough, after being multiplied by their relative percentage in the dough. The peak positions, corresponding to the secondary structure of the proteins, were identified using the second derivative spectra and used to initialize the best fit of the amide I band in the spectral range of 1710 to 1580 cm-1. The best fit was obtained using the mixed Gaussian-Lorenzian function. The percentages of integrated peak areas were calculated. Each area corresponded to a different secondary structure, which were assigned as reported by Wang et al. (2016).
2.5. Statistical analysis
Principal component analysis (PCA) was performed on the correlation matrix of the variables including semolina and dough properties, mixing parameters, and height of leavening. The component loadings were calculated as simple correlations (using Pearson's r) between the components (i.e., the component scores for each dough) and the original variables. Data related to properties of dough samples (mixing time, volume of leavening, and protein content) were analyzed by one-way analysis of variance (ANOVA). When appropriate, mean separation was conducted according to the Duncan’s multiple range test at p<0.05.
2.3 Results and Discussion
3.1. Characteristics of LGSs and ovine whey powders
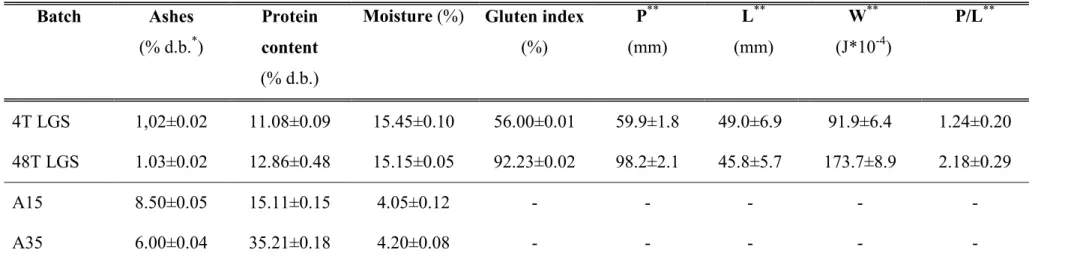
The chemical and physical properties of the LGS samples and OWPs are shown in table 1. The data show the differences between the two semolina samples with regard to protein content, gluten index, and alveographic parameters, the configuration ratio (P/L) and deformation energy (W). 48T had a higher protein content, gluten tenacity and extensibility than 4T, which was obtained from a cultivar that is well known for its poor gluten quality due to the pattern of the high molecular weight glutenin subunit 20 (HMW-GS 20), which is the predominant pattern in durum wheat landraces and old genotypes (Fois et al., 2011). However, it has been almost completely replaced by the 6+8 and 7+8 HMW patterns, which exhibit stronger dough properties and superior baking quality than HMW-GS 20 cultivars. There were evident differences in the chemical composition of the two OWPs, with A35 having a higher protein content and lower ash content than A15 (table 1).
3.2. Effect of ovine whey powders on rheological and leavening properties of the dough
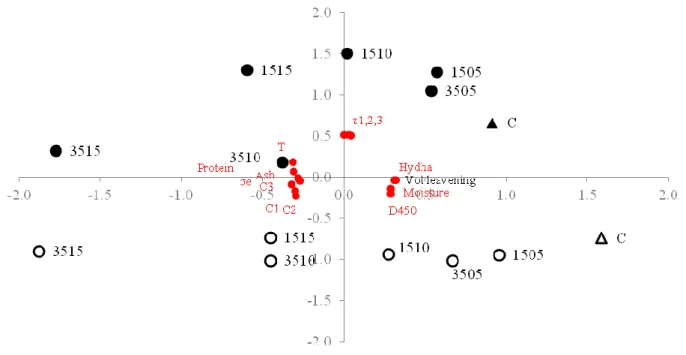
The results of the PCA analysis on the dough samples are reported in figure 3 and in table 2. The first two PC axes explained 85.3% of the differences among samples (figure 3). Almost all of the variables contributed, both positively and negatively, to the first axes, whereas the original variable that contributed most to the second axis was the relaxation time of the Maxwell model τi. The position of the samples with respect to the first PC axis was consistent with the addition of whey proteins, which moved the samples to the positive part of the first principal component (PC1). The negative association between this first axis and the protein content of the dough (r = −0.89) highlights the negative effect of whey addition on the leavening performance of flour. Typically, the higher the protein content, the better the leavening capacity of the dough; however, in this case, although the addition of whey increased the protein content, it also strengthened the dough,
which probably led to greater resistance to extension. The correlations among the original variables confirmed this hypothesis, as strong associations among protein content and all of the indices of elasticity and strength of the dough (i.e., alveographic tenacity of the dough T, Maxwell decay force Ci, equilibrium stress σe) were found.
The strong correlations between the variables and PC1 established a strong relationship among them, notably between the leavening capacity of the dough and the consistographic parameters. Here, data from the Consistograph showed that the addition of OWP led to reduced water adsorption of the dough, similar to the study by Indrani et al. (2007), in which whey protein concentrate was added to a flour-based dough. Note that the available literature refers to flour from Triticum
aestivum L., and no data have been published to date on the effects of the addition
of whey protein to semolina-based dough. The effect of hardening on the dough was revealed by the increase in TPrMAX values (data not shown), which increased from 110.5 s in the 4TC to 385.0 s in the 4T A35 15, and the concomitant decrease in D450 values (from 880.5 s in the 4TC to 86.5 s in the 4T A35 15) showed an increase in dough stability as the OWP percentage increased, similar to the findings reported by Indrani et al. (2007). In a previous study Vinci
et al. (2013), our group demonstrated the key role of technological mixing
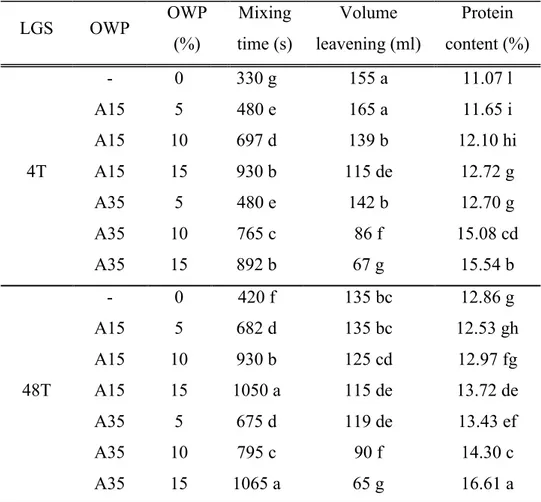
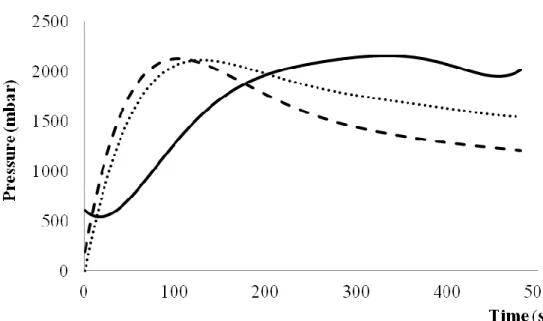
parameters (i.e., hydration level of the dough), as determined using the Consistograph, and mixing time in influencing the leavening performance of a semolina-based dough. We suggested that the optimum mixing time approximately corresponded with the time required to reduce the maximum pressure to 75% of its value (figure 1), which resulted in a softer and more elastic dough that was better suited to leavening. This procedure was applied in the current study to make sure all dough samples were mixed until the best consistency for leavening was attained, which explains why the mixing times were extremely variable among the samples, ranging from 330 s to 1,065 s (table 3, figure 4). As expected, the shortest mixing time was in the 4TC. The dough made from the stronger 48T showed a longer mixing time than the dough made from 4T in all treatments. We generally observed that the addition of OWP led to
an increase in mixing time, consistent with the degree of substitution of LGS with OWP. This is probably because whey proteins make it more difficult for the gluten network to form, causing the dough to take more time to reach the desired consistency. Interestingly, the leavening performance of 4TC was better than that for the 48T samples (table 3), although the corresponding LGS had a lower protein content and poorer gluten quality, in accordance with the conclusions of Vinci et al. (2013), who showed that the technological parameters used during dough preparation influence the leavening performance more than the semolina characteristics. Generally, the 4T performed better than the 48T in almost all of the treatments, and the addition of OWP had a negative effect on leavening height compared with the respective controls in both 4T and 48T. This result is in accordance with most studies, which have demonstrated that almost every milk fraction depresses loaf volume including whey proteins (powders or concentrates), casein, and lactose, as summarized by Erdogdu-Arnoczky et al. (1996). In our study, the depressing effect was greater in 4T than 48T, at the highest OWP concentrations (i.e., A15 at 15% and A35 at 10% and 15%; table 3). In fact, the loaf volume was not significantly different between 4T and 48T, but the volume in the 4T control was significantly higher than that in the 48T control. Conversely, at the lowest concentration of A15 (5%), dough made from 4T and 48T showed the same leavening height as their respective controls. Our data show that the addition of OWP leads to increased dough elasticity, as determined by the contribution of the stress relaxation constant Ci to PC1 (figure 3). We observed that the greater the reduction in leavening height, the higher the increase in Ci values; in the dough made from 4T and 48T with A35 at a 15% substitution rate, the C1 value increased by 151% and 81%, respectively, with respect to their controls. At the same time, the leavening height decreased by 56% and 52% in the 4T A35 15 and 48T A35 15 samples, respectively. These data suggest that the addition of OWP resulted in a gluten matrix that had a greater resistance to extension, which negatively affected leavening performance.
In the 4T dough, the 5% substitution rate with A15 (i.e., the lower concentration of whey proteins) led to an increase in leavening height (+6%), which can be
attributed to the weak gluten matrix of the Cappelli cultivar. In this case, the gluten matrix most likely benefited from the increased elasticity, which improved the leavening performance but did not make the dough too strong as to oppose expansion driven by fermentation, as occurred in the other samples. Indeed, Fois
et al. (2012) reported that samples with a gluten network that is too strong and a P
to L ratio that is too high tend to perform worse than samples with normal gluten strength.
In this study, the two kinds of semolina were well separated with respect to the second axes (figure 3), indicating that the 48T samples had a greater relaxation time than the 4T samples, regardless of the addition of whey protein. Relaxation time τi, which dominated PC2, clearly distinguished the 4T samples from the 48T samples. The relaxation times can be considered an indication of the relative rates of molecular motion in dissipating stress (Edwards et al., 2001), so the higher the relaxation time, the lower the chain mobility. Lower relaxation times may explain the higher leavening height in the 4T samples compared with the 48T samples at the lower concentrations of whey proteins (i.e., A15 at 5% and 10%, and A35 at 5%). Edwards et al. (2001) discussed the role of the relaxation time in the baking performance of common and durum wheat. The authors found that dough with lower relaxation times had higher loaf volumes, as in our case, and hypothesized that the strength of the dough is correlated with the relative molecular mobility. In the abovementioned substitution rates, the height of leavening was ~20% greater in the 4T samples than the homologous dough made from the strong commercial 48T, consistent with that of the latter samples, which moved up to the positive part of PC2.
3.2. Effect of whey powders on the secondary structure of gluten
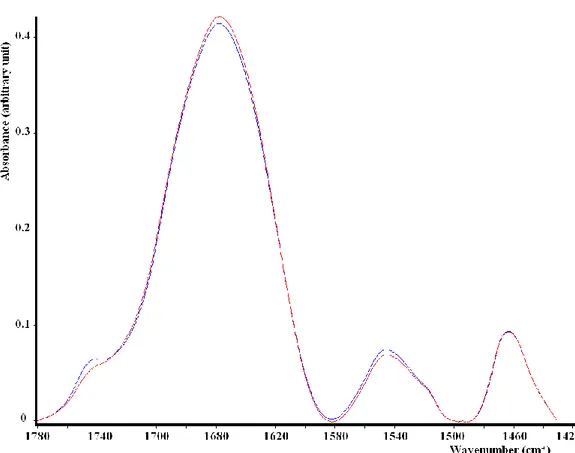
FTIR spectra of 48TC and 4TC dough were collected and analysed to study the molecular differences among samples. FTIR spectra of 48TC and 4TC dough in the range of 1780–1440 cm-1 (figure 5) were similar to those found in other studies (Georget and Belton, 2006; Sivam et al., 2013), and revealed the C=O stretching of lipids at about 1750 cm-1. Amide I and II are the most important
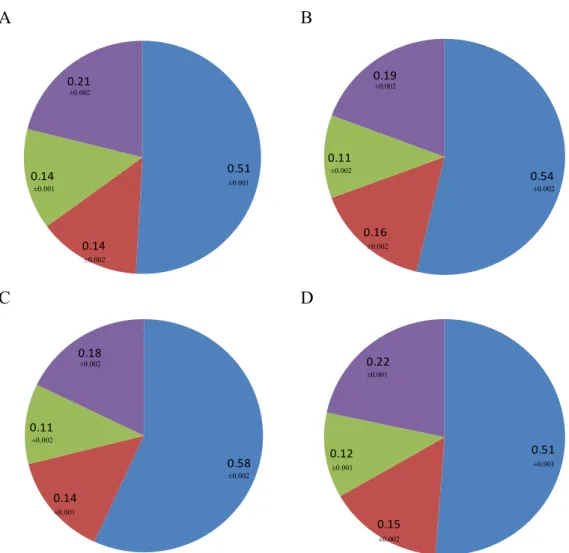
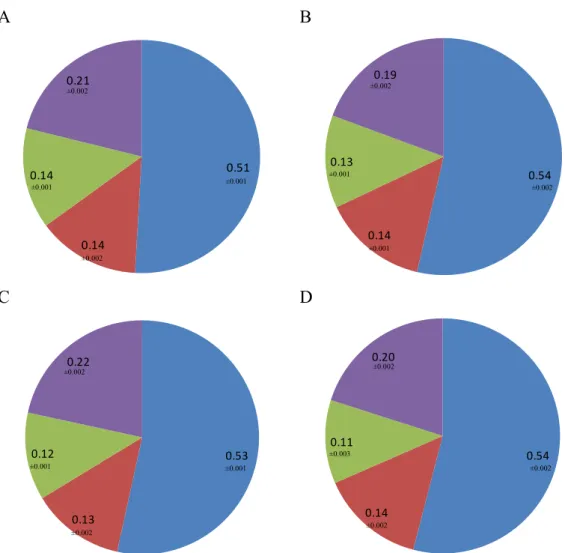
bands in the infrared spectrum of proteins. The most intense absorption band is amide I, which was centred at about 1660 cm-1 in this study, and is mainly derived from the C=O stretching of the peptide group combined with N-H bending. The amide II band was found in the range of 1580–1510 cm-1; this band is more complex to study because it is derived from a combination of N-H bending, C-N, and C-C stretching. This is the reason why only the amide I band was studied in depth. The peak assignments to protein conformations in the amide I region were the same as reported by Wang et al. (2016): the bands located at 1650–1660 cm-1 were assigned to the α-helix, the bands located at 1618–1640 cm-1 and 1670–1690 cm-1 were assigned to the β-sheet, the bands at 1660–1670 cm-1 and 1690–1700 cm-1 were assigned to β-turns, and the band at 1645 cm-1 was assigned to random coils (Wang et al., 2016). The results of the curve fitting procedure are shown in figures 6–9, which show that about 50% of proteins in the dough adopted a β-sheet conformation in all of the samples analysed. Secondary structures were highly sensitive to the addition of ovine whey powder. In the 4T samples, the addition of OWP led to a slight increase in β-sheet and β-turn structures, at the expense of α-helix and random coil structures (figures 6 and 7). The contrary occurred in the 48T samples, in which there was a decrease in β-sheet and β-turn structures, but an increase in α-helix and random coil structures after the addition of whey powder (figures 8 and 9). The β-sheet structures are indicative of protein aggregation, which has been reported to decrease the volume of bread (Ravi et al., 2009; Sivam et al., 2013), and the increase of β-sheet and β-turn structures is an indicator of increased molecular rigidity and dough strength (Wang et al., 2016). Generally the volume of leavening was reduced by the addition of OWP (table 3), indicating a detrimental effect on the dough, as previously explained. However, the hypothesis of excessive strengthening of the gluten matrix was consistent with the increase in β-sheet and β-turn structures in the 4T samples, but not in the 48T samples, in which the content of β-sheet and β-turn structures decreased. We suggest that other technological parameters may have influenced the relative percentage of the secondary structures. The 48T samples differed from the 4T samples with regard to hydration level and mixing time, which were calculated for
each dough using consistographic data. It is worth noting that the mixing time was significantly higher in the 48T samples compared with the 4T samples (table 3), which further increased with the addition of OWP. The longer mixing time may have been responsible for the partial disruption of the protein aggregates and a portion of the gluten network, thereby explaining the decreased leavening height in the 48T samples upon OWP addition, even though it was not accompanied by an increase in β-sheet and β-turn structures. This was reflected by the increase in random coil, unordered structures, which increased from 12% in the control 48TC sample to 20% in the 48T A15 15 (+ 66%) sample. Notably, the content of β-turn structures that are highly dependent on the mechanical history of the sample (Wellner et al., 2005) decreased from 26% in the 48TC sample, to 19% in the 48TA1505 sample.
In our experiment, an interesting phenomenon was observed: the volume of bread followed a different trend than the height of leavening, but consistent with data from spectral analysis. As can been seen in the following section of this thesis (section 3, figure 3), the volume of bread in 4T samples significantly increased after addition of ovine whey powder, and this is consistent with our hypothesis that the increase of β-sheet + β-turn structures strengthened the gluten network in the dough, which could resist to the expansion of the alveoli during baking. On the contrary, the volume of bread in 48T samples decreased with the addition of whey powder, due to the supposed disruption of the gluten network during the prolonged mixing times.
2.4 Conclusions
In conclusion, the addition of OWP to the dough had a negative effect on leavening height, at all concentrations except the lowest (5%). Leavening height is generally recognized as a reliable indicator of bread volume (Fadda et al., 2014). In this study, the reduction in height occurred for different reasons. In the 4T samples, the addition of OWP led to an improvement in dough strength, as demonstrated by the increase in β-sheet and β-turn structures, which was revealed
samples, the addition of OWP led to the need for a longer mixing time to reach the desired consistency on the consistograph. The prolonged mixing time probably caused partial disruption of the gluten network, resulting in reduced leavening height and reduced bread volume after baking in the samples with OWP compared with the control. The significant increase in unordered protein structures confirms this hypothesis.
2.5 Figures and tables
Figure 1. Curve from the consistograph: dough consistency vs. mixing time. The chosen mixing time was the time needed to reach 75% of the maximum pressure measured at the consistograph for each dough.
0 500 1000 1500 2000 2500 0 100 200 300 400 500 C on si ste nc y (mb ar ) Mixing time (s) Time corresponding to 75% of maximum pressure Maximum pressure
Figure 2. Relaxation part of the curve that was used for Maxwell model fitting.
Table 1. Properties of low grade semolinas (LGS) and ovine whey powders (A). Batch Ashes (% d.b.*) Protein content (% d.b.)
Moisture (%) Gluten index
(%) P** (mm) L** (mm) W** (J*10-4) P/L** 4T LGS 1,02±0.02 11.08±0.09 15.45±0.10 56.00±0.01 59.9±1.8 49.0±6.9 91.9±6.4 1.24±0.20 48T LGS 1.03±0.02 12.86±0.48 15.15±0.05 92.23±0.02 98.2±2.1 45.8±5.7 173.7±8.9 2.18±0.29 A15 8.50±0.05 15.11±0.15 4.05±0.12 - - - - - A35 6.00±0.04 35.21±0.18 4.20±0.08 - - - - -
* d.b, dry basis. **Alveograph parameters at constant hydration: P, maximum overpressure; L, index of swelling; W, deformation energy; P/L, configuration ratio. Data were expressed as mean ± standard deviation.
Table 2. Proportion of total variation and eigenvectors of principal component (PC) axes in a principal component analysis performed on all the traits measured.
Eigenvectors Loadings
Axis 1* Axis 2** Axis 1 Axis 2
Moisture 0.91 0.66 0.29 -0.14 Ash 0.57 1.28 -0.29 -0.01 Protein 0.02 1.50 -0.31 0.08 HYDHA -0.60 1.30 0.31 -0.03 D450 0.54 1.05 0.29 -0.19 T -0.38 0.18 -0.31 0.19 Vol Leavening -1.77 0.32 0.32 -0.03 C1 1.59 -0.74 -0.30 -0.16 τ1 0.96 -0.94 0.04 0.52 C2 0.27 -0.94 -0.30 -0.23 τ2 -0.45 -0.74 0.03 0.52 C3 0.67 -1.02 -0.33 -0.09 τ3 -0.45 -1.02 0.00 0.52 σe -1.88 -0.90 -0.27 -0.04
Component loadings are the simple correlations between the component scores and the original variables.
*Proportion of total variation is 60.3% **Proportion of total variation is 25.0%
Figure 3. Principal component analysis (based on the correlation matrix) of dough samples. Biplot of factor scores (points). 4T control ( );48T control ( ); 4T doughs with ovine whey powders (A15,A35) ( );48T doughs with ovine whey powders (A15, A35) ( ); loadings (. ).
Stress relaxation test parameters: C1,C2,C3: decay force of Maxwell model; τ1,τ2,τ3: relaxation times of the Maxwell model; σe: the
residual modulus that remained unrelaxed.
Alveograph parameters at adapted hydration: T: maximum overpressure (mm).
Consistograph parameters: HYDHA: actual hydration of dough used in the test (% 15% mb); D450 dough weakness at 450 s. Vol leavening: leavening volume (mL).
Table 3. Properties of dough samples. LGS OWP OWP (%) Mixing time (s) Volume leavening (ml) Protein content (%) 4T - 0 330 g 155 a 11.07 l A15 5 480 e 165 a 11.65 i A15 10 697 d 139 b 12.10 hi A15 15 930 b 115 de 12.72 g A35 5 480 e 142 b 12.70 g A35 10 765 c 86 f 15.08 cd A35 15 892 b 67 g 15.54 b 48T - 0 420 f 135 bc 12.86 g A15 5 682 d 135 bc 12.53 gh A15 10 930 b 125 cd 12.97 fg A15 15 1050 a 115 de 13.72 de A35 5 675 d 119 de 13.43 ef A35 10 795 c 90 f 14.30 c A35 15 1065 a 65 g 16.61 a
Samples with different letters within each column are significantly different at p<0.05 according to Duncan’s multiple range test.
Figure 4. Evolution of mixing time during consistograph tests. 4TC dashed line; 4TA155 fine dotted line; 4TA1515 solid line.
Figure 5. Typical FI-IR scan of 4TC (blu line) and 48TC (red line) in the range between 1780 and 1420 cm-1.
A B
C D
Figure 6. In the 4T-based dough, the effects of A15 on the secondary structure of gluten as revealed by FT-IR.
A=4TC; B=4TA155; C=4TA1510; D=4TA1515
β-sheet ( ), random coil ( ), α-helix ( ), β-turn ( ).
0.51 0.14 0.14 0.21 0.54 0.16 0.11 0.19 0.58 0.14 0.11 0.18 0.51 0.15 0.12 0.22 ±0.002 ±0.001 ±0.002 ±0.001 ±0.002 ±0.002 ±0.002 ±0.001 ±0.001 ±0.001 ±0.002 ±0.001 ±0.002 ±0.002 ±0.002 ±0.002
A B
C D
Figure 7. In the 4T-based dough, effects of A35 on the secondary structure of gluten as revealed by FT-IR.
A=4TC; B=4TA355; C=4TA3510; D=4TA3515
β-sheet ( ), random coil ( ), α-helix ( ), β-turn ( ).
0.51 0.14 0.14 0.21 0.54 0.14 0.13 0.19 0.53 0.13 0.12 0.22 0.54 0.14 0.11 0.20 ±0.002 ±0.001 ±0.002 ±0.001 ±0.002 ±0.001 ±0.002 ±0.001 ±0.002 ±0.001 ±0.001 ±0.002 ±0.002 ±0.003 ±0.002 ±0.002
A B
C D
Figure 8. In the 48T-based dough, the effects of A15 on the secondary structure of gluten as revealed by FT-IR.
A=48TC; B=48TA155; C=48TA1510; D=48TA1515 β-sheet ( ), random coil ( ), α-helix ( ), β-turn ( ).
0.49 0.12 0.14 0.26 0.49 0.16 0.16 0.19 0.47 0.19 0.17 0.18 0.48 0.20 0.17 0.15 ±0.002 ±0.002 ±0.002 ±0.003 ±0.001 ±0.002 ±0.002 ±0.002 ±0.001 ±0.002 ±0.001 ±0.002 ±0.004 ±0.003 ±0.002 ±0.002
A B
C D
Figure 9. In the 48T based dough, tha effects of A35 on the secondary structure of gluten as revealed by FT-IR.
A=48TC; B=48TA355; C=48TA3510; D=48TA3515 β-sheet ( ), random coil ( ), α-helix ( ), β-turn ( ).
0.49 0.12 0.14 0.26 0.46 0.19 0.16 0.19 0.45 0.20 0.17 0.17 0.44 0.21 0.18 0.17 ±0.001 ±0.002 ±0.001 ±0.002 ±0.002 ±0.003 ±0.002 ±0.001 ±0.001 ±0.002 ±0.002 ±0.002 ±0.002 ±0.003 ±0.002 ±0.001