Changes in Organizational Architecture:
Aspiration Levels, Performance Gaps
and Organizational Change
Federica Ceci*and Francesca Masciarelli† Dipartimento di Economia Aziendale
University G. d'Annunzio Viale Pindaro 42, Pescara 65127, Italy
Andrea Prencipe
Department of Business and Management LUISS Viale Romania 32, Roma 00197, Italy
Received 5 November 2013 Accepted 28 January 2015 Published 9 October 2015
This paper illustrates how organizations change their architecture in response to environ-mental feedback, measured in relation to performance gaps. Based on a study of 762 organi-zations, we explore the modus operandi underpinning architectural change and argue that the interplay between social and historical aspiration levels: (i) constitutes a benchmark against which organizations measure current performance; and (ii) de¯nes the scope of architectural change. While a small performance gap leads organizations to implement minor architectural changes (adaptation strategy), a large performance gap requires major change (reorientation strategy).
Keywords: Adaptation; architectural change; performance gap; reorientation.
1. Introduction
Theoretical and empirical studies show that organizations comprise di®erent ele-ments, whose arrangement de¯nes their organizational architecture [Fjeldstad et al. (2012); Gulati and Puranam (2009); Simon (1947)]. Organizations strive to recon-¯gure their organizational elements in order to increase their ¯t with the external environment: they modify constituent elements to address new opportunities and respond to new pressures resulting from a changing environment [Kim and Rhee (2009); Lawrence and Lorsch (1986); Milgrom and Roberts (1995); Siggelkow (2002); Yeh and Fang (2011); Zott and Amit (2008)]. The extant literature highlights that external feedback is a major in°uence on architectural change
*Corresponding author.
Vol. 13, No. 1 (2016) 1650002 (21 pages)
#
.
c World Scienti¯c Publishing CompanyDOI:10.1142/S0219877016500024
Int. J. Innovation Technol. Management 2016.13. Downloaded from www.worldscientific.com
[Bensaou and Venkatraman(1995);Burns and Stalker(1961);Dennis and Meredith (2000); Galbraith (1973); Labianca et al. (2009); Snow et al. (2005)]. Although it o®ers valuable insights into the relationship between environmental feedback and architectural change, little is known about the scope of these changes. This paper investigates the extent of changes in organizational architecture prompted by environmental feedback.
The existence of a variety of scope in architectural change is suggested in Sig-gelkow[2001], which identi¯es a set of strategic options: (i) playing the old game!!! i.e. the organization retains the existing con¯guration; (ii) playing an incomplete game !!! i.e. the organization changes one or a few elements; (iii) playing a new game!!! i.e. the organization changes the whole range of its elements. To explain the incomplete game situation, Siggelkow [2001] reports the case of US automotive organizations, which, in the 1980s, observed a gap in their performance compared to Japanese competitors. These organizations had played an incomplete game for many years, by imitating a small number of the elements of the Japanese production system [Hayes and Iuikumar(1988);Siggelkow(2001, p. 842)]. A famous example of a successful \playing a new game" strategy is the transition towards services ac-complished by IBM at the beginning of the 1990s. In response to increasing com-petition, IBM's newly appointed CEO, Louis Gerstner, implemented radical changes to the organization that modi¯ed every element of the old con¯guration!!! such as human capital, productive processes, role of information and communication tech-nologies (ICT) [Bramante et al.(2010);Gerstner (2002); Lichtenthal and Copulsky (1993)].
Relying on insights from studies on organizational architectures [Fjeldstad et al. (2012); Gulati and Puranam (2009); Mendelson (2000)] and aspiration levels [Gavetti et al.(2012);Greve(1998);Washburn and Bromiley(2012)], we explore the relationships between the scope of architectural change and performance gaps prompted by the interplay between social and historical aspiration levels. Although organizations are usually risk averse, they are more likely to take risks if they are failing to achieve their goals or aspirations [Greve (1998)]. Their own past perfor-mance and the perforperfor-mance of competitors respectively de¯ne social and historical aspiration levels. Comparison between current performance and social/historical aspiration levels de¯nes the performance gap that will overcome organizational risk aversion and push the organization to embark on architectural changes [Grinyer and Mckiernan (1990); Kahneman and Tversky (1979); Labianca et al. (2009); Vissa et al. (2010)].
This study uses an original database, constructed by merging information from two waves of a survey conducted by Unicredit, an Italian Bank Group. The ¯ndings suggest that organizations modify their architecture when the level of performance becomes distant from the desired level. Organizations pursue di®erent strategies according to the extent of this performance gap, i.e. the size of the gap in°uences the scope of change. A small performance gap leads organizations to introduce minor changes to their architecture. We describe this as an adaptation strategy. When the performance gap is large, major modi¯cations are implemented, which we would
Int. J. Innovation Technol. Management 2016.13. Downloaded from www.worldscientific.com
describe as a reorientation strategy. We propose a model to re°ect the patterns of architectural changes induced by performance gaps.
2. Theoretical Background
The term architecture is used to characterize structures [Fjeldstad et al. (2012)]. It can be applied to various domains including products [Sanchez and Mahoney (2003)], industries [Jacobides (2005)] and organizations [Ethiraj and Levinthal (2004); Gulati and Singh (1988)]. Management scholars introduced the concept of architecture to conceptualize organizations as systems of elements whose interplay with the environment de¯nes the organization's evolutionary path [Dosi and Grazzi (2006); Ethiraj and Levinthal (2004); Fixson and Park (2008); Jacobides (2006); Mendelson(2000)]. Our work builds on the de¯nition of organizational architecture proposed by Mendelson [2000] and Gulati and Puranam [2009]. Mendelson [2000] identi¯es a set of core elements of organizational architecture through an investi-gation of how information is processed and distributed within the organization. By de¯ning the organization as an information-processing system that assimilates in-formation from the external context and matches it with internal inin-formation, Mendelson focuses on information awareness as the key to understanding organi-zational architecture. Several contributions explore the theoretical and empirical consequences of the interplay between the formal and informal components of or-ganizational architectures [Gulati and Puranam (2009); Jansen et al. (2009); Soda and Zaheer (2012)]. Focusing on changes between formal elements !!! i.e. the normative social system !!! and informal elements !!! i.e. the patterns of social interaction that emerge within an organization !!! Gulati and Puranam[2009] un-derstand the organizational architecture in terms of combinations of choices.
Organizations change their architecture to align with the characteristics of the environment [Drazin and Van de Ven (1985); Duncan (1972); Mckinley (2011); Stoeberl et al.(1998); Venkatraman(1989)]. Organization theory provides di®erent perspectives from which to interpret organizational change. Population ecologists emphasize peremptory environmental determinism [see, e.g. Hannan and Freeman (1984)]. They build on Stinchcombe [1965] and claim that organizations often are inert as a result of various attrition forces. These attrition forces include cognitive lock-in, produced by the initial mode of operation or imprinting and by a lack of search for information on relevant contingencies to which it might be worth adapting. Inspired by contingency theory, Zajac et al. [2000] and Siggelkow [2001] discuss the e®ectiveness of organizational change and argue that a straightforward application of contingency theory contemplates the possibility of bene¯cial inertia. When environmental contingencies change, organizations need to modify accord-ingly, but when these contingencies are relatively stable, it might be more convenient for organizations to remain stable [McCarthy et al. (2010); Sutherland and Smith (2011)]. This suggests that, under some circumstances, organizational stability is bene¯cial [Tushman and Romanelli (1985)]. Grandori and Prencipe [2008, p. 235] label this \contingently e®ective invariance", arguing that the reason for stability is not continuation of a state, but absence in the organization's environment of threats
Int. J. Innovation Technol. Management 2016.13. Downloaded from www.worldscientific.com
that are contingently e®ective. If the organization perceives threats in the environ-ment, it will likely develop a new con¯guration that would ensure the permanence of external ¯t [Siggelkow (2001)]. Therefore, the decision to change the organizational architecture is in°uenced heavily by the perception of possible threats in the orga-nization's environment.
The literature on managerial cognition argues that managers' bounded ratio-nality and their resulting propensity to rely on simpli¯ed representations of the world to process information, are issues that are relevant to an analysis of the organizational propensity to change [Buyl et al. (2011); Cyert and March (1963); Garud and Rappa (1994); Kaplan (2011); Levinthal and March (1993); March (1988); Simon(1955); Tripsas and Gavetti (2000); Wiklund and Shepherd(2003)]. Kiesler and Sproull [1982] explain that cognitive representations typically are based on historical experience as opposed to current conditions. Cognitive representations and the attention patterns of organizational members de¯ne the organization's as-piration level !!! i.e. the line between perceived success and failure [Greve (1998); Lopes(1987);Schneider(1992)]. More precisely, an aspiration level can be described as a \reference point that is psychologically neutral" [Kameda and Davis (1990, p. 56)] or as \the smallest outcome that would be deemed satisfactory by the decision maker" [Schneider(1992, p. 1053)].
Greve [1998; 2003] suggests that organizations process environmental feedback by comparing their performance with that of other organizations in the same in-dustry, and by comparing their current with their past performance. Organizations, thus, use two aspiration levels: a social aspiration level, based on comparison with competitors, and a historical aspiration level, based on comparison with its past performance [Cyert and March (1963); Wood (1989)]. Organizations, similar to many individuals, tend to be risk averse since risky choices open them to many unpredictable outcomes and introduce the threat of poor results. Although orga-nizations might appear resistant to change, in some circumstances, such as if they are failing to achieve goals or aspirations, they will pursue radical architectural change [Greve (1998)]. Social comparison theory suggests that aspiration levels are related to the comparison with the performance of similar others [Cyert and March (1963); Festinger (1954); Labianca et al. (2009)]. Organizations do not evaluate their abilities by comparing with others who are too divergent from them. Their abilities must be fairly similar for an accurate evaluation and comparison. Conse-quently, organizations compare their performance with that of other similar orga-nizations. In addition, aspiration theory argues that organizations compare with their performance history [Cyert and March (1963); Greve (2002); Levinthal and March (1993)].
3. Hypotheses Development
As long as the environment poses no threats, a stable organization is bene¯cial [Tushman and Romanelli (1985)]. However, in the presence of threats in the environments, stability is a liability for the ¯rm [Siggelkow (2001)]: organizations
Int. J. Innovation Technol. Management 2016.13. Downloaded from www.worldscientific.com
need to maintain alignment with the contingencies in their environment [Kraatz and Zajac (2001)]. The literature on individual and organizational risk taking explains that decisions to undertake high-risk strategies depend on the context of the choice [Greve (1998); Lopes (1987); Thaler and Johnson (1990)]. In any organizational context, managers take fewer risks if performance exceeds their goals; high organi-zational risk taking is related to low performance relative to aspiration levels [Bowman (1982); Bromiley (1991); Grinyer and Mckiernan (1990); Singh (1986)]. Managers will accept the risks associated with change if they perceive the presence of a performance gap [Chattopadhyay et al. (2001)]. We posit that organizations process environmental feedback and de¯ne aspiration levels by comparing current levels of performance with: (i) previous performance; and (ii) the performance of organizations operating in the same industry. When the organization perceives a gap between its performance and social or historical aspiration levels, it implements architectural changes. We therefore expect the following.
Hypothesis 1. A performance gap increases the likelihood that the organization will modify its architecture.
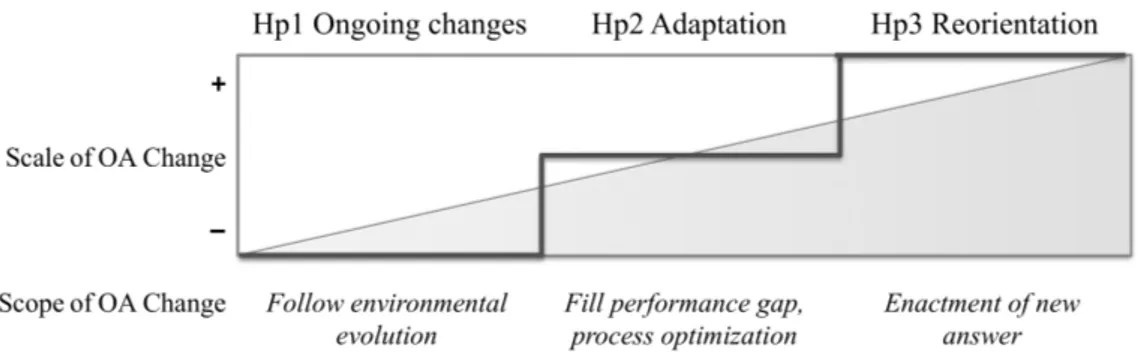
We submit that organizations face two options when implementing architectural changes. First, if both social and historical aspiration levels are in line with the organization's actual performance, it will make the decision to implement ongoing changes to its architectural elements. The aim is to adjust these elements such that they evolve with naturally occurring environmental changes [Feldman (2000); Tsoukas and Chia (2002)]. For example, the organization's ICT architecture needs to be periodically updated to keep pace with technological developments. Second, if the organization's social or historical levels are not aligned to performance, the gap must be ¯lled. The size of the performance gap will in°uence the organization's strategy: adaptation or reorientation.
3.1. Adaptation strategy
A partial misalignment with either the social or historical aspiration level creates a small performance gap that makes expected outcomes generally good. This requires minor changes involving only a few organizational elements. The organization might decide to adopt an imitation strategy in order to bridge the gap with other orga-nizations in its comparison group, or with its past results. This strategy reduces the riskiness associated with change and is legitimated by the dominant behavior in the industry. It provides a way to manage uncertainty and gain legitimacy; imitation of organizational structures is driven by the norms of rationality [Meyer and Rowan (1977)] and uncertainty [Di Maggio and Powell (1983)]. Unusual and innovative practices are rarely adopted [Massini et al. (2005)]. The scope of this type of ar-chitectural change is to solve a locally de¯ned problem, e.g. to decrease the cost of production through the use of o®shoring. The organization's actions are aimed at modifying a single element and, therefore, respond to a problem that involves a small number of actors as opposed to the whole organization. The search for a local solution is preferred due to its lower risks. An example of this is Daehan Steel, a
Int. J. Innovation Technol. Management 2016.13. Downloaded from www.worldscientific.com
Korean organization that undertook a business transformation project to enable its future growth as \a total steel solution provider". The transformation project was aimed at ¯lling a performance gap with its competitors. Daehan Steel implemented a complete modi¯cation of its ICT architecture (contract management system, stan-dard cost management, supply chain management, operation system, enterprise resources planning system, pricing strategy planning and diagnosis of ICT opera-tions), which facilitated its growth in the global marketplace [IBM (2010)]. Thus, our second hypothesis is as follows.
Hypothesis 2. A small performance gap increases the likelihood that the organi-zation will implement an adaptation strategy based on minor architectural changes. 3.2. Reorientation strategy
Organizations may deal with a misalignment of their performance with both social and historical aspiration levels, i.e. a large gap, resulting in reduced competitiveness with peers, and poor outcomes compared to their past performance. To overcome this, organizations pursue major, thus more risky, changes to their architecture [March and Shapira (1987)]. This is consistent with the work of Yasai-Ardekani [1989] which argues that organizations respond to perceived environmental pressures by making structural architectural changes. The magnitude of these changes is large, since they involve all the elements of the organizational architecture. The large size of the gap suggests a mismatch between external conditions and the organizational architecture and modi¯cations to only one or two elements is likely not to be su±-cient. The organization needs to react to the challenges posed by the competitive context: the scope of change in this case will be radically di®erent from the changes involved in an adaptation strategy.
Marks and Spencer's restructuring is an example of a reorientation strategy. In 1998, the retailer's revenues and pro¯ts were on a downward spiral [Beaver(1999)]. The gap with its historical performance and its competitors forced the new CEO to implement radical architectural change whose scope included: decentralization of operations, restructuring of the internal organization, changes at top management level, revisions to human resources policies and implementation of new technologies [Davies(1999);Grundy(2005);Jackson and Sparks(2005);Merriden(2000);Rippin (2005)]. The changes a®ected every elements of the organizational architecture. Our third hypothesis is as follows.
Hypothesis 3. A large performance gap increases the likelihood that the organi-zation will implement a reorientation strategy involving major architectural changes.
The three hypotheses are depicted in Figs.1and2. Figure1summarizes the types of organizational change and their scale and scope. Figure 2 shows the relation between: (i) the dimensions of the architectural changes; and (ii) environmental feedback.
Int. J. Innovation Technol. Management 2016.13. Downloaded from www.worldscientific.com
4. Methods 4.1. The data
To address the research questions, we merged two waves of a large survey conducted by Unicredit, an Italian Bank Group. The data referred to two three-year periods: 2001–2003 and 2004–2006. In each wave, Unicredit selected a statistically signi¯cant sample of organizations and realized a mixed type sample selection based on a sample survey for organizations with 11–500 employees and a census survey of organizations with more than 500 employees. The samples are representative of Italian manufacturing organizations and they have 80 layers made by ¯ve-size classes, four macro-areas and four sectors. The response rates were 28.5% in the ¯rst wave and 25% in the second wave. After deleting observations with missing values for one or more variables, we obtained a ¯nal sample of 762 organizations.
4.2. The research strategy
The empirical strategy consisted of two steps. First, in order to measure the multidimensionality of the organizational architecture, we use principal component analysis (PCA). PCA identi¯es a proxy for the elements de¯ning organizational architecture. Second, to understand the e®ect of a performance gap on di®erent degrees of architectural change, we conduct logit and nested logit regression analyses.
Fig. 2. Architectural changes and environmental feedback. Fig. 1. Conceptualization of architectural changes.
Int. J. Innovation Technol. Management 2016.13. Downloaded from www.worldscientific.com
4.3. Dependent variables
To identify the key elements of organizational architecture, following Gulati and Puranam [2009] andMendelson[2000], we select formal architectural elements that facilitate transferring and processing of knowledge and information within the or-ganization. We focus on formal organization elements since it is possible to change those elements relatively rapidly [Lamont et al.(1994)]. We identi¯ed: (i) ICT; (ii) international; (iii) hierarchical; and (iv) human capital.
The ICT element of organizational architecture refers to the presence of tools that facilitate information and knowledge °ows within the organization. ICT enables knowledge sharing that reduce temporal and spatial barriers, and the creation of information storage for data for use by virtual knowledge teams [Kristof et al. (1995)]. ICT improves communication, facilitates interactions among employees and reduces isolation. It enhances the organization's e±ciency by reducing the costs related to timing of interaction and increasing the e®ectiveness of communications [Love et al.(2006);Santa et al. (2009)].
The international element re°ects the organization's involvement in international markets. When organizations internationalize, they need to assume new knowledge, including experiential knowledge of speci¯c foreign business practices, institutional norms and general experiential learning of how to organize for foreign competition. Exposure to international markets involves the processing of unique and activity-speci¯c knowledge [Cantwell (1989); Eriksson et al.(1997); Ghoshal (1987)].
The hierarchical element in the organizational architecture refers to the distri-bution of decision power within the organization.Simon[1969] claims that hierarchy is a mechanism for coordinating a complex system comprised of multiple specialized units. Since organizations are viewed as institutions for integrating knowledge, hi-erarchical coordination involves decisions about the mechanisms through which knowledge is di®used within the organization [Grant (1996); Jensen and Meckling (1976); Joseph and Ocasio (2012); Karim and Williams(2012)].
The human capital element of organizational architecture captures the presence of quali¯ed workers and their involvement in knowledge intensive and research and development (R&D) activities. The organization's investment in such activities potentially augments existing stocks of internal knowledge [Cohen and Levinthal (1990); Yeh and Fang(2011)].
The multidimensional nature of organizational architecture calls for PCA. We used 18 items (nine from each wave) of the Unicredit questionnaire. The chosen items are: ICT, ICT intensity, ICT tools, Export intensity, Countries export, Con-centration of power, Group control, Percentage of employees involved in R&D ac-tivities and Percentage of employees with a degree.
The ¯rst set of variables captures the ICT element: ICT is a dummy variable indicating whether the organization invests in ICT; ICT intensity measures the per-centage investment in ICT over total investment in machinery and other equipment and ICT tools measures the variety of the ICT tools used through the Her¯ndahl– Hirschman index of investment in hardware, software and telecommunications infrastructure.
Int. J. Innovation Technol. Management 2016.13. Downloaded from www.worldscientific.com
We measure the international element through the following variables: Export intensity, the ratio between export sales and overall sales, and Countries export, the number of countries to which the organization exports its products/services. These two variables capture di®erent dimensions of the international element and include quantitative (sales) and qualitative (number of countries) aspects.
The third set of variables measures the hierarchical element and it comprises: Concentration of power, the Her¯ndahl–Hirschman index of the stock owned by the three most important shareholders, and Group control, a discrete variable that takes the value zero if the organization is not part of a corporate group and the values 1, 2 or 3 according to the organization's position within the group, respectively leading, partially owned or fully owned. This item measures the organization management's autonomy to make strategic decisions.
The last set of variables represents the human capital element: Percentage of employees involved in R&D activities is the share of employees working in or con-nected to the R&D function, in total number of employees; Percentage of employees with a degree is the share of employees with a university degree in total number of employees, which is used to estimate the percentage of high-skilled people working in the organization.
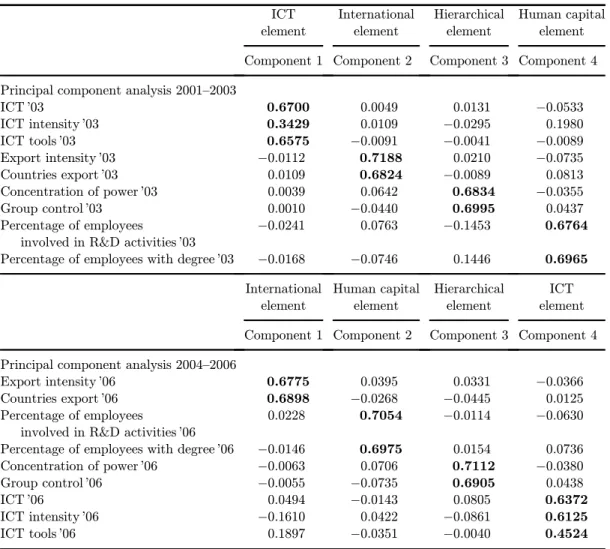
We perform separate PCA for each wave, on the selected items, with a varimax orthogonal rotation using the GPF algorithm (see Tables 1 and 2). We use the vgpf option in Stata; this option supports retention of the four components identi¯ed.
The PCA allows us to measure the principal components of the organizational architecture. Elements are formed through the aggregation of items tapping into each construct, weighted by their respective component scores. We conducted several tests to assess the psychometric properties of the measures. With the ex-ception of one item which showed a lower value, factor loadings exceeded the recommended cuto® value of 0.60. The analysis allows us to measure the four elements de¯ning organizational architecture: ICT element (ICT, ICT intensity, ICT tools); international element (Export intensity, Countries export); hierarchical element (Concentration of power, Group control); human capital element (Per-centage of employees involved in R&D activities, Per(Per-centage of employees with a degree).
To measure the architectural change, we examine the changes in each element between 2001–2003 and 2004–2006 and create two dependent variables: Change dummy and Architectural change. Change dummy takes the value 1 if the organi-zation made at least one signi¯cant change in one of the elements of its architecture and 0 otherwise. Architectural change takes the value 0 if the organization made no signi¯cant changes to any of the elements of its architecture and 1 if the organization made signi¯cant changes to one or two elements (adaptation) and takes the value 2 if the organization implements changes to three or four elements (reorientation). Change is signi¯cant if the absolute value of the di®erence between the value of the element in 2001–2003 and its value in 2004–2006 is more than one standard devia-tion distance from the mean.
Int. J. Innovation Technol. Management 2016.13. Downloaded from www.worldscientific.com
4.4. Independent variables
Our independent variables measure the performance gap. An organization compares its performance with average industry-level performance. The di®erence between the organization's performance measured as the organization's total sale in 2003 and the
Table 1. Matrix of factor loadings. ICT element International element Hierarchical element Human capital element
Component 1 Component 2 Component 3 Component 4
Principal component analysis 2001–2003
ICT '03 0.6700 0.0049 0.0131 !0.0533 ICT intensity '03 0.3429 0.0109 !0.0295 0.1980 ICT tools '03 0.6575 !0.0091 !0.0041 !0.0089 Export intensity '03 !0.0112 0.7188 0.0210 !0.0735 Countries export '03 0.0109 0.6824 !0.0089 0.0813 Concentration of power '03 0.0039 0.0642 0.6834 !0.0355 Group control '03 0.0010 !0.0440 0.6995 0.0437 Percentage of employees
involved in R&D activities '03
!0.0241 0.0763 !0.1453 0.6764
Percentage of employees with degree '03 !0.0168 !0.0746 0.1446 0.6965
International element Human capital element Hierarchical element ICT element
Component 1 Component 2 Component 3 Component 4
Principal component analysis 2004–2006
Export intensity '06 0.6775 0.0395 0.0331 !0.0366
Countries export '06 0.6898 !0.0268 !0.0445 0.0125
Percentage of employees
involved in R&D activities '06
0.0228 0.7054 !0.0114 !0.0630
Percentage of employees with degree '06 !0.0146 0.6975 0.0154 0.0736
Concentration of power '06 !0.0063 0.0706 0.7112 !0.0380
Group control '06 !0.0055 !0.0735 0.6905 0.0438
ICT '06 0.0494 !0.0143 0.0805 0.6372
ICT intensity '06 !0.1610 0.0422 !0.0861 0.6125
ICT tools '06 0.1897 !0.0351 !0.0040 0.4524
Table 2. Results of principal component analysis.
Components Eigenvalue Percentage of variance explained Cumulative percent
Principal component analysis 2001–2003
1 2.170 0.241 0.241
2 1.6220 0.180 0.421
3 1.302 0.144 0.566
4 1.071 0.119 0.685
Principal component analysis 2004–2006
1 1.671 0.185 0.185
2 1.475 0.163 0.349
3 1.180 0.131 0.481
4 1.047 0.116 0.597
Int. J. Innovation Technol. Management 2016.13. Downloaded from www.worldscientific.com
average performance of organizations in the same sector, de¯nes the social aspiration level. The organization compares its current with its previous performance; the di®erence between total sales in 2001 and total sales in 2003 de¯nes the historical aspiration level. We use social and historical aspiration levels to build our inde-pendent variables. The di®erence between current performance and aspiration levels represents the organization's performance gap. We consider that the gap is the negative di®erence between actual performance and aspiration levels. It is implau-sible that an organization with performance far above that of the competition, such as Microsoft, would aspire to the achievement of lower levels of performance to match industry predictions [Washburn and Bromiley(2012)]. In the ¯rst model, we include Performance gap as an independent variable; it takes the value 1 if either of two cases is observed: (i) a negative gap between current performance and either its social or historical aspiration level; (ii) a negative gap between current organization performance and both its social and historical aspiration levels. In the second and in the third models, we include Small gap and Large gap as independent variables. Small gap takes the value 1 if there is a negative gap between the organization's current performance and either historical aspiration level or social aspiration level, and 0 otherwise. Large gap takes the value 1 if there is a negative gap with both historical aspiration and social aspiration levels, and 0 otherwise. The construction of our measures is in line with Washburn and Bromiley[2012].
4.5. Control variables
We include a set of control variables to account for variables that might a®ect the relation between performance gap and architectural changes. We control for Size, measured as total sales in 2003, and for Age, calculated as the number of years since the ¯rm's foundation. Also, we include Innovation and R&D intensity. Innovation is a dummy variable that takes the value 1 if the organization introduced at least one product, process or organizational innovation during the three years 2001–2003. R&D intensity is the ratio of R&D expenditure to total sales in 2003. To control for sector speci¯cities, in the models we include R&D intensity by industry and a series of dummy variables for Pavitt sectors [Pavitt (1984)], i.e. supplier dominated, scale intensive, specialized supplier, science-based. Finally, we control for organization context through four dummy variables for location of the organization in Italy !!! North-East; North-West; Center and South.
We perform Harman's one-factor test on the organization-level variables included in the models to examine whether common method bias might be augmenting the relations detected. We found multiple factors; since the ¯rst factor did not account for the majority of the variance (it accounted for only 0.12%), potential problems asso-ciated with common method bias were not indicated [Podsako® and Organ(1986)].
5. Results
Table3reports descriptive statistics for the variables included in the models. None of the correlations are so high as to suggest problems related to multicollinearity.
Int. J. Innovation Technol. Management 2016.13. Downloaded from www.worldscientific.com
Tabl e 3. Desc riptive statis tics and corr elation mat rix. Varia ble Mea n Std. dev. 1 2 3 4 5 6 7 8 9 10 11 12 13 14 15 16 17 1 Change dumm y 0.61 0.49 2A rc h it ec tu ra l ch ange 0.33 0.47 0.00 3 Performan ce gap 0.65 0.48 0.07 0.00 4 Adapt ation " Sm all gap 0.15 0.36 0.03 0.24 0.33 5 Reorie ntation " Sm all gap 0.15 0.36 0.03 ! 0.27 0.33 ! 0.19 6 Adapt ation " La rge gap 0.06 0.25 0.00 0.09 0.18 ! 0.10 ! 0.10 7 Reorie ntation " La rge gap 0.06 0.25 0.00 ! 0.13 0.18 ! 0.10 ! 0.10 ! 0.06 8S iz e (m il li o n ) 4 5 .6 0 1 2 3 .0 0 ! 0.01 0.00 0.22 ! 0.03 ! 0.03 0.21 0.21 9 Age 31.23 21.13 ! 0.04 0.00 ! 0.06 ! 0.04 ! 0.04 0.02 0.02 0.01 10 Innovat ion 0.73 0.45 0.03 0.00 0.06 0.03 0.03 0.00 0.00 0.06 0.12 11 R&D intensity 0.01 0.02 0.09 0.00 0.02 0.01 0.01 0.00 0.00 0.03 ! 0.03 0.19 12 R&D intensity by industry 0.01 0.01 0.10 0.00 ! 0.01 ! 0.01 ! 0.01 0.00 0.00 0.00 ! 0.09 0.14 0.39 13 Scale inte nsive 0.17 0.38 0.05 0.00 0.07 0.02 0.02 0.02 0.02 0.05 ! 0.03 ! 0.01 ! 0.07 ! 0.14 14 Specialized sup pliers 0.31 0.46 0.04 0.00 0.00 0.01 0.01 ! 0.01 ! 0.01 ! 0.03 ! 0.04 0.15 0.14 0.38 ! 0.29 15 Science -based 0.04 0.18 0.09 0.00 ! 0.02 0.00 0.00 ! 0.01 ! 0.01 0.04 0.03 0.04 0.21 0.48 ! 0.09 ! 0.12 16 North – East 0.32 0.47 0.01 0.00 0.09 0.02 0.02 0.03 0.03 0.07 ! 0.08 0.02 0.01 0.08 ! 0.07 0.12 0.02 17 Center 0.19 0.39 ! 0.09 0.00 ! 0.02 0.00 0.00 ! 0.02 ! 0.02 ! 0.05 ! 0.05 ! 0.06 ! 0.03 ! 0.07 0.03 ! 0.12 ! 0.05 ! 0.33 18 South 0.12 0.33 0.03 0.00 ! 0.02 ! 0.02 ! 0.02 0.02 0.02 0.03 ! 0.11 ! 0.04 ! 0.06 ! 0.08 0.09 ! 0.18 0.00 ! 0.25 ! 0.17
Int. J. Innovation Technol. Management 2016.13. Downloaded from www.worldscientific.com
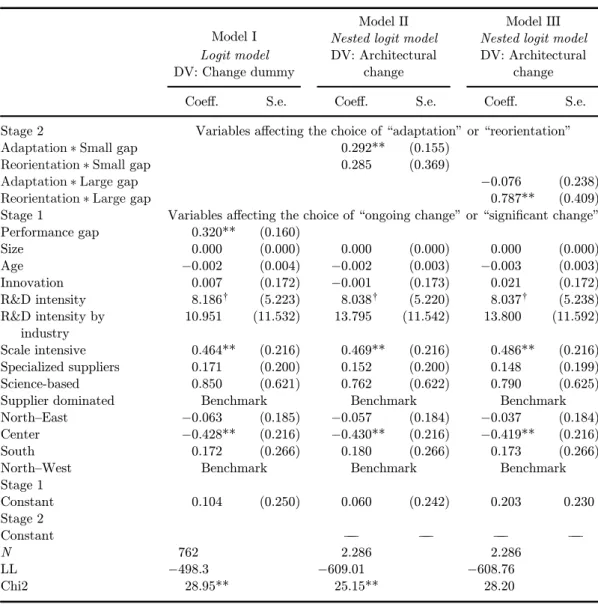
We apply a logit model to investigate Hypothesis 1. The ¯rst column in Table 4 shows the results. We support Hypothesis 1 to the extent to which the existence of a Performance gap is positive and signi¯cant in explaining architectural changes.
To investigate Hypotheses 2 and 3, we use a nested logit estimation technique splitting the econometric estimation into two steps since our dependent variable, Architectural change, can be considered a two-stage decision. The nested logit model, ¯rst proposed by Ben-Akiva [1973], represents an extension of the multino-mial logit model. However, the multinomultino-mial logit su®ers from independence of ir-relevant alternatives (IIA), a disadvantage caused by a property of the multinomial logit that assumes that the relative probability of choosing between two alternatives is not a®ected by the presence of additional alternatives. In our case, the alternatives are not independent since, as suggested by Hannan et al. [2003], changes in one architectural element are likely to result in a cascade of changes to other architec-tural elements.
Since the IIA assumption is violated, we use a nested logit model to group alternatives into subgroups (nests) such that the IIA is valid within each subgroup [Train (2003); Winkelmann and Boes (2006)]. Figure 3 depicts the setup of the speci¯ed model. It shows the asymmetric nature of the data in the sense that the second level outcome is available only if the respondent provides a positive response in the ¯rst level. Among the 762 observations considered, 302 (40%) made no sig-ni¯cant architectural changes, 423 (56%) adapted their organizational architecture and the remaining 30 (4%) reoriented their organizational architecture. We follow Drucker and Puri [2005] and use interaction e®ects to implement this asymmetric speci¯cation. The nested logit modeling technique also requires some reshaping of the data to observe each organization once for each of the three possible outcomes in the tree depicted in Fig. 3. Thus, we are analyzing 2286 observations. Table 4 presents the results of the nested logit regressions examining the presence of ar-chitectural changes as opposed to the absence of changes to the architecture. The base category is the organization that has not changed its architecture. Table 4, Column 1 reports the results of the logit estimation (Model I); Column 2 (Model II) presents the results of the model considering Small gap as the independent variable;
Fig. 3. Nesting structure of the implemented strategy.
Int. J. Innovation Technol. Management 2016.13. Downloaded from www.worldscientific.com
Column 3 (Model III) reports the regression results for Large gap as independent variable.
Our results support Hypothesis 2: we ¯nd that Small gap is positive and signi¯-cant in explaining the adaptation strategy, but not signi¯signi¯-cant for reorientation. We ¯nd empirical support also for Hypothesis 3: Large gap is positive and signi¯cant in explaining major architectural changes leading the organization to implement a reorientation strategy.
6. Discussion and Conclusion
This study investigated how organizations react to feedback from the environment. Our results suggest that organizations modify their architecture when their levels of performance fall below desired levels. We show that organizations pursue di®erent
Table 4. Econometric models.
Model I
Model II Model III
Logit model
Nested logit model Nested logit model
DV: Change dummy
DV: Architectural change
DV: Architectural change
Coe®. S.e. Coe®. S.e. Coe®. S.e.
Stage 2 Variables a®ecting the choice of \adaptation" or \reorientation"
Adaptation" Small gap 0.292** (0.155)
Reorientation" Small gap 0.285 (0.369)
Adaptation" Large gap !0.076 (0.238)
Reorientation" Large gap 0.787** (0.409)
Stage 1 Variables a®ecting the choice of \ongoing change" or \signi¯cant change"
Performance gap 0.320** (0.160) Size 0.000 (0.000) 0.000 (0.000) 0.000 (0.000) Age !0.002 (0.004) !0.002 (0.003) !0.003 (0.003) Innovation 0.007 (0.172) !0.001 (0.173) 0.021 (0.172) R&D intensity 8.186† (5.223) 8.038† (5.220) 8.037† (5.238) R&D intensity by industry 10.951 (11.532) 13.795 (11.542) 13.800 (11.592) Scale intensive 0.464** (0.216) 0.469** (0.216) 0.486** (0.216) Specialized suppliers 0.171 (0.200) 0.152 (0.200) 0.148 (0.199) Science-based 0.850 (0.621) 0.762 (0.622) 0.790 (0.625)
Supplier dominated Benchmark Benchmark Benchmark
North–East !0.063 (0.185) !0.057 (0.184) !0.037 (0.184)
Center !0.428** (0.216) !0.430** (0.216) !0.419** (0.216)
South 0.172 (0.266) 0.180 (0.266) 0.173 (0.266)
North–West Benchmark Benchmark Benchmark
Stage 1 Constant 0.104 (0.250) 0.060 (0.242) 0.203 0.230 Stage 2 Constant !!! !!! !!! !!! N 762 2.286 2.286 LL !498.3 !609.01 !608.76 Chi2 28.95** 25.15** 28.20
Note: One-tailed tests: †p < 0:10; *p < 0:05; **p < 0:01; ***p < 0:001. Standard errors (S.e.) in
paren-theses.
Int. J. Innovation Technol. Management 2016.13. Downloaded from www.worldscientific.com
strategies in order to align their architectures to the conditions of the environment. We used an alternative discrete model for dimension of performance gap in°uencing decision related to adaptation or reorientation. To compute performance gap we used historical and social aspiration levels. When performance is misaligned to one dimension of one of the aspiration levels, minor changes will be made to the orga-nization's architecture!!! i.e. it will pursue an adaptation strategy. When the mis-alignment is with both the historical and social aspiration levels, the organization will implement major changes to reorient its architecture.
This study has three implications for academic research. First, it contributes to the emerging scholarly debate on the characteristics of organizational architecture and the decision processes underlying changes to it [Buyl et al. (2011); Fjeldstad et al. (2012); Gulati and Puranam (2009); Gulati et al. (2012); Soda and Zaheer (2012)]. We explored the dynamics of architectural change by measuring modi¯ca-tions to its constitutive elements, which adds to our understanding of the decom-position property of organizational architecture [Augier and Sarasvathy (2004); Simon (1969)]. Our results suggest that the size of the performance gap in°uences the number of elements that are changed. The decomposition property underpins our understanding of the evolution of organizational architecture by enabling a balance between the need for change !!! highlighted by the observed performance gap !!! and the risks associated with it.
Second, this paper contributes to the literature on organizational change [McCarthy et al. (2010); Nickerson and Zenger (2002); Tsoukas and Chia (2002); Tushman and Romanelli (1985)]. We show that organizational change can be represented as a nested model: organizations can undertake ongoing change, adap-tation, or reorientation. This adds to Nickerson and Zenger's [2002] ¯ndings that proved through simulation models that organizations realign their structure to the environment based on an alternative discrete model. Using empirical data, we demonstrate that the size of the performance gap is the watershed where the advantages of organizational stability are lower than the losses in competitive advantages.
Third, this study bridges between two important research streams: aspiration level [see, e.g. Gavetti et al. (2012); Greve (1998)] and architectural change. Sus-tained poor performance, amongst other things, triggers architectural change. Echoing contingency theory [see, e.g. Siggelkow (2001)] this study throws light on this phenomenon: gaps in performance highlight failures to achieve aspiration levels, which then leads to architectural change. This enriches our understanding of the organizational dilemma of choosing stability versus change [Tushman and Romanelli (1985)]: successful organizations prefer ongoing changes in order to reduce or avoid risks, but organizations that experience performance losses are likely to implement important turnaround.
6.1. Future research agenda and limitations
The study points to some interesting avenues for future research. In the context of the theory on aspiration level [Buyl et al.(2011);Gavetti et al.(2012)], organizations
Int. J. Innovation Technol. Management 2016.13. Downloaded from www.worldscientific.com
de¯ne the social aspiration level by comparing themselves with other organizations. In line with previous studies [see, i.e.Washburn and Bromiley(2012)], we identi¯ed the comparison group as organizations in the same industry. However, how orga-nizations select their comparison group varies and each organization uses a subjec-tive process [Massini et al.(2005)]. An intriguing extension to this study would be to explore organization-speci¯c comparison groups. Accurate identi¯cation of the ap-propriate comparison group would appear relevant for managers; since social aspi-ration level impacts on the scope of architectural changes, incorrect speci¯cation might lead to inappropriate reactions.
This study focuses also on the short-term e®ects of a performance gap on archi-tectural changes. Future research could investigate how archiarchi-tectural changes a®ect future performance. The long-term e®ect of the appropriateness of reorientation and adaptation strategies triggered by the existence of large or small gap could be in-vestigated.
This study has some limitations related to the interplay between organizations and their environment. The environment can change organizations but, at the same time, organizations can change the environment to an extent [Mckinley (2011)]. In this study, we could only observe how feedback from the environment a®ects organizations and not how organizations can modify their environment. Finally, we should acknowledge that the organization's strategy might depend on the char-acteristics of the geographical and social location. In this research, we used a sample of Italian manufacturing organizations; the result might depend on the speci¯cities of the Italian context.
References
Augier, M. and Sarasvathy, S. D. (2004). Integrating evolution, cognition and design: Extending Simonian perspectives to strategic organization. Strategic Organization, 2: 169–204.
Beaver, G. (1999). Competitive advantage and corporate governance !!! Shop soiled and needing attention! The case of Marks and Spencer Plc. Strategic Change, 8: 325–334. Ben-Akiva, M. (1973). Structure of passenger travel demand models. Thesis, Department
of Civil Engineering, MIT, Cambridge, Massachusetts.
Bensaou, M. and Venkatraman, N. (1995). Con¯gurations of interorganizational relation-ships: A comparison. Management Science, 41: 1471–1492.
Bowman, E. H. (1982). Risk seeking by troubled ¯rms. Sloan Management Review, 23: 33–42. Bramante, J., Frank, R. and Dolan, J. (2010). IBM 2000 to 2010: Continuously transforming
the corporation while delivering performance. Strategy and Leadership, 38: 35–43. Bromiley, P. (1991). Testing a causal model of corporate risk-taking and performance.
Academy of Management Journal, 34: 37–59.
Burns, T. and Stalker, G. (1961). The Management of Innovation. Tavistock, London. Buyl, T., Boone, C. and Matthyssens, P. (2011). Upper echelons research and managerial
cognition. Strategic Organization, 9: 240–246.
Cantwell, J. A. (1989). Technological Innovation and Multinational Corporations. Basil Blackwell, Oxford.
Chattopadhyay, P., Glick, W. H. and Huber, G. P. (2001). Organizational actions in response to threats and opportunities. Academy of Management Journal, 44: 937–955.
Int. J. Innovation Technol. Management 2016.13. Downloaded from www.worldscientific.com
Cohen, W. M. and Levinthal, D. A. (1990). Absorptive capacity: A new perspective of learning and innovation. Administrative Science Quarterly, 35: 128–152.
Cyert, R. and March, J. G. (1963). A Behavioral Theory of the Firm. Blackwell, Oxford. Davies, G. (1999). The evolution of Marks and Spencer. The Service Industries Journal, 19:
60–73.
Dennis, D. and Meredith, J. (2000). An empirical analysis of process industry transformation systems. Management Science, 46: 1085–1099.
Di Maggio, P. and Powell, W. (1983). The iron cage revisited: Institutional isomorphism and collective rationality in organizational ¯elds. American Sociological Review, 48: 147–160.
Dosi, G. and Grazzi, M. (2006). Technologies as problem-solving procedures and technologies as input–output relations: Some perspectives on the theory of production. Industrial and Corporate Change, 15: 173–202.
Drazin, R. and Van de Ven, A. (1985). Alternative forms of ¯t in contingency theory. Administrative Science Quarterly, 30: 514–539.
Drucker, S. and Puri, M. (2005). On the bene¯ts of concurrent lending and underwriting. Journal of Finance, 60, 6: 2763–2799.
Duncan, R. (1972). Characteristics of organizational environments and perceived environ-mental uncertainty. Administrative Science Quarterly, 17, 3: 313–327.
Eriksson, K., Johanson, J., Majkgard, A. and Sharma, D. D. (1997). Experiential knowledge and costs in the internationalization process. Journal of International Business Studies, 28: 337–360.
Ethiraj, S. K. and Levinthal, D. (2004). Bounded rationality and the search for organizational architecture: An evolutionary perspective on the design of organizations and their evolvability. Administrative Science Quarterly, 49: 404–437.
Feldman, M. (2000). Organizational routines as a source of continuous change. Organization Science, 11: 611–629.
Festinger, L. (1954). A theory of social comparison processes. Human Relations, 7: 117–140. Fixson, S. K. and Park, J. K. (2008). The power of integrality: Linkages between product
architecture, innovation, and industry structure. Research Policy, 37: 1296–1316. Fjeldstad, Ø. D., Snow, C. C., Miles, R. E. and Lettl, C. (2012). The architecture of
collaboration. Strategic Management Journal, 33: 734–750.
Galbraith, J. (1973). Designing Complex Innovations. Addison-Wesley, Reading, MA. Garud, R. and Rappa, M. A. (1994). A socio-cognitive model of technology evolution: The
case of cochlear implants. Organization Science, 5: 344–362.
Gavetti, G., Greve, H. R., Levinthal, D. A. and Ocasio, W. (2012). The behavioral theory of the ¯rm: Assessment and prospects. The Academy of Management Annals, 6: 1–40. Gerstner, L. (2002). Who Says Elephants Can't Dance? How I Turned Around IBM. Harper
Collins, New York.
Ghoshal, S. (1987). Global strategy: An organizing framework. Strategic Management Jour-nal, 8: 425–440.
Grandori, A. and Prencipe, A. (2008). Organizational invariants and organizational change: The case of Pilkington Plc. European Management Review, 5: 232–244.
Grant, R. (1996). Prospering in dynamically-competitive enviroments: Organizational capa-bility as knowledge integration. Organization Science, 7: 375–387.
Greve, H. R. (1998). Performance, aspirations, and risky organizational change. Adminis-trative Science Quarterly, 43: 58–86.
Greve, H. R. (2002). Sticky aspirations: Organizational time perspective and competitiveness. Organization Science, 13: 1–17.
Greve, H. R. (2003). A behavioral theory of R&D expenditures and innovations: Evidence from ship building. Academy of Management Journal, 46, 6: 685–702.
Grinyer, P. and Mckiernan, P. (1990). Generating major change in stagnating companies. Strategic Management Journal, 11, S1: 131–146.
Int. J. Innovation Technol. Management 2016.13. Downloaded from www.worldscientific.com
Grundy, T. (2005). Business strategy re-engineering and the bid battle for Marks and Spencer. Strategic Change, 14: 195–218.
Gulati, R. and Singh, H. (1988). The architecture of cooperation: Managing coordination costs and appropriation concerns in strategic alliances. Administrative Science Quarterly, 43: 781–814.
Gulati, R. and Puranam, P. (2009). Renewal through reorganization: The value of incon-sistencies between formal and informal organization. Organization Science, 20: 422–440. Gulati, R., Puranam, P. and Tushman, M. (2012). Meta-organization design: Rethinking design in interorganizational and community contexts. Strategic Management Journal, 33: 571–586.
Hannan, M. and Freeman, J. (1984). Structural inertia and organizational change. American Sociological Review, 49: 149–164.
Hannan, M. T., Polos, L. and Carroll, G. R. (2003). Cascading organizational change. Organization Science, 14: 463–482.
Hayes, R. and Iuikumar, R. (1988). Manufacturing crisis: New technologies, obsolete orga-nizations. Harvard Business Review, 68: 77–85.
IBM (2010). Daehan Steel selects IBM for business transformation initiative. Marketing Weekly News (March, 2010).
Jackson, P. and Sparks, L. (2005). Retail internationalisation: Marks and Spencer in Hong Kong. International Journal of Retail and Distribution Management, 33: 766–783. Jacobides, M. G. (2005). Industry change through vertical disintegration: How and why
markets emerged in mortgage banking. Academy of Management Journal, 48: 465–498. Jacobides, M. G. (2006). The architecture and design of organizational capabilities. Industrial
and Corporate Change, 15: 151–171.
Jansen, J. J. P., Tempelaar, M. P., Van Den Bosch, F. A. J. and Volberda, H. W. (2009). Structural di®erentiation and ambidexterity: The mediating role of integration mechan-isms. Organization Science, 20: 797–811.
Jensen, M. C. and Meckling, W. H. (1976). Theory of the ¯rm: Managerial behavior, agency costs and ownership structure. Journal of Financial Economics, 3: 305–360.
Joseph, J. and Ocasio, W. (2012). Architecture, attention, and adaptation in the multi-business ¯rm: General Electric from 1951 to 2001. Strategic Management Journal, 33: 633–660.
Kahneman, D. and Tversky, A. (1979). Prospect theory: An analysis of decision under risk. Econometrica, 47: 263–291.
Kameda, T. and Davis, J. H. (1990). The function of the reference point in individual and group risk decision making. Organizational Behavior and Human Decision Processes, 46: 55–76.
Kaplan, S. (2011). Research in cognition and strategy: Re°ections on two decades of progress and a look to the future. Journal of Management Studies, 48: 665–695.
Karim, S. and Williams, C. (2012). Structural knowledge: How executive experience with structural composition a®ects intra¯rm mobility and unit recon¯guration. Strategic Management Journal, 33: 681–709.
Kiesler, S. and Sproull, L. (1982). Managerial response to changing environments: Perspec-tives on problem sensing from social cognition. Administrative Science Quarterly, 27: 548–570.
Kim, T. and Rhee, M. (2009). Exploration and exploitation: Internal variety and environ-mental dynamism. Strategic Organization, 7: 11–41.
Kraatz, M. S. and Zajac, E. J. (2001). How resources a®ect strategic change and performance in turbulent environments: Theory and evidence. Organization Science, 12: 632–657. Kristof, A. L., Brown, K. G., Sims, H. P. and Smith, K. A. (1995). The virtual team: A case
study and inductive model. Advances in Interdisciplinary Studies of Work Teams: Knowledge Work in Teams, eds. Beyerlein, M. M., Johnson, D. A. and Beyerlein, S. T. JAI Press, Greenwich, CT, pp. 229–253.
Int. J. Innovation Technol. Management 2016.13. Downloaded from www.worldscientific.com
Labianca, G., Fairbank, J. F., Andrevski, G. and Parzen, M. (2009). Striving toward the future: Aspiration-performance discrepancies and planned organizational change. Strate-gic Organization, 7: 433–466.
Lamont, B. T., Williams, R. J. and Ho®man, J. J. (1994). Performance during \M-form" reorganization and recovery time: The e®ects of prior strategy and implementation speed. Academy of Management Journal, 37: 153–166.
Lawrence, P. and Lorsch, J. (1986). Organization and Environment: Managing Di®erentiation and Integration. Harvard Business School Press, Cambridge, MA.
Levinthal, D. A. and March, J. G. (1993). The myopia of learning. Strategic Management Journal, 14: 95–112.
Lichtenthal, J. D. and Copulsky, W. (1993). How big blue IBM became black and blue. Industrial Marketing Management, 22: 277–285.
Lopes, L. L. (1987). Between hope and fear: The psychology of risk. Advances in Experimental Social Psychology, ed. Leonard, B. Academic Press, pp. 255–295.
Love, P. E. D., Irani, Z., Ghoneim, A. and Themistocleous, M. (2006). An exploratory study of indirect ICT costs using the structured case method. International Journal of Information Management, 26: 167–177.
March, J. G. (1988). Variable risk preferences and adaptive aspirations. Journal of Economic Behavior and Organization, 9: 5–24.
March, J. G. and Shapira, Z. (1987). Managerial perspectives on risk and risk taking. Management Science, 33, 11: 1404–1418.
Massini, S., Lewin, A. Y. and Greve, H. R. (2005). Innovators and imitators: Organizational reference groups and adoption of organizational routines. Research Policy, 34: 1550–1569. McCarthy, I. P., Lawrence, T. B., Wixted, B. and Gordon, B. R. (2010). A multidimensional conceptualization of environmental velocity. Academy of Management Review, 35: 604–626. Mckinley, W. (2011). Organizational contexts for environmental construction and
objecti¯-cation activity. Journal of Management Studies, 48: 804–828.
Mendelson, H. (2000). Organizational architecture and success in the information technology industry. Management Science, 46: 513–529.
Merriden, T. (2000). A turnaround in progress. Management Review, 89: 24–28.
Meyer, J. and Rowan, B. (1977). Institutionalized organizations: Formal structure as myth and ceremony. American Journal of Sociology, 83: 340–363.
Milgrom, P. and Roberts, J. (1995). Complementarities and ¯t strategy, structure, and orga-nizational change in manufacturing. Journal of Accounting and Economics, 19: 179–208. Nickerson, J. A. and Zenger, T. R. (2002). Being e±ciently ¯ckle: A dynamic theory of
organizational choice. Organization Science, 13: 547–566.
Pavitt, K. (1984). Sectoral patterns of technical change: Towards a taxonomy and a theory. Research Policy, 13: 343–373.
Podsako®, P. M. and Organ, D. W. (1986). Self-reports in organizational research: Problems and prospects. Journal of Management, 12: 531–544.
Rippin, A. (2005). Marks and Spencer!!! Waiting for the warrior: A case examination of the gendered nature of change management. Journal of Organizational Change Management, 18: 578–593.
Sanchez, R. and Mahoney, J. (2003). Modularity, °exibility, and knowledge management in product and organization design. Managing in the Modular Age: Architectures, Networks, and Organizations, eds. Garud, R., Kumaraswamy, A. and Langlois, R. Blackwell, Man-den, MA.
Santa, R., Ferrer, M., Bretherton, P. and Hyland, P. (2009). The necessary alignment between technology innovation e®ectiveness and operational e®ectiveness. Journal of Management and Organization, 15: 155–169.
Schneider, S. L. (1992). Framing and con°ict: Aspiration level contingency, the status quo, and current theories of risky choice. Journal of Experimental Psychology: Learning, Memory, and Cognition, 18: 1040–1057.
Int. J. Innovation Technol. Management 2016.13. Downloaded from www.worldscientific.com
Siggelkow, N. (2001). Change in the presence of ¯t: The rise, the fall, and the renaissance of Liz Claiborne. The Academy of Management Journal, 44: 838–857.
Siggelkow, N. (2002). Evolution toward ¯t. Administrative Science Quarterly, 47: 125–159. Simon, H. A. (1947). Administrative Behavior: A Study of Decision-Making Process in
Ad-ministrative Organization. Macmillan, Chicago.
Simon, H. (1955). A behavioral model of rational choice. Quarterly Journal of Economics, 691: 99–118.
Simon, H. (1969). The Sciences of the Arti¯cial. MIT Press, Cambridge, MA.
Singh, J. (1986). Performance, slack, and risk taking in organizational decision making. Academy of Management Journal, 29: 562–585.
Snow, C. C., Miles, R. E. and Miles, G. (2005). A con¯gurational approach to the integration of strategy and organization research. Strategic Organization, 3: 431–439.
Soda, G. and Zaheer, A. (2012). A network perspective on organizational architecture: Performance e®ects of the interplay of formal and informal organization. Strategic Man-agement Journal, 33: 751–771.
Stinchcombe, A. L. (1965). Social structure and organizations. Handbook of Organizations, ed. March, J. Rand McNally and Company, Chicago, IL, pp. 142–193.
Stoeberl, P. A., Parker, G. E. and Joo, S.-J. (1998). Relationship between organizational change and failure in the wine industry: An event history analysis. Journal of Management Studies, 35: 537–555.
Sutherland, F. and Smith, A. C. T. (2011). Duality theory and the management of the change, stability paradox. Journal of Management and Organization, 17: 534–547.
Thaler, R. H. and Johnson, E. J. (1990). Gambling with house money and trying to break even: The e®ects of prior outcomes on risky choice. Management Science, 36: 643–660. Train, K. (2003). Discrete Choice Methods with Simulation. Cambridge University Press,
Cambridge.
Tripsas, M. and Gavetti, G. (2000). Capabilities, cognition and inertia: Evidence from digital imaging. Strategic Management Journal, 21, 10/11: 1147–1161.
Tsoukas, H. and Chia, R. (2002). On organizational becoming: Rethinking organizational change. Organization Science, 13: 567–582.
Tushman, M. and Romanelli, E. (1985). Organizational evolution: A metamorphosis model of convergence and evolution. Research in Organizational Behavior, ed. Staw, B. JAI Press, Greenwich, CT.
Venkatraman, N. (1989). The concept of ¯t in strategy research: Toward verbal and statistical correspondence. Academy of Management Review, 14: 432–444.
Vissa, B., Greve, H. R. and Chen, W.-R. (2010). Business group a±liation and ¯rm search behavior in India: Responsiveness and focus of attention. Organization Science, 21: 696–712.
Washburn, M. and Bromiley, P. (2012). Comparing aspiration models: The role of selective attention. Journal of Management Studies, 49: 896–917.
Wiklund, J. and Shepherd, D. (2003). Aspiring for, and achieving growth: The moderating role of resources and opportunities. Journal of Management Studies, 40: 1919–1941. Winkelmann, R. and Boes, S. (2006). Analysis of Microdata. Springer, Berlin.
Wood, J. V. (1989). Theory and research concerning social comparisons of personal attributes. Psychological Bulletin, 106: 231–248.
Yasai-Ardekani, M. (1989). E®ects of environmental scarcity and muni¯cence on the relation-ship of context to organizational structure. Academy of Management Journal, 32: 131–156. Yeh, Q.-J. and Fang, P. (2011). A resource-based analysis of organizational turnaround: The contingency role of organizational life stages. Journal of Management and Organi-zation, 17: 782–796.
Zajac, E. J., Kraatz, M. S. and Bresser, R. K. F. (2000). Modeling the dynamics of strategic ¯t: A normative approach to strategic change. Strategic Management Journal, 21: 429–453.
Int. J. Innovation Technol. Management 2016.13. Downloaded from www.worldscientific.com
Zott, C. and Amit, R. (2008). The ¯t between product market strategy and business model: Implications for ¯rm performance. Strategic Management Journal, 29: 1–26.
Biography
Federica Ceci is Assistant Professor at the University G.d'Annunzio. Her research interests focus on: theory of the ¯rm, analysis of managerial implications of inte-grated solutions on ¯rm's boundaries and capabilities, management of innovation. She has published in Research Policy, Industrial and Corporate Change, Journal of International Management, Industry and Innovation. She has published a book with the Edward Elgar Publishing: The Business of Solutions (July, 2009).
Francesca Masciarelli is an Assistant Professor at the University G.d'Annunzio. She received her doctorate from the University of Trento. Her research interests include social capital, strategy and management of innovation and international business, with particular emphasis on the implications of social capital on ¯rms' competitiveness.
Andrea Prencipe (Ph.D., SPRU, University of Sussex) is a Full Professor of Or-ganization and Innovation at LUISS Guido Carli University (I) and a Visiting Professor at Rotterdam School of Management (NL). Andrea's research interests revolve around the organization of innovation; project-based organizations; and the relationships between regional social capital and ¯rms' innovation performance. He has published articles on these subjects in management and organization journals!!! e.g. Administrative Science Quarterly and Organization Science !!! and in major innovation journals!!! e.g. Research Policy, Industrial and Corporate Change.
Int. J. Innovation Technol. Management 2016.13. Downloaded from www.worldscientific.com