Reduction of free radicals in multiple sclerosis:
effect of glatiramer acetate (Copaxone
®
)
C Iarlori
1, D Gambi
1,2, A Lugaresi
1, A Patruno
3, M Felaco
4, M Salvatore
5, L Speranza
4and
M Reale
6Free radicals have been found in high concentrations within inflammatory multiple sclerosis (MS) lesions. The superoxide anion (O2–) reacts rapidly with nitric oxide (NO), producing peroxynitrite (ONOO–). Glatiramer acetate (GA) is a specific MS immunomodulator that induces the synthesis of Th2 cytokines, and reduces the frequency of relapses and the formation of active brain lesions. Proin-flammatory cytokines could play a role in free radicals production in the peripheral immune system as well as in the central nervous system (CNS). The effect of GA on iNOS, superoxide radicals (O2–) and 3-nitrotyrosine production by peripheral blood adherent mononuclear cells (PBAMs) was assessed. Our findings demonstrate that in vitro GA reduced spontaneous and LPS-induced iNOS, 3-nitrotyrosine, NO and O2–production, and that similar inhibition can be demonstrated ex vivo in mononuclear cells obtained from GA-treated patients. The inhibition of the production of free radicals in PBAMs may represent a new therapeutic mechanism against inflammation during MS. Multiple Sclerosis 2008; xxx: 1–10.http://msj.sagepub.com
Key words: ELISA; glatiramer acetate; inducible nitric oxide synthase; nitric oxide; peripheral blood adherent mononuclear cells; peroxynitrite; relapsing–remitting multiple sclerosis; superoxide anion; western blot
Introduction
Reactive nitrogen species can be generated by biochemical reactions of nitric oxide (NO) or by enzymatic catalysis of NO metabolism. The produc-tion of peroxynitrite (ONOO–) represents a reaction between reactive nitrogen and reactive oxygen spe-cies (ROS) and its presence is an indirect measure of the production of both NO and O2–. In mammalian tissues there are three distinct isoforms of nitric oxide synthase (NOS): the neuronal form (nNOS); the inducible nitric oxide synthase (iNOS) form, present in various cell types upon inflammatory stimulation (e.g. macrophages); and the constitutive enzyme form primarily discovered in the endothe-lium (eNOS). All three isoforms have a similar molec-ular structure and require multiple cofactors [1].
The expression of iNOS and NO production in various cell types is activated by a combination of proinflammatory signals such as ligands that acti-vate toll-like receptors and/or cytokines such as IL-1, tumor necrosis factor-α (TNF-α), and interferon-γ (IFN-γ). In macrophages, monocytes, and other cells, both the induction of iNOS and the presence of L-arginine are sufficient to initiate the generation of NO [2]. The toxicity of NO is also greatly enhanced when it combines with O2– to generate ONOO–, an oxidant capable of damaging lipids, proteins, and DNA.
The etiology of multiple sclerosis (MS) has not yet been fully elucidated, but it is believed that immunological mechanisms are the most impor-tant in disease initiation and progression [3]. The inflammatory environment in demyelinating lesions may lead to the generation of oxygen and
1Unit of Clinical Neurology, Department of Oncology and Neuroscience, University‘G. D’Annunzio’, Chieti, Italy 2Centre of Excellence on Aging, Chieti, Italy
3Department of Drug Sciences, University‘G. D’Annunzio’, Chieti, Italy 4Department of Human Dynamics, University‘G. D’Annunzio’, Chieti, Italy 5FAO, Roma, Italy
6Unit of Immunology, Department of Oncology and Neuroscience, University‘G. D’Annunzio’, Chieti, Italy
Correspondence to: Marcella Reale, Department of Oncology and Neuroscience, University ‘G.D’Annunzio’, Via dei Vestini, 66100 Chieti, Italy. Email: mreale@unich.it
nitrogen free radicals as well as proinflammatory cytokines. iNOS is up-regulated in the central ner-vous system (CNS) during MS and its rodent model experimental autoimmune encephalomyelitis (EAE) [4–6]. Recent clinical and animal studies indicate that NO and ONOO–contribute to the pathogenesis of MS, and it is a matter of debate whether NO play a pathogenic or protective role in EAE and MS [7]. Tissue obtained post mortem from the CNS of MS patients demonstrated the presence of iNOS mRNA and nitrotyrosine. In cerebrospinal fluid (CSF) and plasma nitrite and nitrate levels are elevated in patients with MS [8,9]. Evidence suggests that NO contributes to tissue injury, blood–brain barrier (BBB) breakdown, axonal degeneration, and plaque formation [10–13]. On the other hand, NO may help to control the immune response via several immunoregulatory processes.
Glatiramer acetate (GA; Copaxone®), a synthetic random polymer of the amino acids L-alanine (A), L-glutamate (E), L-lysine (K), and L-tyrosine (Y), and an average length of 40–100 amino acids, is an approved agent for the immunomodulatory treat-ment of MS. When injected subcutaneously each day, GA reduces the frequency of relapses and the formation of active brain lesions [14–16]. Biochem-ical studies revealed that GA binds directly and with high affinity to purified HLA-DR1, HLA-DR2, and HLA-DR4 [17], suggesting that GA contains multi-ple epitopes enabling it to bind promiscuously to MHC class II molecules, where it could potentially be recognized by CD4 T cells. GA inhibits monocyte reactivity in vitro and in vivo [18] and is a potent inducer of Th2/3 cells that secrete high levels of anti-inflammatory cytokines, cross the BBB, accu-mulate in the CNS [19], and express in situ IL-10, TGF-β, and BDNF [20]. Therefore, to elucidate fur-ther the fur-therapeutic effect of GA in MS, we have analyzed peripheral blood adherent mononuclear cells (PBAMs) from patients with RR-MS for evi-dence of iNOS, NO, O2–, and ONOO–levels.
In the current combined in vitro and in vivo study, we confirm that iNOS and both NO and O2– levels and the derived ONOO - play a role in the pathogenesis of MS. The most striking observa-tion in these investigaobserva-tions was the ability of GA to inhibit the free radicals in non-GA-primed PBAM populations. Our data suggest that GA may be use-ful in a variety of disorders in which immune reduc-tion of NO-mediated damage is desirable.
Materials and methods
Cells sources and cultures
Venipuncture was performed in the morning between 08:00 and 10:00. Peripheral blood samples
were collected into 4 ml endotoxin-free EDTA tubes (Vacutainer, Becton Dickinson, NJ, USA). Tubes were kept at room temperature and transported to the laboratory for processing within 1 h of collec-tion. PBAMs were isolated by Ficoll-Hypaque den-sity gradient centrifugation. Isolation and purifica-tion of PBAMs were carried out taking advantage of their adherence to culture plates. After 1 h at 37°C, non-adherent cells were removed with the superna-tant followed by three washes with phosphate buffer solution (PBS). Adherent cells (approximately more than 90% of the cells were CD14+), were then carefully detached from the surface of the culture plates and resuspended in RPMI 1640 medium sup-plemented with 10% fetal calf serum, 4 mM L-glutamine, 25 mM Hepes buffer, 50 U/ml penicil-lin, and 50 mg/ml streptomycin (all media and components were purchased from SIGMA, Italy). Cells (106/ml) were immediately plated and incu-bated at 37°C in a 95% humidified 5% CO2cell cul-ture incubator, with and without a mitogenic stim-ulation with 10 μg/ml of bacterial LPS (Sigma). At the end of incubation culture supernatants were removed, and wells were washed twice with HBSS to remove non-adherent cells. Adherent cells were detached and counted with a hemocytometer. Sim-ilar results were obtained in triplicate assay from each subject among the different groups. Cell via-bility in each culture was assessed by Trypan blue die exclusion.
GA (Copaxone®) obtained from Teva-Sanofi-Aventis Italy, and all compounds used in this study were dissolved in culture medium and added to cell cultures. An equal volume of media was added to controls to make normalized volumes. All reagents used were tested before use for endotoxin (<10 pg/ml; Associates of Cape Cod, Inc., Woods Hole, MA, USA) and mycoplasma contamination (General-probe II; General-probe Inc., San Diego, CA, USA) and found negative. The same batch of serum and medium were used in all experiments.
Detection of iNOS and 3-nitrotyrosine
Determination of iNOS protein and 3-nitrotyrosine (a stable end product of the ONOO-decomposition) was performed in protein extracts by western blot-ting (WB). Equal amounts of protein (50 μg), extracted from human peripheral adherent mono-nuclear cells and quantified by spectrophotometric assay (HP 8452A, CA, USA) using the Lowry method, were separated by electrophoresis in a 7.5% sodium dodecyl sulfate-polyacrylamide gel (SDS-PAGE, BIO-RAD, Hercules, CA, USA) and transferred to nitrocellulose membranes (BIORAD, Hercules, CA, USA) at 4°C in glycine-methanol buffer. Nitrocellulose was then blocked in
Tris-buffered saline [TBS]-milk (10% w/v) and incubated overnight, with a monoclonal anti-NOS2 antibody (Transduction laboratories, USA) at a dilution of 1/2.500 and monoclonal 3-nitrotyrosine anti-body (Alexis Biochemicals) at a dilution of 1/5.000. Nitrocellulose sheets were then washed in TBS, incubated for 1 h with a secondary antibody conjugated with alkaline phosphatase, washed again, and developed in an alkaline buffer with nitroblue-tetrazolium (NBT) as substrate (Alkaline Phosphatase Conjugate Substrate Kit, BIO-RAD, Hercules, CA, USA). β−actin (Sigma, 1/10 000) was used as an internal standard. The resulting blot image files were imported and analyzed with a com-mercially available gel analysis software package (Gel Doc 1000 Bio-Rad Milan, Italy). Data are expressed as mean IOD ± SD.
Determination of O2–
Production of O2–was determined spectrophotomet-rically (Hewlett Packard 8452 A) by monitoring the reduction of ferricytochrome c (Type VI, Sigma) at 550 nm, as described by Pritchard [21]. Briefly, Ferri-cytochrome c (final concentration, 50 μmol/l) was added directly to the cuvette containing the cells and Dulbecco’s phosphate buffered saline (DPBS) (final volume 1 ml), either in the presence or absence of superoxide dismutase [(SOD), 350 U/ml], and sub-sequent changes in absorbance were followed for 10 min. Rates of O2–production were calculated on the basis of the molar extinction coefficient of reduced ferricytochrome c [ε = 21 000 cm–1 (mol/l)– 1]. Cell counts were used to calculate results as nano-moles O2–per 106cells per minute.
Measurement of nitrite levels
The transient and volatile nature of NO makes it unsuitable for most convenient detection methods; two stable breakdown products, nitrate (NO3) and nitrite (NO2) can be easily detected by photometric means. The presence of NO in plasma and in cells culture supernatants (cells were cultured in nitrite-free medium) was evaluated by measuring the amount of nitrite by a colorimetric assay based on Griess reactions, using a commercial kit (Assay Designs, USA).
Briefly, 5 μl of nitrate reductase enzyme solution, 10μl of 2 mM NADPH and 100 μl of Griess Reagent (sulphanilamide and naphthalene–ethylene diamine dihydrochloride), were added to 100 μl of superna-tant, after the supernatant had been kept at room temperature for 1 h to convert nitrate to nitrite. Absorbance of the wells was measured at 540 nm in an ELISA reader (Bio Rad 680) and amounts of nitrite were estimated by a standard curve. The intra- and inter-assay reproducibilities were over 90. Duplicate values that differed from the mean by greater than 10% were not considered for further analysis.
Subjects
Twenty-one RR-MS consecutive patients visiting the Department of Neurology of the University of Chieti, Italy were selected. Inclusion criteria were: clinically definite MS [22,23], relapsing–remitting (RR) course [24], and a Kurtzke’s Expanded Disabil-ity Status Scale (EDSS) score of 5.5 or less [25]. All participants were relapse free and had not used ster-oids for at least 30 days before screening or before randomization. The use of immunosuppressive drugs in the 12 months before study entry, or the use of interferons, intravenous immunoglobulins, more than 30 consecutive days of chronic steroid treatment, or participation in clinical studies of experimental drugs in the 6 months before study entry were not allowed. Twenty healthy donors (healthy controls (HC)) from the Transfusion Blood Bank Services of Chieti, Italy, matched for age, were enrolled. All subjects gave informed con-sent. None of the participants were smokers or vege-tarians, none were known to be taking vitamin B12 or folates (including multivitamins supplements) or prescribed drugs known to affect circulating homo-cysteine or NO concentrations, and none had been previously treated with immunosuppressive drugs. Signs of malnutrition were excluded on the basis of physical examination.
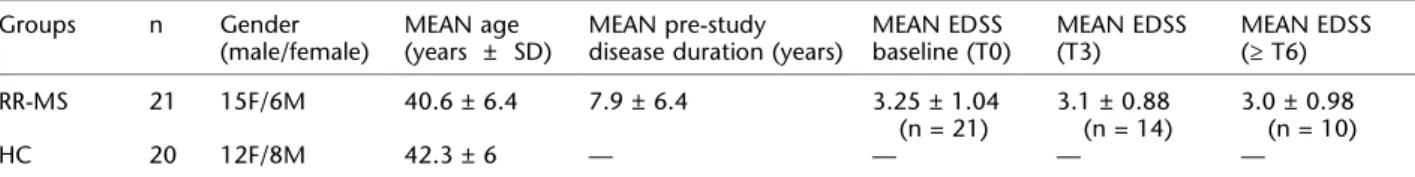
Fourteen patients were studied after 3 months of GA therapy (20 mg subcutaneously daily) and for 10 of them we performed additional experiments after at last 6 months of treatment. Patients charac-teristic and clinic disability measures are summa-rized in Table 1.
Table 1 Patients characteristic and clinic disability measures Groups n Gender
(male/female)
MEAN age (years ± SD)
MEAN pre-study disease duration (years)
MEAN EDSS baseline (T0) MEAN EDSS (T3) MEAN EDSS (≥ T6) RR-MS 21 15F/6M 40.6 ± 6.4 7.9 ± 6.4 3.25 ± 1.04 (n = 21) 3.1 ± 0.88 (n = 14) 3.0 ± 0.98 (n = 10) HC 20 12F/8M 42.3 ± 6 — — — —
Statistics
To compare the level of iNOS between HC and RR-MS patients, unpaired Student’s t-tests have been conducted in basal and LPS-stimulated condi-tions. In both cases the tests were statistically signif-icant (p-values p < 0.01). The Wilcoxon’s signed-rank tests were performed using statistiXL for test-ing pairs of data of RR-MS patients before and after short- (3 months) and long-term (≥ 6 months) GA treatment.
Results
NO, iNOS, 3-nitrotyrosine and O2–production We compare the NO, iNOS, 3-nitrotyrosine, and O2 -production in RR-MS patients and healthy controls.
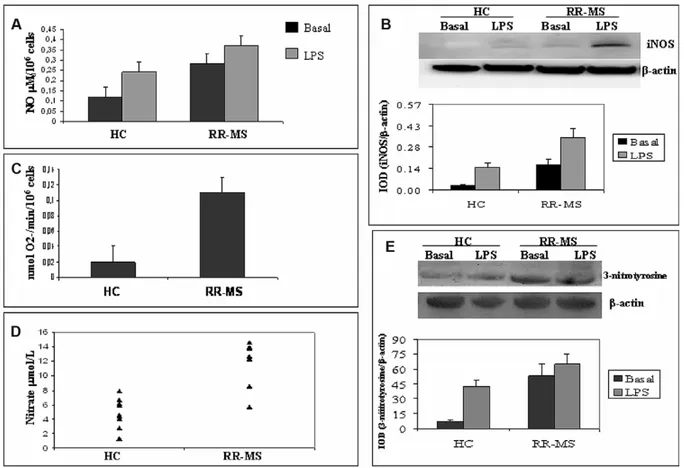
Figure 1(A) shows the levels of NO in the superna-tants of PBAMs from 20 HC and 21 RR-MS patients. Basal and LPS-induced production of NO is higher in RR-MS than in HC (p < 0.001). To verify whether the detected NO derived from iNOS, the WB analy-sis of iNOS expression was performed. Our data show that the level of iNOS was significantly higher in RR-MS than in HC, reflecting the higher produc-tion of NO. The densitometric analysis showed increased levels in basal (0.16 ± 0.002 versus 0.25 ± 0.03, p < 0.001) and in LPS-stimulated PBAMs from RR-MS (0.37 ± 0.03 versus 0.28 ± 0.031, p < 0.001; see Figure 1(B)). Increased iNOS expression in RR-MS may strongly support increased plasma NO levels detected in RR-MS patients with respect to the plasma levels detected in normal subjects (Fig-ure 1(E)).
Basal superoxide released O2–levels from PBAMs obtained from 21 untreated RR-MS patients were
Figure 1 (A) NO release by basal and LPS-stimulated PBAMs from 20 HC and 21 RR-MS patients. All samples were analyzed in duplicate at the same time. (B) Shows analysis of iNOS protein in PBAMs of RR-MS patients and matched controls. An example of bands is shown as a representative experiment. Immunoreactive bands were analyzed by densitometry and nor-malized toβ-actin levels. Each bar represents the mean of relative expression of iNOS by PBAMs from HC and RR-MS. Differ-ences between groups were statistically significant. (C) Spectrophotometrically analysis of O2-production in HC and RR-MS.
Cell counts were used to calculate results as nanomoles of O2–per 106cells per minute. (D) Plasma levels of NO, express as
μmol/l, in control and patient groups. NO was significantly increased in RR-MS patients as compared to controls. All assays were performed in duplicate. (E) WB and densitometric analysis were performed in order to derive levels of basal or LPS-induced 3-nitrotyrosine. An example of bands is shown as a representative experiment. Each bar represents the mean of per-centage of relative expression of 3-nitrotyrosine by PBAMs from HC (n = 20) and from RR-MS (n = 21).
higher than PBAMs from 20 HC (p < 0.001; see Fig-ure 1(C)), suggesting that NO production has a direct bearing on superoxide release. ONOO– forma-tion evaluated as 3-nitrotyrosine, the stable end product of the ONOO– decomposition, was signifi-cantly higher in RR-MS patients than in HC subjects (Figure 1(D)), reflecting the higher production of both ONOO– and NO observed in RR-MS patients. The excessive diffuse immunological over activa-tion may be responsible for less significant induc-tion by LPS in PBAMs from RR-MS.
Effects of GA on NO, iNOS, 3-nitrotyrosine and O2–production
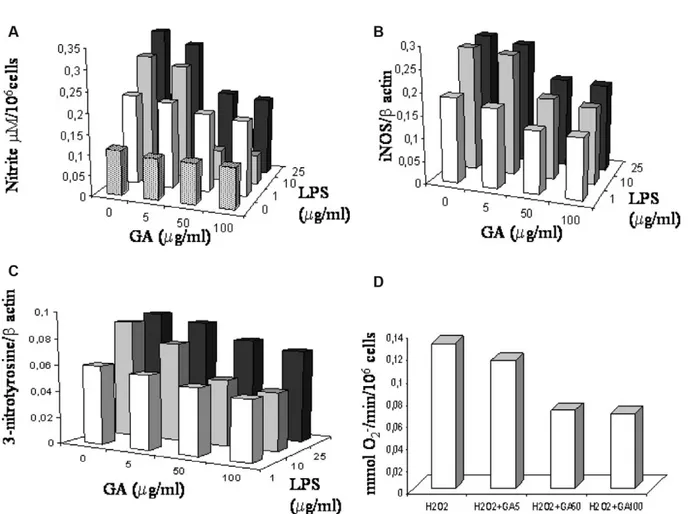
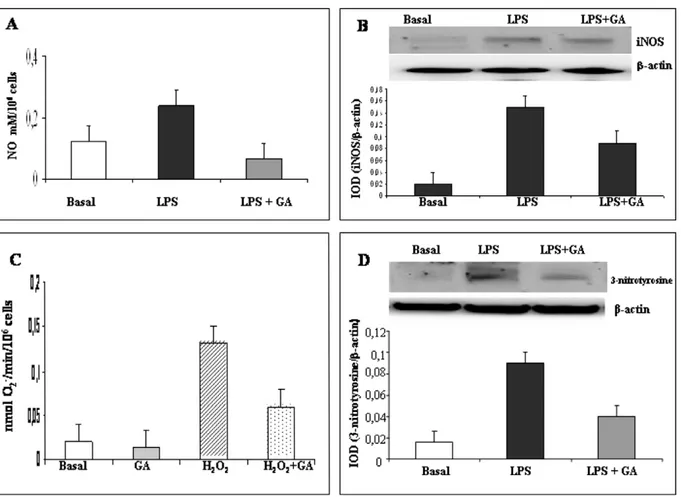
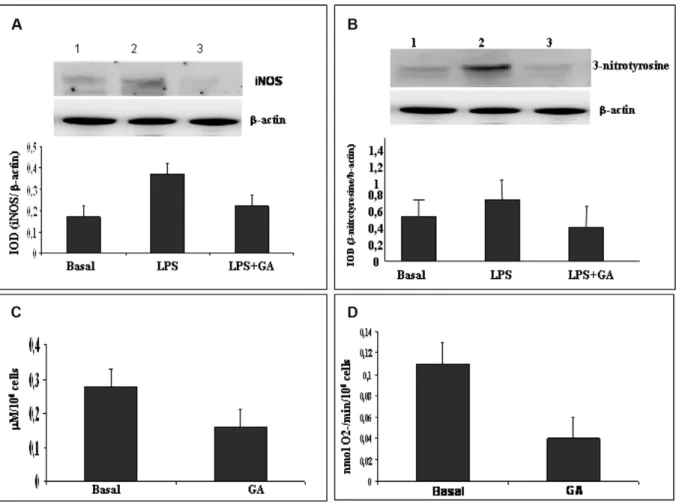
During preliminary experiments, cells were incu-bated at 37°C, 5% CO2, overnight with LPS (range 1–25 μg/ml) and GA in the concentration range 5–100 μM/ml (Figure 2). No inhibitory effects of each GA concentration were observed in spontane-ous production of nitrite, iNOS, 3-nitrotyrosine, and O2–, in all experiments performed. Our data are in agreement with reports showing that the good iNOS production was obtained in monocytes incubated with LPS concentration from 1 to 25μg/ ml for 8 to 48 h (see [29,30]). To assess the nitrite-blocking effect of GA, we monitored nitrite levels in culture media after stimulating cells with LPS (10 μg/ml) in the presence or absence of GA. LPS stimu-lation caused a significant accumustimu-lation of NO in culture media (2-fold) reduced by GA and the more significantly reduction was observed with GA at 50 μg/ml (3.3-fold); see Figure 3(A). We then examined whether the inhibition of NO production by GA was accompanied by a parallel change in the levels of iNOS protein expression. As expected, addition of GA (50 μg/ml) reduced iNOS protein expression (Figure 3(B)). Spontaneous O2– produc-tion by PBAMs was not significantly reduced by GA addition. To increase O2– production, the PBAMs were pre-treated with a sub-maximal con-centration of H2O2(20μM) for 2 h and then main-tained for an additional 16 h in the presence of GA (50 μg/ml). O2– generation by PBAMs significantly decreased after addition of GA (p < 0.01), as show in Figure 3(C). No influence by H2O2 on cell viability was observed. More than 98% cells were viable, as determined by trypan blue dye exclusion at the beginning of the culture, and more than 90% were viable at the end of the culture. 3-Nitrotyrosine, was significantly reduced after exposure of PBAMs to GA (50%, p < 0.01, mean of five donors; see Figure 3 (D)).
In the next step we tested the down-regulating effect of GA in ex vivo PBAMs isolated from RR-MS patients. Of special significance is the restoration of iNOS and 3-nitrotyrosine to a basal level by GA
treatment. iNOS production was significantly reduced in LPS-induced PBAMs (46%; Figure 4(A)) such as NO (42.8% reduction; Figure 4(C)), 3-nitrotyrosine (46,9% reduction; Figure 4(B)), and O2-production (36.4% reduction; Figure 4(D)).
NO, iNOS, 3-nitrotyrosine and O2–levels in MS patients treated with GA
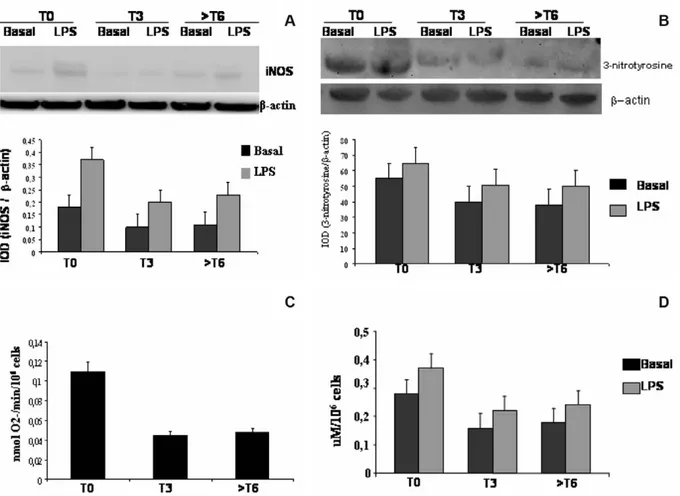
After 3 months of GA therapy, there was a signifi-cant decrease of plasma NO levels in RR-MS patients, after 6 months or more of GA therapy the plasma NO levels remained low and the stability of the response to GA was confirmed in all patients (Fig-ure 5). In order to test whether the down-regulation of circulating levels of NO was accompanied by changes in NO secretion by PBAMs, we measured the levels of NO in PBAMs from 14 GA-treated RR-MS patients after 3 months or more than 6 months of treatment. In MS patients we detected reduced NO production after 3 months or more than 6 months of treatment (Figure 6(D)). Reduction of iNOS protein expression by GA was confirmed in RR-MS patients treated for 3 months or more than 6 months with GA. The densitometric analysis shows basal and LPS-induced iNOS production reduction after 3 months of GA therapy (basal T0 = 0.25 ± 0.04 versus basal T3 = 0.15 ± 0.006, p <0.001; LPS-induced T0 = 0.37 ± 0.03 versus LPS-LPS-induced T3 = 0.29 ± 0.007, p <0.001). To assess whether the reduc-tion of iNOS protein producreduc-tion was related to the duration of GA treatment, we examined iNOS pro-tein levels in patients that proceeded with GA treat-ment for at least 6 months. The reduction iNOS pro-duction by GA observed at 3 months was confirmed after 6 months, suggesting that the main effect of proceeding with the treatment is to stabilize the reduction in both basal and LPS-induced iNOS expression (basal T3 = 0.148 ± 0.008 versus basal T≥6 = 0.146 ± 0.007; LPS-induced T3 = 0.286 ± 0.01 versus LPS-induced T≥6 = 0.282 ± 0.009; see Figure 6 (A)). O2– formation was significantly reduced in PBAMs from RR-MS patients in the first 3 months of GA treatment (T0 = 0.11 ± 0.042 versus T3 = 0.04 ± 0.003). After another 6 months or more of treatment, the extracellular O2–value tends to stabi-lize (T≥6 = 0.05 ± 0.004; T≥6 versus T0, p < 0.001; T≥6 versus T3, p < 0.05; Figure 6(C)). Reduction of NO and O2– resulted in significant inhibition of ONOO- formation. In fact, in RR-MS patients after 3 months of GA treatment, basal and LPS-induced 3-nitrotyrosine levels are significantly decreased (basal condition = 27% of decrease, LPS stimula-tion = 15% of decrease), and similar results were observed in more long-term therapy (T≥6); see Fig-ure 6(B).
Discussion
Deregulation or overproduction of NO has been implicated in the pathogenesis of many disorders, including atherosclerosis, neurodegenerative dis-eases, and inflammatory autoimmune diseases. The role of oxidative stress in demyelinating condi-tion such as those observed in MS is substantiated by pathological findings and animal models that have provided experimental paradigms to delineate the possible mechanisms. Recent observation showed that in experimentally produced autoim-mune disease, EAE microglial cells destroy oligoden-drocytes in an NO-dependent fashion. Localization of reactive nitrogen species in MS lesions and ame-lioration of EAE by administration of NOS inhibi-tors [26,27] prompted us to examine if the reported increase of iNOS in the CNS during MS occurred
also in PBAMs of MS patients. We performed a study aimed at evaluating the ex-vivo oxidative stress using PBAMs as a non-neural cell model able to produce proinflammatory cytokines and free radicals. We demonstrated that in RR-MS patients the expression of iNOS and 3-nitrotyrosine NO and O2–was elevated in comparison to HC, corrob-orating other studies that found increased levels of iNOS during the acute phase of EAE and MS [5,28]. Our data concur with those of Giovannoni, et al. [9], who found significantly higher serum levels of NOx and with those of Sarchielli, et al. [29], who detected the increased production of NO by PBMC of MS patients and considered NO a marker of mononuclear activation in the peripheral blood of MS patients and, indirectly, of disease activity.
This study provides new insights into the func-tional interaction between NO and O2–production
Figure 2 (A) Inhibition by GA (5–100 μg/ml) of the nitrite release by LPS-stimulated (1–25 μg/ml) PBAMs. Amount of nitrite in cell-free supernatants was quantified by a colorimetric assay based on the Griess reaction. Results are representative of four independent experiments, each using PBAMs isolated from different healthy donors. Inhibition by GA (5–100 μg/ml) of the (B) iNOS expression and (C) 3-nitrotyrosine by LPS (1–25 μg/ml)-stimulated PBAMs. Results are representative of four inde-pendent experiments each using PBAMs isolated from different healthy donors. Each cell proteins extract was blotted and stained at least twice. (D) Spectrophotometrically analysis of inhibition by GA (5–100 μg/ml) of O2–production in H2O2
-stimulated PBAMs isolated from different healthy donors. Cell counts were used to calculate results as nanomoles of O2–per
and iNOS expression in peripheral mononuclear cells from RR-MS patients. We show that the increase of ONOO- in PBAMs of RR-MS patients is related with increased NO and O2–production and iNOS activation. Greater O2–production is balanced by increased iNOS and NO production resulting in higher ONOO– formation, suggesting that the increased production of free radicals and iNOS acti-vation could be considered a marker of peripheral mononuclear cells activation in RR-MS patients. A decrease of iNOS production may constitute a mechanism to prevent excess of ONOO–formation in a situation of high O2–and NO production.
Several investigators have considered the possibil-ity of interfering with the development and severpossibil-ity of MS by altering NO production. Hence, we tested whether GA, an agent which demonstrates
therapeu-tic efficacy in MS, may affect NO and iNOS levels. Our study shows that therapy with GA induces a down-modulation of iNOS, NO, 3-nitrotyrosine, and O2– in PBAMs from RR-MS patients. The increased NO plasma levels observed in RR-MS patients were reduced after 3 months (T3), and remain constant after 6 months (T6) of GA treat-ment. In GA treated MS patients, we observe the sta-bility of the mean in EDSS. Previous studies have demonstrated that GA-reactive T-cell lines can be generated when PBMCs are isolated from non-GA-primed normal healthy individuals and incu-bated with GA in primary 7- to 14-day primary in vitro cultures. Immune modulation by daily injec-tions of GA in MS treatment has been attributed to the generation of GA-reactive Th2 cells releasing anti-inflammatory cytokines that may induce
Figure 3 (A) In vitro effects of GA on NO production by PBAMs from HC subjects cultured overnight without (basal) or with LPS (10μg/ml) and LPS + GA (50 μg/ml). Data are the mean ±SD of independent experiment performed in 20 HC subjects. (B) Representative blot of serial WB examination for iNOS expression. Integrated optical density (IOD) is reported as mean ± SD of 20 HC. (C) Baseline and H2O2(20μM) stimulated superoxide anion production in PBAMs was measured
spectropho-tometrically as superoxide dismutase inhibitable reduction of ferricytochrome c absorbance. GA (50 μg/ml) significantly reduced H2O2-induced superoxide anion production, and addition of GA led to a decrease in basal NO production which
did not reach statistically significance. Data are the mean ± SD (nanomoles O2–per 106 cells per minute) of six separate
experiments performed in triplicate. SD is lower than 10% of the mean. (D) Samples from HC were subjected to WB and densitometric analysis in order of the effect of GA on LPS-induced 3-nitrotyrosine. An example of bands is shown as a repre-sentative experiment. Each bar represents the mean of percentage of relative expression of 3-nitrotyrosine by PBAMs of HC.
down-regulation of free radicals [31]. Studies exam-ining the effect of cytokines on NOS production have yielded conflicting results. This may be related
to the production of IL-4 and IL-5 by Th2 cells, which can inhibit the iNOS induction by IFN-γ, while it has been demonstrated that both exogenous and endogenous IL-10 up-regulate the production of NO by LPS-activated macrophages. In contrast, Th1 cells characteristically produce IFN-γ, which can strongly activate macrophages to produce NO via iNOS. A regulatory role of NO in Th1/Th2 generation has long been recognized; NO selectively inhibits the expansion of Th1 cells by a negative feedback mech-anism that lead to the increase of Th2 populations [32]. Therefore, regardless of whether free radical inhibition is a target for GA activity in vivo, or whether their decrease results from a bystander effect reflecting GA therapeutic activity, the reduction of free radicals per se could be beneficial in MS and may also represent an obvious therapeutic goal in other diseases caused by Th1/Th2 imbalance. By using in vitro cultured PBAMs obtained from HC
Figure 5 GA therapy: individual patient profiles of NO plasma levels. Each data point represents the NO level from each patient at the time of enrolment (T0) and after 3 months (T3) or 6 months and more of treatment (T≥6). All assays were performed in duplicate. Total NO was express as μmol/l.
Figure 4 PBAMs from RR-MS patient were cultured without (basal) or with LPS (10 μg/ml). (A) The representative WB for iNOS is one of the independent experiments with similar results. Immunoreactive bands were analyzed by densitometry and normalized toβ-actin levels. In densitometric analysis, each bar represents the mean ± SD of relative expression of iNOS by PBAMs. (B) WB and densitometric analysis, in order to derive levels of basal or LPS-induced 3-nitrotyrosine. An example of bands was shown as a representative experiment. Each bar represents the mean of relative expression of 3-nitrotyrosine (I.O.D.). (C) Effect of GA on basal release of NO by PBAMs. All samples were analyzed in duplicate at the same time. (D) O2–
subjects and stimulated with ligand for Toll-like receptor TLR-4 (LPS), we showed that GA (50 μg/ml) had a broad inhibitory effect on iNOS, NO, 3-nitrotyrosine, and O2– production. It is unlikely that this refects a simple toxic effect, because cell viability was unaffected. To obtain fur-ther evidence on the down-regulation of free radi-cals production by GA, we examined PBAMs of RR-MS patients and the comparable down-regulating effect was observed. These findings establish the ability of GA to inhibit the free radicals in non-GA-primed PBAM populations restoring the impaired expression of free radicals induced by the disease process.
We do not know whether these observations made in peripheral mononuclear cells correlate with the situation in the CNS in our MS patients
but we believe that this study may provide a ratio-nale for estimating the peripheral iNOS expression, O2–, NO, and 3-nitrotyrosine production in RR-MS. Taken together, the results of this study support the conclusion that iNOS protein, NO, O2–, and 3-nitrotyrosine are abundantly produced in PBAMs by RR-MS patients and the assessment of their iNOS levels in PBAMs and NO levels in plasma needs to be considered as one part of the more complex pathophysiological process in MS. Furthermore, this has important implications for clinical monitoring and for therapeutic interven-tion in RR-MS.
Studies are in progress, in our laboratory, to strengthen these preliminary observations by study-ing a wider population of patients and with a longer treatment period.
Figure 6 Effect of GA therapy on NO, iNOS, 3-nitrotyrosine, and O2-levels. PBAMs from pre-treated (T0) RR-MS patients
and RR-MS patients treated with GA (20 mg subcutaneously daily) for 3 (T3) and 6 or more (T≥6) months were incubated with or without LPS for 24 h. A representative WB for iNOS of independent experiment involving identical comparisons is shown in (A) and that for 3-nitrotyrosine is shown in (B). (C) Baseline superoxide anion production was measured spectro-photometrically as superoxide dismutase inhibitable reduction of ferricytochrome c absorbance. Superoxide anion production in PBAMs was significantly reduced in RR-MS patients GA-treated for 3 months and 6 or more months. Data are the mean ± SD (nanomoles O2–per 106 cells per minute) of six separate experiments performed in triplicate. SD is lower than 10% of
the mean. (D) Basal and LPS-induced release of NO by PBAMs from untreated (T0) RR-MS patients and RR-MS patients trea-ted for 3 months and 6 or more months with GA. All samples were analyzed in duplicate at the same time.
Acknowledgments
The authors are grateful to Ms Rita Zuccarini for excellent nursing skills and venipuncture, to Profes-sor Paolo Amerio for critical reading of the manu-script, and Renato Barbacane for the preparation of this manuscript. This research was partially sup-ported by grants from the Italian Ministry of Uni-versity and Research (MIUR) and from the Center of Excellence on Aging (CEA).
References
1. Forstermann, U, Kleinert, H. Nitric oxide synthase: expression and expressional control of the three iso-forms. Naunyn Schmiedebergs Arch Pharmacol 1995;352: 351–364.
2. Moncada, SR, Palmer, MJ, Higgs, EA. Nitric oxide: physi-ology, pathology and pharmacology. Pharmacol Rev 1991;43: 109–142.
3. Furlan, R, Rovaris, M, Martinelli Boneschi, F, Khademi, M, Bergami, A, et al. Immunological patterns identifying disease curse and evolution in multiple sclerosis patients. J Neuroimmunol 2005;165: 192–200.
4. Bagasra, O, Michaels, FH, Zheng, YM, Bobroski, LE, Spitsin, SV, Fu, ZF, et al. Activation of the inducible form of nitric oxide synthase in the brains of patients with multiple sclerosis. Proc Natl Acad Sci U S A 1995; 92: 12041–12045.
5. Cross, AH, Manning, PT, Stern, MK, Misko, TP. Evidence for the production of peroxynitrite in inflammatory CNS demyelination. J Neuroimmunol 1997;80: 121–130. 6. Tran, EH, Hardin-Pouzet, H, Varge, G, Owens, T.
Astro-cytes and microglia express inducible nitric oxide synthase in mice with experimental allergic encephalo-myelitis. J Neuroimmunol 1997;74: 1211–1229.
7. Smith, KJ, Lassmann, H. The role of nitric oxide in mul-tiple sclerosis. Lancet Neuro 2002;1: 232–241.
8. Nazliel, B, Taskiran, D, Irkec, C, Kutay, FZ, Pogun, S. Serum nitric oxide metabolites in patients with multiple sclerosis. J Clin Neurosci 2002;9: 530–532.
9. Giovannoni, G, Miller, DH, Losseff, NA, Sailer, M, Lewellyn-Smith, N, Thompson, AJ, et al. Serum inflamma-tory markers and clinical/MRI markers of disease progres-sion in multiple sclerosis. J Neurol 2001;248: 487–497. 10. Carlson, NG, Rose, JW. Antioxidants in multiple
sclero-sis: do they have a role in therapy? CNS Drugs 2006;20: 433–441.
11. De Groot, CJ, Ruuls, SR, Theeuwes, JW, Dijkstra, CD, Van der Valk, P. Immunocytochemical characterization of the expression of inducible and constitutive isoforms of nitric oxide synthase in demyelinating multiple sclerosis lesions. J Neuropathol Exp Neurol 1997;56: 10–20. 12. Hill, KE, Zollinger, LV, Watt, HE, Carlson, NG, Rose, JW.
Inducible nitric oxide synthase in chronic active multi-ple sclerosis plaques: distribution, cellular expression and association with myelin damage. J Neuroimmunol 2004;151: 171–179.
13. Minagar, A, Alexander, JS. Blood-brain barrier disruption in multiple sclerosis. Multi Scler 2003;9: 540–549. 14. Comi, G, Filippi, M, Wolinski, JS. European/Canadian
multicenter, double-blind, randomised, placebo-controlled study of the effects of glatiramer acetate on magnetic resonance imaging-measured disease activity and burden in patients with relapsing multiple sclerosis: European/Canadian Glatiramer Acetate Study Group. Ann Neurol 2001;49: 290–296.
15. Simpson, D, Noble, S, Perry, C. Glatiramer acetate: a review of its use in relapsing-remitting multiple sclerosis. CNS Drugs 2002;16: 825–850.
16. Teitelbaum, D, Fridkis-Hareli, M, Amon, R, Sela, M. Copolymer 1 inhibits chronic relapsing experimental allergic encephalomyelitis induced by proteolipid protein (PLP) peptides in mice and interferes with PLP-specific T cell responses. J Neuroimmunol 1996;64: 209–217. 17. Fridkis-Hareli, M, Strominger, JL. Promiscuous binding of
synthetic copolymer 1 to purified HLA-DR molecules. J Immunol 1998;160: 4386–4397.
18. Weber, M, Starck, M, Wagenpfeil, S, Meinl, E, Hohlfeld, R, Farina, C. Multiple sclerosis: glatiramer acetate inhibits monocyte reactivity in vitro and in vivo. Brain 2004;127: 1370–1378.
19. Prat, A, Biernacki, K, Antel, J. Th1 and Th2 lymphocyte migration across the human BBB is specifically regulated by interferonβ and copolymer-1. J Autoimmunol 2005; 2: 119–124.
20. Aharoni, R, Kayhan, B, Eilam, R, Sela, M, Arnon, R. Glatir-amer acetate-specific T cells in the brain express T helper 2/3 cytokines and brain-derived neurotrophic factor in situ. Proc Natl Acad Sci U S A 2003;100: 14157–14162. 21. Pritchard, KA, Groszek, L, Smalley, DM, Sessa, WC, Wu,
M, Villalon, P, et al. Native low-density lipoprotein increases endothelial cell nitric oxide synthase genera-tion of superoxide anion. Cir Res 1995;77: 510–518. 22. McDonald, WI, Compston, A, Edan, G, Goodkin, D,
Hartung, HP, Lublin, FD, et al. Recommended diagnostic criteria for multiple sclerosis: guidelines from the Inter-national Panel on the Diagnosis of Multiple Sclerosis. Ann Neurol 2001;50: 121–127.
23. Poser, CM, Paty, DW, Scheinberg, L, McDonald, WI, Davis, FA, Ebers, GC, et al. New diagnostic criteria for multiple sclerosis: guidelines for research protocols. Ann Neurol 1983;13: 227–231.
24. Lublin, FD, Reingold, SC. Defining the clinical course of multiple sclerosis: results of an international survey. National Multiple Sclerosis Society (USA) Advisory Com-mittee on Clinical Trials of New Agents in Multiple Scle-rosis. Neurology 1996;46: 907–911.
25. Kurtzke, JF. Rating neurologic impairment in multiple sclerosis: an Expanded Disability Status Scale (EDSS). Neurology 1983;33: 1444–1452.
26. Al-Omaishi, J, Bashir, R, Gendelman, HE. The cellular immunology of multiple sclerosis. J Leukoc Biol 1999; 65: 444–452.
27. Danilov, AI, Andersson, M, Bavand, N, Wiklund, NP, Olsson, T, Brundin, L. Nitric oxide metabolite determina-tions reveal continuous inflammation in multiple sclero-sis. J Neuroimmun 2003;136: 112–118.
28. Liu, JS, Zhao, ML, Brosnan, CF, Lee, SC. Expression of inducible nitric oxide synthase and nitrotyrosine in mul-tiple sclerosis lesions. Am J Pathol 2001;158: 2057–2066. 29. Sarchielli, P, Orlacchio, A, Vicinanza, F, Pelliccioli, G, Tognoloni, M, Saccardi, C, et al. Cytokine secretion and nitric oxide production by mononuclear cells of patients with multiple sclerosis. J Neuroimmun 1997;80: 76–86. 30. Moratalla, N, Gonzales, A, Aymerich, MS,
Lopez-Zabalda, MJ, Pio, R, de Castro, P, et al. Monocyte induc-ible nitric oxide synthase in Multiple Sclerosis. Regula-tory role of nitric oxide. Nitric Oxide: Biol & Chem 1997; 1: 95–104.
31. Duda, PW, Schmied, MC, Cook, SL, Krieger, JI, Hafler, DA. Glatiramer acetate (Copaxone) induces degenerate, Th2-polarized immune responses in patients with multi-ple sclerosis. J Clin Invest 2000;105: 967–976
32. Niedbala, W, Cai, B, Liew, FY. Role of nitric oxide in the regulation of T cells functions. Ann Rheum Dis 2006;65: 37–40.