H E A L T H A N D M E D I C I N E
Pharmacological modulation of mitochondrial calcium
uniporter controls lung inflammation in cystic fibrosis
Alessandro Rimessi1,2*, Chiara Pozzato1, Lorenzo Carparelli1, Alice Rossi3, Serena Ranucci3, Ida De Fino3, Cristina Cigana3, Anna Talarico4, Mariusz R. Wieckowski5, Carla M. P. Ribeiro6, Claudio Trapella4, Giacomo Rossi7, Giulio Cabrini2,8, Alessandra Bragonzi3, Paolo Pinton1,2* Mitochondria physically associate with the endoplasmic reticulum to coordinate interorganelle calcium transfer and regulate fundamental cellular processes, including inflammation. Deregulated endoplasmic reticulum– mitochondria cross-talk can occur in cystic fibrosis, contributing to hyperinflammation and disease progression. We demonstrate that Pseudomonas aeruginosa infection increases endoplasmic reticulum–mitochondria associations in cystic fibrosis bronchial cells by stabilizing VAPB-PTPIP51 (vesicle-associated membrane protein–associated protein B–protein tyrosine phosphatase interacting protein 51) tethers, affecting autophagy. Impaired autophagy induced mitochondrial unfolding protein response and NLRP3 inflammasome activation, contributing to hyper-inflammation. The mechanism by which VAPB-PTPIP51 tethers regulate autophagy in cystic fibrosis involves calcium transfer via mitochondrial calcium uniporter. Mitochondrial calcium uniporter inhibition rectified autophagy and alleviated the inflammatory response in vitro and in vivo, resulting in a valid therapeutic strategy for cystic fibrosis pulmonary disease.
INTRODUCTION
Cystic fibrosis (CF) is a genetic disease caused by mutations of the gene coding for the CF transmembrane conductance regulator (CFTR) protein (1). More than 2000 variants and 300 disease-causing muta-tions have been identified thus far, with the deletion of phenylalanine at position 508 (Phe508del-CFTR) being the most common, affecting approximately 80% of patients with CF in Europe and the United States (2). Because of protein misfolding, Phe508del-CFTR is pre-maturely degraded. In the lungs, the primary organ affected in CF, CFTR gene defects impair chloride transport, reducing water content in the airway surface liquid. This defect increases susceptibility to bacterial infections (such as those by Pseudomonas aeruginosa), re-sulting in hyperinflammation and progressive pulmonary tissue damage, and leading to respiratory insufficiency (3). In addition to the lung tissue damage induced by the chronic inflammatory process itself, P. aeruginosa has been shown to compromise fundamental processes, including the immune response and the expression of rescued Phe508del-CFTR to the apical membrane (4). Thus, the pres-ence of P. aeruginosa infection could exacerbate pulmonary CF pathophysiology and render recent CF therapies less effective. Therefore, alternative approaches aimed to activate early anti- inflammatory pathways to prevent organ damage before patients become symptomatic are needed (5).
Mitochondria have recently gained much attention in the medical field due to their involvement in several inflammatory-associated diseases, including CF. Perturbation of mitochondrial activity is sufficient to activate innate immune responses (6, 7), indicating that cells use mitochondrial stress to potentiate innate immunity programs when specific exogenous or endogenous stress alters mitochondrial homeostasis (8). The maintenance of functional mitochondria in cells, through mitochondrial stress response and quality control pathways, is thus essential to avoid exacerbation of the inflammatory response. A conserved lysosomal degradation pathway, called mitophagy, controls the quality of mitochondria in stressed cells, acting as a mitochondrial stress response together with the mitochondrial un-folded protein response (UPRmt) (8). In relation to CF pathophysiology,
a similar mechanism, called xenophagy, plays a role in sequestering and degrading invading pathogens, while macroautophagy controls CFTR intracellular trafficking and function (9, 10). Several protein
complexes and signaling pathways, including Ca2+ signaling, are
involved in these processes (11–13). However, whether Ca2+ signaling and autophagy are directly related to the CF lung–specific
patho-genic cascade remains unclear. Impaired Ca2+ homeostasis and
au-tophagic defects in CF have been reported, suggesting that both could be directly involved (7, 14–19).
We recently demonstrated that the degree and quality of the inflammatory response in CF bronchial cells are supported by
P. aeruginosa–dependent mitochondrial perturbation, in which the
mitochondrial Ca2+ uniporter (MCU) is involved in NLRP3 (NOD-,
LRR-, and pyrin domain-containing protein 3) inflammasome acti-vation and inflammatory exacerbation in vitro (7). Consequently, mitochondrial Ca2+ signaling represents a potentially useful but
rela-tively unexploited area for therapeutic innovation and intervention. From this viewpoint, the identified MCU is a strong candidate (20).
The activity of MCU induces increases in mitochondrial Ca2+
con-centration with defined timing, amplitude, and kinetics that affect mitochondrial activities, including adenosine triphosphate (ATP) production, inflammation, autophagy, and cell death (21, 22).
How-ever, mitochondrial Ca2+ homeostasis is primarily conditioned by
1Department of Medical Sciences and Laboratory for Technologies of Advanced Therapies (LTTA), University of Ferrara, 44121 Ferrara, Italy. 2Center of research on Innovative Therapies for Cystic Fibrosis, University of Ferrara, 44121 Ferrara, Italy. 3Infections and Cystic Fibrosis Unit, Division of Immunology, Transplantation and Infectious Diseases, IRCCS San Raffaele Scientific Institute, 20132 Milano, Italy. 4Department of Chemistry and Pharmaceutical Sciences and Laboratory for Technolo-gies of Advanced Therapies (LTTA), University of Ferrara, 44121 Ferrara, Italy. 5 Labora-tory of Mitochondrial Biology and Metabolism, Nencki Institute of Experimental Biology, 02-093 Warsaw, Poland. 6Department of Medicine/Pulmonary Division, Marsico Lung Institute and Cystic Fibrosis Center, Chapel Hill, NC 27599-7248, USA. 7School of Biosciences and Veterinary Medicine, University of Camerino, 62024 Macerata, Italy. 8Department of Neurosurgery, Biomedicine and Movement, University of Verona, 37126 Verona, Italy.
*Corresponding author. Email: [email protected] (A.R.); paolo.pinton@ unife.it (P.P.)
Copyright © 2020 The Authors, some rights reserved; exclusive licensee American Association for the Advancement of Science. No claim to original U.S. Government Works. Distributed under a Creative Commons Attribution NonCommercial License 4.0 (CC BY-NC). on May 13, 2020 http://advances.sciencemag.org/ Downloaded from
the close apposition of mitochondria to endoplasmic reticulum (ER) membranes, which regulates cell fate via inositol 1,4,5-trisphosphate
receptors (IP3Rs) through voltage-dependent anionic channels
(VDACs) and MCU (23). Miscommunication between the ER and mitochondria occurs in a number of degenerative- and inflammatory- related diseases (24); however, whether disrupted ER-mitochondria cross-talk is a consequence of the lung pathological conditions in CF remains elusive. ER-mitochondria contacts, also known as mitochondria-associated ER membranes (MAMs), are multiprotein platforms that appear to tether the two organelles regulating funda-mental processes (24). The integral ER protein vesicle- associated membrane protein–associated protein B (VAPB) binds the outer mitochondrial membrane protein tyrosine phosphatase interacting protein 51 (PTPIP51) to form some of these tethers (25). By manipulat-ing the expression of VAPB or PTPIP51, it is possible to modulate
ER-mitochondria contacts, affecting interorganelle Ca2+ exchange
and autophagy (26).
Here, we address the role of the MAM and VAPB-PTPIP51 tether in autophagy during P. aeruginosa infection in CF. We show that
P. aeruginosa infection induces the increase of VAPB and PTPIP51
expression in CF bronchial cells to stabilize ER-mitochondria asso-ciation, thus affecting autophagy. We demonstrate that defects in CFTR channels lead to reduced selective autophagic clearance capacity during P. aeruginosa infection with consequence on mitochondria
physiology, inducing persistent UPRmt and NLRP3 inflammasome
activation and further down-regulation of the autophagic response and worsening of the inflammatory response in CF bronchial cells. We also show that the mechanism by which VAPB-PTPIP51 tethers regulate autophagy in CF cells involves their key role in mediating
interorganelle Ca2+ transfer from the ER to mitochondria via MCU.
This led us to hypothesize that KB-R7943, an inhibitor of MCU, could be beneficial for alleviating the P. aeruginosa–dependent inflammatory response in CF in vitro and in vivo. We show that KB-R7943 is endowed with a unique property, namely, the dual ability to control inflammation and rectify the autophagy response in CF.
RESULTS
The increase of VAPB and PTPIP51 expression impairs autophagy in CF bronchial cells during P. aeruginosa infection
To gain insight into the role of ER-mitochondria associations in CF during pathogen infection, we first monitored whether infection with P. aeruginosa affected the interaction of key ER-mitochondria Ca2+ exchange proteins, such as IP
3R3 and VDAC, using a proximity
ligation assay (PLA). Different human non-CF (S9 and NuLi) and CF (IB3-1 and CuFi) bronchial cell models, grown as monolayer on plastic supports, were exposed to P. aeruginosa laboratory strain (PAO1) or supernatant from mucopurulent material (SMM) from airways of patients with CF. No changes in IP3R3-VDAC interactions
were quantified in non-CF bronchial cells challenged with P. aeruginosa or SMM (Fig. 1A and fig. S1A). In contrast, in CF bronchial cells, challenge with P. aeruginosa or SMM increased the interactions
be-tween IP3R3 and VDAC (Fig. 1A and fig. S1A). To test whether the
increase in ER-mitochondria contacts was due to altered expression of ER-mitochondria tethers, we probed immunoblots of non-CF and CF bronchial cells exposed for different hours to P. aeruginosa.
No change in the expression of IP3R3 and VDAC in both cell lines
was detected (fig. S1B), whereas the expression of ER-mitochondria tethers, VAPB and PTPIP51, was increased in CF bronchial cells during pathogen exposure, suggesting that their increase could justify
the augmented interaction of IP3R3 and VDAC (Fig. 1B and fig. S1,
C and D). Similar effect on ER-mitochondria tethers has been observed also in polarized mucociliary-differentiated CF patient– derived airway epithelial cells reconstituted on Transwell air-liquid interface (fig. S1E). CF primary airway cells showed enhanced VAPB and PTPIP51 expression compared to wild-type (WT) CFTR-expressing human primary cells when exposed to P. aeruginosa, which suggests that defective CFTR channel favors ER-mitochondria interaction during pathogen infection. A major ER-mitochondria interaction in CF bronchial cells when exposed to P. aeruginosa or SMM is also confirmed by the enhanced percentage of VAPB- PTPIP51 colocalization (fig. S2A).
By manipulating the expression of VAPB or PTPIP51, it is possible
to modulate ER-mitochondria contacts affecting interorganelle Ca2+
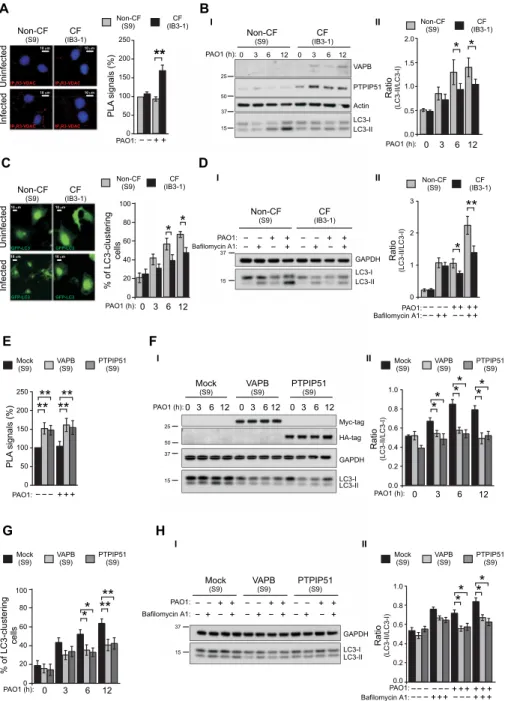
exchange and autophagy (26). We quantified the level of autophagy present in non-CF and CF bronchial cells exposed to P. aeruginosa using the most common marker, microtubule-associated protein 1 light chain 3 (LC3) protein. This protein is processed as LC3-I (~16 kDa) and the membrane-bound form LC3-II (~14 kDa), localized to preautophagosomes. By immunoblotting, the level of autophagy was quantified as ratio of LC3-II to LC3-I. P. aeruginosa led to sig-nificantly down-regulated autophagic response in different CF cel-lular models compared to non-CF cells under the same experimental conditions, as assessed by a decrease in the LC3-II/LC3-I ratio, which is indicative of defective autophagy (Fig. 1B and fig. S1, D and E). Negative regulation of autophagic machinery in CF cells was also confirmed by microscopy using the green fluorescent protein chimera LC3 (GFP-LC3) to monitor the formation of autophagosomes and by quantifying the number of cells that presented ring-shaped GFP-LC3 structures after pathogen infection. Many cells with ring-shaped GFP-LC3 structures were observed in non-CF cells at different stages of infection (Fig. 1C). A marked reduction in the percentage of GFP-LC3–clustering cells was observed in CF cells, indicating minor processing and translocation of LC3-II from the cytosol to auto-phagic vacuoles. These data were also confirmed by autoauto-phagic flux assay. The levels of LC3-II formation were monitored by immuno-blotting in different non-CF and CF bronchial cellular models exposed to P. aeruginosa and then treated with saturating concen-tration of bafilomycin A1. Bafilomycin A1 blocks the fusion of autophagosomes and lysosomes, and by inhibiting LC3-II, degra-dation may modulate the kinetics of autophagosome synthesis. The ratio of LC3-II/LC3-I in the presence of bafilomycin A1 increased in non-CF cells exposed to P. aeruginosa, but this increase was restrained in CF cells, suggesting that the pathogen-induced auto-phagic flux is reduced in CF cells (Fig. 1D and fig. S2, B and C). The reduction in the autophagic response observed in CF cells, during
P. aeruginosa infection, could be due to the down-regulation of
autophagy as a consequence of the enhanced VAPB-PTPIP51 tethers. To address this issue, we monitored autophagy by manipulating the expression of VAPB and PTPIP51 in non-CF bronchial cells. We transfected S9 cells with empty vector (mock), VAPB, and PTPIP51. This overexpression of VAPB or PTPIP51 markedly increased ER-mitochondria contacts enhancing the interactions between
IP3R3 and VDAC in non-CF cells both under basal conditions and
after P. aeruginosa exposure (Fig. 1E). Transfection of VAPB or PTPIP51 decreased both the ratio LC3-II/LC3-I (Fig. 1F) and the
on May 13, 2020
http://advances.sciencemag.org/
B I I I II II D 0 3 6 12 PAO1 (h): * * % of LC3-clustering cells 0 20 40 60 80 100 Ratio (LC3-II/LC3-I) 3 0 PAO1 (h): 0.0 0.5 1.0 1.5 2.0 12 6 * * Ratio (LC3-II/LC3-I) ++−− − − − −
Bafilomycin A1:PAO1:
0 1 2 3 + +++ − − + + * ** Infected Infected IP3R3-VDAC 10 m 10 m 10 m 10 m 10 m 10 m IP3R3-VDAC IP3R3-VDAC GFP-LC3 IP3R3-VDAC GFP-LC3 Non-CF (S9) Non-CF (S9) Non-CF (S9) Non-CF (S9) CF (IB3-1) CF (IB3-1) CF (IB3-1) CF (IB3-1) Uninfected Uninfected A C − − + + PAO1: PLA signals (%) ** 0 50 100 150 200 250 37 15 50 25 LC3-I LC3-II VAPB PTPIP51 Actin 0 3 6 12 PAO1 (h): 0 3 6 12 GAPDH LC3-I LC3-II +− +− − − − − + + + + − − + +
Bafilomycin A1:PAO1:
15 37 F E II H Ratio (LC3-II/LC3-I) +++−−− −− − −− − Bafilomycin A1: PAO1:0.0 0.2 0.4 0.8 0.6 1.0 + + + + + + − −− + ++ G * *** ** 0 3 6 12 PAO1 (h): % of LC3-clustering cells 0 20 40 80 60 100 +− +− +− − − − − − − + + + + + + − − − + + + PAO1: GAPDH LC3-I LC3-II 15 37 GFP-LC3 10 m 10 m GFP-LC3 I 37 15 50 25 LC3-I LC3-II Myc-tag HA-tag GAPDH PAO1 (h):0 3 612 0 3 612 0 3 612 **** − − − + + + PAO1: **** PL A signals (%) 0 50 100 150 200 250 II Ratio (LC3-II/LC3-I) 3 0 PAO1 (h):0.0 0.4 0.2 0.8 0.6 1.0 12 6 * * * * * * * ** * CF (IB3-1) CF (IB3-1) (IB3-1)CF CF (IB3-1) Non-CF (S9) Non-CF (S9) Non-CF(S9) Non-CF (S9) Mock (S9) Mock (S9) VAPB (S9) VAPB (S9) PTPIP51 (S9) PTPIP51 (S9) PTPIP51 (S9) PTPIP51 (S9) PTPIP51 (S9) PTPIP51(S9) VAPB (S9) VAPB (S9) VAPB (S9) VAPB(S9) Mock (S9) Mock (S9) Mock (S9) Mock(S9) Bafilomycin A1:
Fig. 1. The increase of ER-mitochondria tethering inhibits autophagy in CF bronchial cells during P. aeruginosa infection. (A) S9 (non-CF) and IB3-1 cells (CF) were
infected with P. aeruginosa at an MOI of 100, and after 6 hours, proximity ligation assay (PLA) for IP3R3 and VDAC interactions was performed. Representative images with PLA signals (red) in the different cells are shown. The cell nuclei were stained with 4′,6-diamidino-2-phenylindole (blue). The bar chart shows quantification of PLA signals (%), respect to uninfected S9 cells (n = 25 to 30 independent visual field for each condition of three independent experiments). (B) (I) Immunoblots show VAPB and PTPIP51 expression in S9 (non-CF) and IB3-1 (CF) cells during P. aeruginosa infection. The cells were uninfected or infected for 3, 6, and 12 hours. The samples were probed using the antibodies indicated, where actin is used as loading control. Protein molecular mass markers are indicated in kilodalton. (II) Bar chart shows the ratio LC3-II/LC3-I following quantification of signals from immunoblots (n = 5). (C) S9 (non-CF) and IB3-1 cells (CF) were transfected with GFP-LC3–encoding plasmid then infected with
P. aeruginosa, as indicated. Representative images of GFP-LC3–transfected non-CF and CF cells have been reported. The bars depict the percentage of cells showing the
accumulation of GFP-LC3 in cluster (n = 10 to 20 independent visual field for each condition of three independent experiments). (D) Cells were infected with PAO1 at an MOI of 100 MOI for 6 hours and then treated with either vehicle or bafilomycin A1 (100 nM) as indicated. (I) Samples were probed on immunoblots for LC3 and -tubulin as a loading control. (II) Bar chart shows the ratio LC3-II/LC3-I following quantification of signals from immunoblots (n = 10). (E) VAPB or PTPIP51 overexpression increases the IP3R3-VDAC interactions in S9 cells. The bar chart shows quantification of PLA signals (%) respect to uninfected non-CF mock cells (n = 45 independent visual field for each condition of three independent experiments). (F) (I) VAPB or PTPIP51 overexpression was probed using Myc-tag and HA-tag antibodies, respectively, while glyceraldehyde-3-phosphate dehydrogenase (GAPDH) is used as a loading control. (II) Bar chart shows the ratio LC3-II/LC3-I following quantification of signals from immunoblots (n = 4). (G) LC3-clustering cell count in mock and VAPB- or PTPIP51-overexpressing S9 cells during pathogen infection was performed. The bars depict the percentage of cells showing the accumulation of GFP-LC3 in cluster (n = 40 independent visual field for each condition of three independent experiments). (H) (I) VAPB or PTPIP51 overexpression inhibits autophagic flux in S9 cells during P. aeruginosa infection. (II) Bar chart shows the ratio LC3-II/LC3-I following quantification of signals from immunoblots (n = 6). The reported data are means ± SE of at least three independent experiments. Student’s t test was used for indicated comparisons (*P < 0.05 and **P < 0.01).
on May 13, 2020
http://advances.sciencemag.org/
percentage of GFP-LC3–clustering cells (Fig. 1G) in non-CF cells exposed to pathogen at different time points. Moreover, whereas treatment with bafilomycin A1 increased the levels of LC3-II in mock non-CF cells, the magnitude of this increase was reduced in VAPB- and PTPIP51-transfected non-CF cells, confirming that the enhanced expression of VAPB or PTPIP51 tethers reduces autophagic response also in non-CF bronchial cells (Fig. 1H).
Effects of P. aeruginosa–induced VAPB and PTPIP51 expression on selective autophagic responses
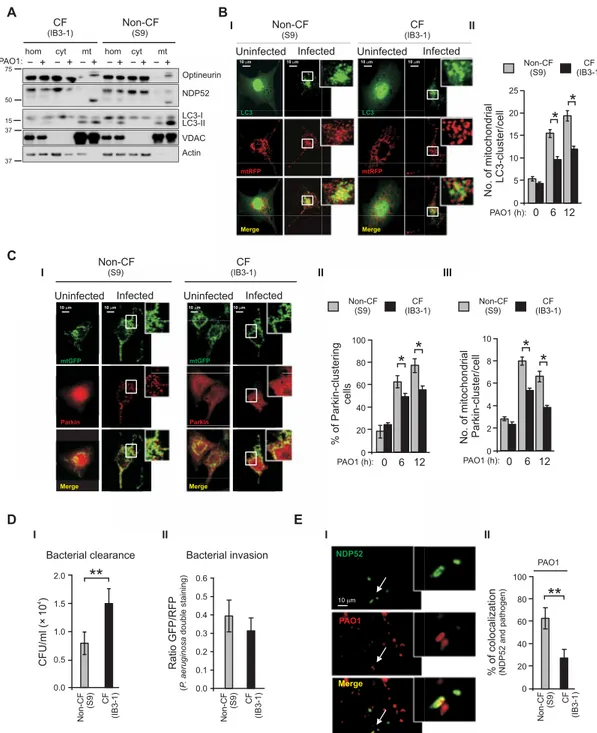
During pathogen infection, selective autophagic responses (mito-phagy and xeno(mito-phagy) contribute together to protect and maintain cellular homeostasis. To test whether their roles could be compro-mised in CF, we first checked whether P. aeruginosa induced a mitophagic response in non-CF and CF bronchial cells. The cells were plated and infected with P. aeruginosa, and after intracellular protein fractionation, the expression level and localization of early [optineurin and nuclear dot protein 52 kDa (NDP52)] and late (LC3) mitophagic markers were immunoblotted (Fig. 2A). Optineurin and NDP52 are cytosolic receptors that are also involved in the xenophagic response and are recruited by PINK1 (phosphatase and tensin homolog-induced kinase 1) in the first steps of mitophagy (27). They are responsible for recognizing damaged mitochondria migrating to organelles and for promoting their sequestration into autophago-somes. In both cell lines, mitophagic receptors accumulated in the mitochondrial fraction after P. aeruginosa infection, triggering the mitophagic response (Fig. 2A and fig. S3A). The reduced mitochondrial redistribution of LC3-II in CF cells suggested slower kinetics of autophagosome synthesis and thus of mitochondrial sequestration compared with non-CF cells (fig. S3A, III). These data were confirmed by colocalization analysis between GFP-LC3 and mitochondrial- targeted red fluorescent protein (mtRFP) (Fig. 2B). As shown by the graph, the number of mitochondria that colocalized with GFP-LC3 clustering was lower in CF cells than in non-CF cells at different stages of pathogen infection. To potentiate the mitophagic response, the kinase PINK1 (phosphatase and tensin homolog–induced kinase 1) phosphorylates Parkin, an E3 ubiquitin ligase that trans-locates to the altered mitochondria to increase the rate of auto-phagosome synthesis (27).
Using confocal microscopy, we evaluated the levels of Parkin recruited to mitochondria through colocalization analysis between mitochondrial-targeted GFP (mtGFP) and chimeric Parkin cherry. The P. aeruginosa–dependent clustering of Parkin to mitochondria in both cell lines was quantified and expressed as the percentage of positive Parkin-clustering cells and as number of mitochondria co-localizing with Parkin clusters for cell (Fig. 2C). In CF bronchial cells, a small percentage of Parkin-clustering cells with respect to non-CF cells was quantified during pathogen infection (Fig. 2, C to I). This reduced amplification of mitophagic response in CF cells was also confirmed by fewer mitochondria colocalization with Parkin cluster (Fig. 2C, II). These results highlight a defect in mitochondrial se-questration during the P. aeruginosa–triggered mitophagic response in CF cells, characterized by reduction of the Parkin-mediated am-plifying signal.
Although P. aeruginosa is primarily considered an extracellular pathogen, reports have demonstrated that, throughout the course of infection, the bacterium acquires the ability to enter and reside within host cells (28). CFTR channel defects could also lead to a reduction in xenophagy during pathogen infection, considering
that xenophagy and mitophagy are two different events linked by common factors. We measured the xenophagic clearance activity and the P. aeruginosa invasion capacity in CF and non-CF bronchial cells. As expected, reduced xenophagic clearance of invading pathogen was detected in CF compared to non-CF cells (Fig. 2D, I). Similar effect on xenophagy has also been confirmed in other CF bronchial cell model and in polarized CF patient–derived airway cells (fig. S3B). In both cases, the higher number of colony-forming unit (CFU) per milliliter of invading bacteria in CF bronchial cells with respect to non-CF indicates a reduction of xenophagic clearance capacity. Through a bacterial invasion assay, we excluded that the accumula-tion of intracellular bacteria in CF bronchial cells depended on potentiated bacterial invasion (Fig. 2D, II). Last, colocalization analysis was performed between NDP52 and invading pathogens (Fig. 2E). Representative images show the intracellular redistribution of NDP52 around invading bacteria to facilitate sequestration. A reduced percentage of colocalization between NDP52 and invading bacteria was detected in CF bronchial cells with respect to non-CF cells, confirming a minor xenophagic clearance capacity of CF bronchial cells.
These data are in line with the previously described results of mitophagy, confirming that, in CF bronchial cells, defects of CFTR channel led to down-regulation of xenophagic and mitophagic re-sponses with subsequent accumulation of invading bacteria (Fig. 2D and fig. S3B) and dysfunctional mitochondria, characterized by
re-duced mitochondrial membrane potential (m) (fig. S3C) and
increased mitochondrial reactive oxygen species (ROS) (fig. S3D). The defective mitophagy in CF cells could be a crucial mecha-nism of the P. aeruginosa–dependent inflammatory exacerbation because its failure to remove P. aeruginosa–damaged mitochondria during infection leads to mitochondrial ROS production and in-flammasome activation, with profound effects on cell physiology and cell viability. Similar effects are ascribable to defective xenophagy because impaired degradation of invading bacteria could result in cell stress and pyroptosis induction.
Reduced selective autophagic responses potentiate UPRmt
and inflammasome activation, favoring a vicious cycle Cells sense and respond to mitochondrial dysfunction by activating
a protective transcriptional program known as UPRmt, which
in-cludes genes that promote mitochondrial protein homeostasis and the recovery of defective organelles. A genetic screen in Caenorhabditis
elegans identified the transcription factor ATFS-1 (activating
tran-scription factor associated with stress-1) as a key regulator of UPRmt.
During mitochondrial dysfunction, ATFS-1 traffics from the cyto-sol to the nucleus, where it induces transcription of mitochondrial chaperones [HSP10 and HSP60 (heat shock 10 kDa protein and heat shock 60 kDa protein)], proteases [CLPP (Caseinolytic Mito-chondrial Matrix Peptidase Proteolytic Subunit)], and antibacterial innate immune genes (8). A similar transcriptional response has been described in mammals in which the putative roles of lc ATF4 (activating transcription factor 4) and ATF5, which have consider-able homology to ATFS-1, are indicated (29). During mitochondrial dysfunction, ATF5 fails to be imported into mitochondria and traffics to the nucleus, inducing gene transcription.
The P. aeruginosa–dependent triggering of UPRmt was evaluated
by ATF5 and ATF4 nuclear translocation in different CF and non-CF bronchial cellular models. Representative images show the nuclear translocation of both transcription factors in CF cells after
on May 13, 2020
http://advances.sciencemag.org/
E A B C % of colocal ization (NDP52 an d pathoge n) NDP52 PAO1 Merge 10 0 20 40 60 80 100 PAO1 Uninfected Infected Uninfected Infected
+ +
− − + −+ − −+ − +
hom cyt mt hom cyt mt
PAO1: Optineurin NDP52 LC3-I LC3-II VDAC Actin 37 37 15 50 75
**
% of Parkin-clustering cells 0 6 12 PAO1 (h):0 20 40 60 80 100*
*
*
*
No. of mitochondrial Parkin-cluster/cell 0 6 12 PAO1 (h):0 2 4 6 8 10 10 m 10 m 10 m 10 m mtGFP mtGFP Parkin Parkin Merge MergeBacterial clearance Bacterial invasion
4 CFU/ml (× 10 ) Ratio (P . aer ugin osa double staining ) GFP/RFP 0.0 0.1 0.2 0.3 0.4 0.5 0.6 D No. of mitochondrial LC3-cluster/cell 0 6 12 PAO1 (h):0 5 10 15 20 25
*
*
I I I I II II II II III**
0.0 0.5 1.0 1.5 2.0 UninfectedUninfected Infected Infected 10 m 10 m 10 m 10 m LC3 LC3 mtRFP mtRFP Merge Merge Non-CF (S9) CF (IB3-1) Non-CF(S9) Non-CF (S9) CF (IB3-1) CF (IB3-1) CF (IB3-1) CF (IB3-1) CF (IB3-1) CF (IB3-1) CF (IB3-1) CF (IB3-1) Non-CF (S9) Non-CF (S9) N on-CF (S9) Non-CF (S9) Non-CF (S9) Non-CF (S9)
Fig. 2. During P. aeruginosa infection the mitophagic and xenophagic response in CF bronchial cells is impaired. (A) Uninfected and P. aeruginosa–infected airways
cells homogenates (hom) of IB3-1 (CF) and S9 (non-CF) cells were fractionated to obtain pure mitochondria (mit) and cytosol (cyt) fractions. Equal amount of proteins (10 g) from each fraction were analyzed by Western blot using the indicated antibodies. VDAC and actin are, respectively, mitochondrial and cytosolic markers. (B) (I) Representative images of S9 and IB3-1 cells cotransfected with GFP-LC3 and mitochondrial RFP and then treated with PAO1 at an MOI of 100 for 6 hours. (II) Quantitative analysis of S9 and IB3-1 cells that contain mitochondria-localized LC3 puncta; the values are expressed as mean number of colocalized-puncta counts per cell (n = 15 to 20 independent visual field for each condition of three independent experiments). (C) (I) Representative images of mitochondrial redistribution of Parkin in S9 and IB3-1 cells after P. aeruginosa infection. Cells were cotransfected with Parkin cherry and mitochondrial GFP and then treated with PAO1 at an MOI of 100 for 6 hours. (II) The bars depict the percentage of cells showing the accumulation of Parkin in cluster. (III) Quantitative analysis of cells that contain mitochondria-localized Parkin cluster, the values are expressed as mean number of colocalized-cluster counts per cell (n = 20 to 22 independent visual field for each condition of at least three independent experi-ments). (D) (I) Infected S9 and IB3-1 cells were lysed after the addition of impermeable antibiotics and streaked on LB agar plates for the determination of intracellular colony-forming units (CFUs) (n = 8 of independent experiments). (II) Double bacteria labeling and confocal microscopy to quantify bacterial invasion in whole S9 and IB3-1 cells exposed for 6 hours to GFP–P. aeruginosa. The bars show the ratio GFP/RFP signal in non-CF and CF bronchial cells, as described in experimental procedure section. (E) (I) Representative images of intracellular P. aeruginosa internalization and recruitment of NDP52 to pathogen in IB3-1 cells. (II) The bar chart shows quantifica-tion of colocalizaquantifica-tion signals (%) between NDP52 and pathogen in S9 and IB3-1 cells (n = 8 to 13 independent visual field for each condiquantifica-tion of at least three independent experiments). The reported data are means ± SE of at least three independent experiments. Paired data were analyzed by Student’s t test (*P < 0.05 and **P < 0.01).
on May 13, 2020
http://advances.sciencemag.org/
E H D F A B
Uninfected PAO1 Uninfected PAO1 Uninfected PAO1 Uninfected PAO1
10 m 10 m ATF4 ATF4 HSP60 HSP60 Merge Merge 0 50 100 150 200 250 300 PAO1:−+−+ PAO1:0 −+−+ 50 100 150 200 250 % Ratio (nucleus/cytosol ) % Ratio (nucleu s/cytosol) * * IL-1 (pg/ml) IL-1 (pg/ml) IL-18 (pg/ml) IL-18 (pg/ml) ** **** *** * ** ** ** ** ** ** * * 0 0 0 20 5 2 40 10 4 60 15 6 20 8 80 25 10 − + ATF5: 0 10 20 30 40 50 60 − − − −
Bafilomycin A1:PAO1: + +− −− −+ ++ ++ +
NLRP3 KO (MEFs) NLRP3 KO(MEFs) WT (MEFs) (MEFs)WT WT (MEFs) (MEFs)WT Rati o (LC3-I I/LC3-I) 0.0 0.5 1.0 1.5 2.0 2.5 3.0 * * * 0 3 6 12 PAO1 (h): CF (IB3-1) CF (IB3-1) CF (IB3-1) CF (IB3-1)
Non-CF (S9) Non-CF (S9) Non-CF (S9) Non-CF (S9)
Actin ATF5 Dimer Monomer ATF4 HSP10 HSP60 CLPP 50 37 50 50 10 25 50 C − − − −
Bafilomycin A1:PAO1: + +− −− −+ ++ ++ +
ATF5-GFP (IB3-1) ATF5-GFP (IB3-1) GFP (IB3-1) GFP (IB3-1) Ratio (LC3-II/LC3-I) * * ATF5-GFP (IB3-1) GFP (IB3-1) GFP GFP GAPDH IL-1 cl. LC3-I Casp-1 p10 LC3-II ATF4 Actin 37 15 50 50 50 50 37 37 75 75 15 10
Bafilomycin A1:PAO1:
PAO1: − − − − − − − + + − − − − − − + + + + + + + + + + + 0.0 0.5 1.0 1.5 2.0 2.5 I I I I II II II II I II NLRP3 KO (MEFs) WT (MEFs) Actin LC3-I LC3-II 37 15 − − Bafilomycin A1: + − PAO1: − + + + − − + − − + + + ATF5 HSP60 Merge 10 m ATF5 HSP60 Merge 10 m ATF5 HSP60 Merge 10 m ATF5 HSP60 Merge 10 m 10 m ATF4 HSP60 Merge 10 m ATF4 HSP60 Merge G Bacterial clearance 4 CFU/ml (× 10 ) * 0.0 0.5 1.0 1.5 2.0 2.5 (lys) (lys) (lys) (sur) Ra tio Ratio (IL-1 /actin) PAO1:0.0 PAO1:0.0 0.3 0.3 0.6 0.6 0.9 0.9 1.2 1.2 * PAO1: PAO1: PAO1: Ac-YVAD-cmk: Ac-YVAD-cmk: PAO1: − − − − − + + − + + + + + + + + −+ −+ + − − + − − + + + + + + + + + + + + + −+ −+ + − + ATF5: ATF5: ATF5: ATF5: KO (MEFs) KO (MEFs) CF (IB3-1) CF (IB3-1)CF (IB3-1) (IB3-1)CF Non-CF (S9) Non-CF Non-CF(S9) (S9) Non-CF(S9) CF
(IB3-1) Non-CF(S9) (IB3-1)CF
*
(Casp-1 p10/actin)
Fig. 3. Abnormal P. aeruginosa–dependent UPRmt activation lead to worsening of autophagic defect and of inflammatory response in CF bronchial cells.
(A) Representative confocal images of nuclear translocation of endogenous ATF5 (I) and ATF4 (II) in S9 (non-CF) and IB3-1 (CF) cells during pathogen infection. The graphs report the nuclear redistribution of ATF5 and ATF4 after PAO1 infection, expressed as percentage increase in fluorescent ratio signals (from cytosol to nucleus) with re-spect to uninfected condition (n = 6 to 10 independent visual field for each condition of three independent experiments). (B) Immunoblots of IB3-1 and S9 cells uninfected or infected for 3, 6, and 12 hours, as indicated. The samples were probed using the antibodies indicated, where actin is used as loading control. (C) (I) Autophagic flux in IB3-1 cells overexpressing ATF5 during P. aeruginosa infection. GFP- and ATF5GFP-transfected cells were infected with PAO1 at 100 MOI for 6 hours and then treated with bafilomycin A1, as indicated. (II) Bar chart shows the ratio LC3-II/LC3-I following quantification of signals from immunoblots (n = 6). (D) Immunoblots of cleaved caspase-1 and processed IL-1 from lysates (lys) or supernatants (sur) of IB3-1 and ATF5-overexpressed IB3-1 cells infected for 6 hours with P. aeruginosa. Actin was used as loading control. The quantification is expressed as the ratio of casp-1–p10/actin and cleaved IL-1/actin. The bars are the means ± SE of four independent immunoblots. (E) IB3-1 and S9 cells were transfected with ATF5-GFP and after 6 hours of PAO1 infection, and the cultured cell supernatant were collected to quantify the levels of proinflammatory cytokines by enzyme-linked immunosorbent assay (ELISA) (n = 5 of independent experiments). The selective inhibitor of caspase-1, 20 M Ac-YVAD-cmk, was added 30 min before infection. (F) Murine WT and NLRP3-null (NLRP3 KO)–derived embryonic fibroblasts (MEFs) were infected with PAO1 at an MOI of 100 for 6 hours and then treated with either vehicle or bafilomycin A1 as indicated. (I) Samples were probed on immunoblots for LC3 and actin as a loading control. (II) Bar chart shows the ratio LC3-II/LC3-I following quantification of signals from immunoblots (n = 4). The reported data are means ± SE of at least three independent experiments. (G) Infected WT and NLRP3 KO MEFs were lysed after the addition of impermeable antibiotics and streaked on LB agar plates for the determination of intracellular CFUs (n = 3 of indepen-dent experiments). (H) WT and NLRP3 KO MEFs were transfected with ATF5-GFP and after 6 hours of PAO1 infection, and the cultured cell supernatant were collected to quantify the levels of proinflammatory cytokines by ELISA (n = 3 of independent experiments). Paired data were analyzed by Student’s t test (*P < 0.05 and **P < 0.01).
on May 13, 2020
http://advances.sciencemag.org/
P. aeruginosa infection (Fig. 3A and fig. S4A). Major ATF5 and ATF4
nuclear redistribution was measured in CF cells with respect to non-CF cells challenged with P. aeruginosa, suggesting that UPRmt is mainly induced in CF cells (Fig. 3A and fig. S4A). P. aeruginosa–dependent
UPRmt activation was also monitored by immunoblotting and
quanti-fication of UPRmt reporters, such as HSP10, HSP60, and CLPP
(Fig. 3B and fig. S4, B and C). Increased expression levels of UPRmt
reporters followed the abnormal UPRmt induction promoted by the
stabilization of ATF5 and ATF4 in CF cells during pathogen infec-tion. Similar results were also obtained in polarized CF patient– derived airway cells, where the stabilization and dimerization of ATF5, induced by P. aeruginosa infection, corresponded to an in-crement of UPRmt reporters (fig. S4D).
Considering the defective mitophagy and consequent
accumula-tion of dysfuncaccumula-tional mitochondria, persistent activaaccumula-tion of UPRmt
was assessed in CF cells when exposed to pathogen infection. Since ATF5 has been shown to suppress autophagy in human BCR-ABL– transformed cells (30), we questioned whether the stabilization of ATF5 in CF cells, and thus the persistent UPRmt activation, affected
P. aeruginosa–triggered autophagy and inflammation. To mimic UPRmt
hyperactivation, we transfected the chimera ATF5-GFP into CF bronchial cells. This overexpression favored the stabilization of ATF4 and markedly increased the susceptibility to P. aeruginosa–triggered UPRmt acti-vation, enhancing the expression level of UPRmt reporters in CF cells,
both under basal conditions and upon P. aeruginosa infection (Fig. 3C and fig. S5A). Moreover, transfection of different CF bronchial cel-lular models with ATF5, then exposed to P. aeruginosa, decreased the LC3-II/LC3-I ratio according to the autophagic flux assay, indi-cating that persistent UPRmt activation in CF cells during pathogen infection further decreases the rate of autophagic response (Fig. 3C and fig. S5B). ATF5 overexpression resulted in enhanced inflam-matory sensitivity to pathogen infection in CF bronchial cells, as shown by increased expression level of cleaved caspase-1 and cleaved cytokine interleukin–1 (IL-1) in cell supernatant (Fig. 3D and fig. S5C) and by higher level of inflammasome-dependent IL-1 and IL-18 release (Fig. 3E and fig. S5D). The forced expression of ATF5 strengthened the inflammasome- dependent IL-1 release after incubation with
P. aeruginosa in non-CF bronchial cells (Fig. 3, E to I, and fig. S5, D
to I), the same cells, where the presence of wt CFTR mitigates the
P. aeruginosa–dependent mitochondrial effects, avoiding NLRP3
inflammasome activation (7).
However, the exacerbation of the P. aeruginosa–triggered in-flammation promoted by ATF5 overexpression was attenuated by the pretreatment with caspase-1 inhibitor Ac-YVAD-cmk (20 M), which, by affecting the inflammasome, reduced the release of cyto-kines (Fig. 3E and fig. S5D) and ameliorated the rate of autophagic response in CF bronchial cells (fig. S5E). These results confirm that the synergy between P. aeruginosa–dependent mitochondrial stress
and consequent abnormal UPRmt activation leads to worsening of
autophagic defects and inflammatory responses in CF cells. Additional data obtained in NLRP3 knockout (KO) and WT mouse embryonic fibroblasts (MEFs) suggested that the down- regulation of autophagy during P. aeruginosa infection is also strictly related to NLRP3 inflammasome activation (Fig. 3F). By autophagic flux assay, the LC3-II conversion in the presence of bafilomycin A1 increased in WT fibroblasts, but this increase was augmented in NLRP3 KO fibroblasts, both under basal condition and after
P. aeruginosa infection, indicating that loss of NLRP3 stimulates
autophagic flux. NLRP3 deficiency augmented bacterial clearance
capacity in NLRP3 KO MEFs with respect to WT MEFs (Fig. 3G), while the NLRP3 activator nigericin (10 M) treatment reduced the bacterial clearance capacity in CF bronchial cells, enhancing further the number of CFU per milliliter of invading pathogen (fig. S5F). Last, the deletion of NLRP3 in MEFs prevented the inflammasome- dependent IL-1 and IL-18 release in ATF5-overexpressing NLRP3 KO MEFs during P. aeruginosa infection (Fig. 3H). Collectively, these findings show that the worsening of defective autophagy in CF bronchial cells, started by P. aeruginosa–induced VAPB and PTPIP51
expression, is also sustained by abnormal UPRmt and NLRP3
inflammasome activation, contributing to persistent accumulation of damaged mitochondria and invading bacteria.
Regulation of ER-mitochondria tethering controls Ca2+
exchange and abrogates the effects of tethering on autophagy
The expression of VABP or PTPIP51 both led to an increase in
IP3R3-VDAC interactions (fig. S6A). We monitored whether
over-expression of VAPB or PTPIP51 affected the uptake of Ca2+ by
mitochondria following IP3R-mediated release from the ER store.
For these experiments, we cotransfected, in different CF bronchial cellular models, empty vector (pcDNA3), VAPB, or PTPIP51 and
mitochondrial-targeted aequorin Ca2+ probe. We triggered
physio-logical IP3R-mediated Ca2+ release by stimulation with 100 M
histamine. As expected, transfection of both VAPB and PTPIP51
induced a significant increase in mitochondrial Ca2+ response
(Fig. 4A and fig. S6B) and had no effects on cytosolic Ca2+ levels (fig. S6C). We therefore investigated whether the reduction in auto-phagy induced by VAPB or PTPIP51 overexpression is caused by a higher Ca2+ transfer to mitochondrial matrix. To verify this hypothesis,
we first quantified the changes in IP3R3-VDAC interactions by PLA
in MCU-silenced CF bronchial cells (shMCU-CF cells) transfected with pcDNA3, VAPB, or PTPIP51 during pathogen infection or SMM treatment (Fig. 4B and fig. S6D). The silencing of MCU induced a reduction in the protein expression (fig. S6E) and in
histamine-dependent mitochondrial Ca2+ uptake (fig. S6F) without
affecting the m (fig. S6G). The reduction in mitochondrial Ca2+ uptake
in shMCU-CF cells protected the mitochondria from P. aeruginosa– dependent m loss, decreasing mitochondrial superoxide production and
NLRP3 activation (7). The maintenance of mitochondrial physiology in shMCU-CF cells during P. aeruginosa infection is also confirmed by lacked P. aeruginosa–triggering nuclear translocation of transcription
factors ATF5 and ATF4, avoiding the UPRmt activation (fig. S6H).
Under basal conditions, the overexpression of VAPB or PTPIP51
increased the association between the two ER-mitochondria Ca2+
exchange proteins, IP3R3-VDAC in shMCU-CF cells. In contrast,
no significant differences emerged between empty vector–transfected shMCU-CF cells (pcDNA3) and nonsilenced CF cells (Mock). In CF cells, P. aeruginosa exposure led to a marked enhancement of
IP3R3-VDAC PLA signaling (Figs. 1A and 4B). This increase was
abrogated both in pcDNA3-transfected shMCU-CF cells and in VAPB- or PTPIP51-overexpressing shMCU-CF cells, indicating that the
changes in IP3R3-VDAC interactions during pathogen infection are
strictly dependent on MCU (Fig. 4B). The gain of IP3R3-VDAC
in-teraction in CF bronchial cells exposed to P. aeruginosa or SMM could be the consequence of compensatory responses that promote the increase of VAPB and PTPIP51 expression, at front of pathogen-
dependent mitochondrial perturbations, which impairs m and thus
Ca2+ uptake into the mitochondrial matrix.
on May 13, 2020
http://advances.sciencemag.org/
A B C 0 1 2 3 4 5 Histamine 30 s [Ca 2+]( M) m pcDNA3
(IB3-1) (IB3-1)VAPB PTPIP51(IB3-1)
IB3-1 shMCU IB3-1 shMCU IB3-1 shMCU IB3-1 shMCU − − − − − − − − + + + + + + + + + + + + + + + + + + − − + + ++ PAO1: shMCU: shMCU: * * * ** PL A signals (% ) 0 50 100 150 200 250 Mock
(IB3-1) (IB3-1)Mock
Mock (IB3-1) pcDNA3 pcDNA3 pcDNA3 PTPIP51 PTPIP51 PTPIP51 VAPB VAPB VAPB D −+++−+++−+++ −+++ shMCU: * * * * * * * * 0 3 6 12 PAO1 (h): % of LC3-clustering cells 0 20 40 60 80 E Ratio (LC3-II/LC3-I) − − −− − − − − −− − −
Bafilomycin A1:PAO1:
0.0 0.5 1.0 1.5 − − − − + + + + + + ++ + + ++++ + + ****** ****** ** * pcDNA3 Mock
(IB3-1) VAPB PTPIP51
+ + − + + − − − − − − − − − − + + + + + + + + − − + − − + + + PAO1: GAPDH LC3-I LC3-II 15 37 25 − − − − ++ + +++ + + ++ + + shMCU: − Bafilomycin A1: F G H I J + PAO1 IL-1 (pg/ml) IL-18 (pg/ml) ** ** ** ** 0 20 40 60 80 − − −−+ +−++ −−+ +−++ ATF5: ATF5: KB-R7943: KB-R7943: 0 10 20 30 40 50 ** * [Ca 2+]( M) m 0 1 3 2 4 5 PL A signals (% ) Area und er curve (a.u.) 2+ [C a] m (mtGCaMP ratio; ex, 490/400; R/R 0 ) ** * ** * * * 0 0 0 50 0.9 0.3 100 s 100 200 150 1.2 200 400 250 1.5 600 CF-KB-R7943 (IB3-1) ** ** F .A.U. (%) 0 20 60 40 80 120 100 −+ − + PAO1: ** ** ** Mitochondri al ROS production (%) 0 20 60 40 80 120 100 140 KB-R7943 (IB3-1) KB-R7943 (IB3-1) KB-R7943 (IB3-1) Untreated (IB3-1) Untreated (IB3-1) Untreated (IB3-1) I I II II −+ − + PAO1: 0 15 60 KB-R7943 (min): − − −+ + +
PAO1: KB-R7943:PAO1:−− −− −++−−−++++++ KB-R7943:PAO1:−+−+++
Mitochondrial membrane potential CF (IB3-1) (IB3-1)CF Non-CF (S9) Non-CF(S9) PAO1:++ ++ PAO1:++ ++ CF (IB3-1) (IB3-1)CF
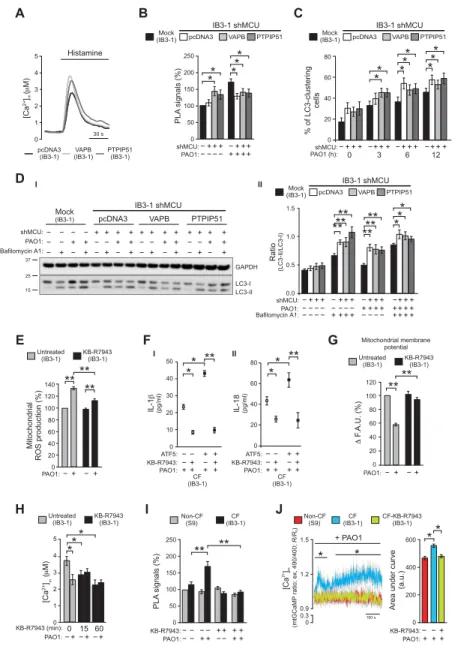
Fig. 4. MCU targeting abrogates the effects of VAPB and PTPIP51 on autophagy, restoring the mitochondrial physiology in CF bronchial cells exposed to pathogen.
(A) Mitochondrial Ca2+ response in IB3-1 cells (CF cells) overexpressing VAPB or PTPIP51; representative traces are shown. Cells were cotransfected with mitochondrial- targeted aequorin with control empty vector (pcDNA3), VAPB, or PTPIP51 and stimulated with 100 M histamine. (B) Stable MCU-silenced IB3-1 clone (IB3-1 shMCU) was transfected with pcDNA3, VAPB, or PTPIP51 and then infected with PAO1 at an MOI of 100 for 6 hours. PLA for IP3R3 and VDAC interactions was performed. The bar chart shows quantification of PLA signals (%), with respect to uninfected IB3-1 cells (mock) (n = 15 independent visual field for each condition of three independent experiments). (C) LC3-clusteing cell count in pcDNA3 and VAPB- or PTPIP51-overexpressing IB3-1 shMCU cells during pathogen infection was performed. The bars depict the percentage of cells showing the accumulation of GFP-LC3 in cluster (n = 25 independent visual field for each condition of at least three independent experiments). (D) Effects of VAPB and PTPIP51 on autophagic flux in IB3-1 shMCU cells during pathogen infection. (I) Samples were probed on immunoblots for LC3 and GAPDH as a loading control. (II) Bar chart shows the ratio LC3-II/LC3-I following quantification of signals from immunoblots (n = 6). (E) The effects of MCU-inhibition by 1 M KB-R7943 pretreatment on super-oxide production in CF bronchial cells during PAO1 infection. The quantification of percentage change of cells positive for MitoSox staining compared with uninfected IB3-1 cells is shown (n = 8 independent experiments). (F) Levels of IL-1 and IL-18 in KB-R7943–treated mock and ATF5-overexpressing IB3-1 cells, collected after 6 hours of PAO1 infection at an MOI of 100 (n = 10 independent experiments). (G) Measurements of mitochondrial in KB-R7943–treated and untreated IB3-1 cells during bacterial infec-tion. The bars show the change in the TMRM fluorescence level before and after treatment with P. aeruginosa strain, expressed as the percentage change with respect to untreated IB3-1 cells. FCCP was used to collapse the mitochondrial (n = 12 independent experiments). F.A.U., fluorescent arbitrary units. (H) Histamine-dependent mito-chondrial Ca2+ responses of KB-R7943 pretreating IB3-1 cells at different time points before and after PAO1 infection. The histograms show all means ± SE of mitochondrial Ca2+ responses (n = 5 independent experiments). (I) S9 (non-CF) and IB3-1 cells (CF) were pretreated with KB-R7943 1 hour before the infection with PAO1 at an MOI of 100. PLA for IP3R3 and VDAC interactions was performed. The bar chart shows quantification of PLA signals (%), with respect to uninfected S9 cells (n = 15 independent visual field for each condition). The reported data are as means ± SE of at least three independent experiments. (J) Mitochondrial Ca2+ dynamics in S9- (non-CF), IB3-1– (CF), and KB-R7943–treated IB3-1 (CF-KB-R7943) cells exposed to PAO1 at an MOI of 100 were evaluated through ratiometric imaging of mitochondrial-targeted GCaMP6. Traces represent means ± SE of mitochondrial Ca2+ response from at least of 10 independent experiments. SE values are illustrated using gray shading. For statistical significance, the multiple Student’s t test has been used. The bar chart shows the quantification of the area under the curve. a.u., arbitrary unit. Student’s t test used for indicated comparisons (*P < 0.05 and **P < 0.01).
on May 13, 2020
http://advances.sciencemag.org/
We also monitored how MCU silencing affected autophagy in VAPB- or PTPIP51-overexpressing CF cells. MCU silencing in CF cells, challenged with P. aeruginosa, induced a significant increase in the percentage of GFP-LC3–clustering cells with respect to naive CF cells (Fig. 4C). However, the inhibitory effects of VAPB and PTPIP51 overexpression on the percentage of GFP-LC3–clustering cells were abrogated in shMCU-CF cells exposed to P. aeruginosa (Fig. 4C). Moreover, treatment with bafilomycin A1 not only con-firmed that the silencing of MCU increased the LC3-II/LC3-I ratio, demonstrating an induction of autophagy, but also showed that this increase was unaffected by overexpression of VAPB or PTPIP51 (Fig. 4D). Thus, the inhibitory effect of VAPB and PTPIP51 on autophagy in CF bronchial cells is lost by blocking mitochondrial
Ca2+ uptake. In this case, it is also possible to prevent the
in-crease in IP3R3-VDAC interactions during pathogen infection due
to P. aeruginosa–induced VAPB and PTPIP51 expression (Fig. 4B). MCU inhibition limits the P. aeruginosa–dependent
inflammatory response and mitochondrial stress, promoting autophagy
All these results identify MCU as a candidate target to limit P. aeruginosa– mediated hyperinflammation in the CF lung, raising the question of its druggability in the CF inflammatory model. In this view, we tested the MCU inhibitor KB-R7943 (1 M), pretreating CF bronchial cells 1 hour before challenging with P. aeruginosa. The selected con-centration of drug is useful to partially reduce mitochondrial Ca2+
uptake in CF bronchial cells. KB-R7943, which was developed to inhibit the reverse mode of Na+/Ca2+ exchange (NCX) in intact cells, a
lower concentration has been shown to be a potent MCU inhibitor, an effect that contributes to its protective activity (31). In addition, given that CF cells (IB3-1) used in our in vitro experiments lack any plasma membrane (PM) NCX activity (32), KB-R7943 could be considered a specific MCU inhibitor in these CF cells. KB-R7943 pretreatment prevented P. aeruginosa–triggered mitochondrial dys-function in CF bronchial cells, reducing mitochondrial ROS pro-duction (Fig. 4E), inflammasome activation (fig. S7A), and the inflammasome-dependent IL-1 and IL-18 release (Fig. 4F and fig. S7B). The anti-inflammatory effect of KB-R7943 was also confirmed by reduced levels of IL-1 and IL-18 released in the culture super-natants of ATF5-overexpressing CF cells after exposition to bacteria, abrogating the amplification of P. aeruginosa–triggered inflammasome response induced by abnormal UPRmt activation (Fig. 4F and fig. S7B).
Reports have purported that the protective effect of KB-R7943 is due in part to mild m depolarization and/or complex I inhibition
(33, 34). Successively, these considerations have been questioned, demonstrating that KB-R7943 has no negative impact on mito-chondrial respiration and m (35). However, KB-R7943 pretreatment
did not alter m in CF bronchial cells under basal condition,
excluding an effect on the mitochondrial respiratory capacity and
m (Fig. 4G); KB-R7943 prevented m loss observed in CF
bronchial cells upon prolonged pathogen infection (Fig. 4G). The effect of MCU inhibition on intracellular Ca2+ signaling was
evalu-ated using aequorin-based measurement. KB-R7943 alone induced
a reduction in histamine-dependent mitochondrial Ca2+ response
in CF cells (Fig. 4H and fig. S7C) without affecting cytosolic tran-sient and ER Ca2+ content (fig. S7D), indicating once more that the
effect of KB-R7943 on mitochondrial Ca2+ signaling is not ascribable to perturbed mitochondrial respiratory capacity but only to the selec-tive inhibition of MCU. No differences in histamine-dependent
mito-chondrial (Fig. 4H) and cytosolic (fig. S7E) Ca2+ responses were
emerged between P. aeruginosa–infected KB-R7943–treated CF cells and uninfected KB-R7943–treated CF cells. The lacked synergistic reduction of mitochondrial Ca2+ response in P. aeruginosa–infected
KB-R7943–treated CF cells (in theory, due to KB-R7943–dependent
MCU inhibition and to P. aeruginosa–induced m dissipation)
demonstrates that KB-R7943 through the inhibition of MCU pre-serves the m during pathogen infection, preventing mitochondrial
damage that could further affect the mitochondrial Ca2+ uptake
capacity of CF bronchial cells (Fig. 4H).
We also demonstrated that, when preventing P. aeruginosa– dependent mitochondrial dysfunction by KB-R7943, the increases
in IP3R3-VDAC interactions during bacterial infection or SMM
were lost (Fig. 4I). We suppose that the exacerbation of the P. aeruginosa– triggered inflammatory response is mitigated by MCU inhibition,
which avoids a mitochondrial Ca2+ overload due to compensatory
increased ER-mitochondria interaction, which, in turn, favors a higher ER-mitochondria Ca2+ transfer in CF bronchial cells during pathogen
infection. To demonstrate this, we performed mitochondrial Ca2+
measurement using the ultrasensitive mitochondrial GFP-based Ca2+
probe, mtGCaMP6, useful to measure fast and small mitochondrial Ca2+ change (Fig. 4J and fig. S7F). Acute exposure of CF bronchial
cells to P. aeruginosa or SMM induced a sustained increase of mito-chondrial Ca2+ concentration (Fig. 4J and fig. S7F). Conversely, by
inhibiting MCU with KB-R7943, the mitochondrial Ca2+ uptake in
CF bronchial cells exposed to pathogen or SMM was abrogated. No
perturbation in mitochondrial Ca2+ signaling was detected in
non-CF bronchial cells when exposed to P. aeruginosa or SMM (Fig. 4J
and fig. S7F), confirming a higher ER-mitochondria Ca2+ transfer
in CF bronchial cells. The concept of mitochondrial Ca2+ overload,
however, does not necessarily refer solely to a very large increase in
mitochondrial Ca2+ concentration, rather much smaller, but
pro-longed, increases of Ca2+ may activate the organelle dysfunctional
machinery, leading to m dissipation, reduced ATP production,
increased release of ROS, protein tyrosine phosphatase opening, and mitochondria swelling (20).
Then, we monitored whether KB-R7943 affected autophagy in CF bronchial cells when exposed to P. aeruginosa. The higher LC3-II/LC3-I ratio (Fig. 5A and fig. S8A) and percentage of GFP-LC3– clustering cells (Fig. 5B) in KB-R7943–treated CF cells than in untreated CF cells indicated recovery of autophagy during infection. Treatment with bafilomycin A1 confirmed that KB-R7943 pretreatment,
by preventing mitochondrial Ca2+ overload, increased the LC3-II/
LC3-I ratio in CF cells upon P. aeruginosa challenge and thus auto-phagy (Fig. 5C). However, the increase in LC3-II/LC3-I ratio (Fig. 5D) and percentage of GFP-LC3–clustering cells (Fig. 5E) in KB-R7943– treated CF cells exposed to the pathogen were unaffected by over-expression of tethers, VAPB or PTPIP51. The recovery of autophagy in KB-R7943–treated CF cells, by MCU inhibition, potentiated the bacterial clearance activity in different CF bronchial cell models when exposed to bacteria (Fig. 5F and fig. S8B), ameliorating cell viability (Fig. 5G and fig. S8C). To exclude the possibility that KB-R7943 has toxic effects on bacterial viability and proliferation, we evaluated
P. aeruginosa growth under different concentrations of KB-R7943.
No changes in the bacterial growth curve emerged (fig. S8D). In line with the data of MCU silencing, the inhibition of mitochondrial
Ca2+ uptake abrogates the inhibitory effects of VAPB and PTPIP51
on autophagy in CF bronchial cells, promoting cell resistance to pathogen infection.
on May 13, 2020
http://advances.sciencemag.org/
KB-R7943 mitigates the P. aeruginosa–triggered inflammatory response in vivo
Last, we analyzed the efficacy of KB-R7943 in counteracting pathogenic
CF lung inflammation in vivo. C57Bl/6 Cftrtm1UNCTgN(FABPCFTR)#Jaw
(CFTR-KO) mice and their WT (non-CF) littermates were infected with P. aeruginosa AA43 clinical isolate embedded in agar beads and treated with KB-R7943 (300 g/kg) or vehicle (ctrl) via aerosol
ad-ministration by the Penn-Century MicroSprayer Aerosolizer. The schedule of treatment was 1 hour before infection and then every 12 hours. Two days after infection and 1 hour after the last treatment, murine lungs and bronchialalveolar lavage fluid (BALF) were collected and processed. First, we evaluated the KB-R7943 distribution in tissues of treated mice by mass spectrometry. The drug was detected both in the lung homogenates [677.1 ± 305.6 pg/ml (WT) versus
A B C D G F E + − PAO1: −+
*
**
**
Ratio (LC3-II/LC3-I) 0.0 0.5 1.0 1.5 0 3 6 12 PAO1 (h):* * *
Ratio (LC3-II/LC3-I) 0.0 0.5 1.0 1.5 0 3 6 12 PAO1 (h):*
*
*
% of LC3-clustering cells 0 20 40 60 80 0 3 6 12 PAO1 (h):**
**
*
*
% of annexin V–positive cells 0 20 10 40 30 60 50 70 Bacterial clearance Non-C F (S9) (IB3-1)CF** * *
CFU/ml (× 10 4) 0.0 0.5 1.0 1.5 2.0 KB-R7943 PAO1 (h): % of LC3-clustering cells 0 20 40 60 80 0 3 6 12 I II I II CF (IB3-1) CF (IB3-1) Actin LC3-I LC3-II + − − − + + − + PAO1: KB-R7943: 15 37 Bafilomycin A1 GAPDH LC3-I LC3-II 0 6 + + 0 6 − − 3 12 + + 3 12 − − PAO1 (h): KB-R7943: 15 37 I Actin LC3-I LC3-II + + + − − − − − − − − − + + + + + + − − − + + + PAO1: KB-R7943: 15 37 II − − − −− − + + + ++ + KB-R7943: − − − ++ + − − − ++ + PAO1: Ratio (LC3-II/LC3-I) Untreated KB-R794 Mock 3 shMC U 0.0 0.5 1.0 1.5 2.0 2.5 3.0 CF-KB-R7943 (IB3-1) CF (IB3-1) Non-CF(S9) KB-R7943(IB3-1) KB-R7943(IB3-1) KB-R7943(IB3-1)
Untreated
(IB3-1) Untreated(IB3-1) Untreated(IB3-1)
Mock
(IB3-1) VAPB(IB3-1) PTPIP51(IB3-1)
PTPIP51
(IB3-1) PTPIP51(IB3-1)
VAPB
(IB3-1) (IB3-1)VAPB
Mock
(IB3-1) (IB3-1)Mock
Fig. 5. KB-R7943 restores the autophagic response in CF bronchial cells. (A) (I) Immunoblot of untreated and KB-R7943–treated IB3-1 cells infected with PAO1 at an
MOI of 100 for 6 hours. The samples were probed for LC3 and actin as a loading control. (II) Bar chart shows the ratio LC3-II/LC3-I following quantification of signals from immunoblots (n = 5). (B) LC3-clustering cell count in untreated and KB-R7943–treating IB3-1 cells was performed. The bars depict the percentage of cells showing the accumulation of GFP-LC3 in cluster during P. aeruginosa infection (n = 20 independent visual field for each condition of at least three independent experiments). (C) Ef-fects of KB-R7943 on autophagic flux in IB3-1 cells during pathogen infection. (I) Samples were probed on immunoblot for LC3 and GAPDH as a loading control. (II) Bar chart shows the ratio LC3-II/LC3-I following quantification of signals from immunoblots (n = 6). (D) Immunoblots of mock and VAPB- and PTPIP51-overexpressing IB3-1 cells pretreated with KB-R7943 1 hour before P. aeruginosa infection, as indicated. (I) Samples were probed on immunoblot for LC3 and actin as a loading control. (II) Bar chart shows the ratio LC3-II/LC3-I following quantification of signals from immunoblots (n = 6). (E) LC3-clustering cell count was performed in mock and VAPB- or PTPIP51-overexpressing IB3-1 cells exposed to MCU-inhibitor, KB-R7943, and PAO1 at an MOI of 100, as indicated. The bars show the percentage of cells showing the accumulation of GFP-LC3 in cluster (n = 20 independent visual field for each condition of at least three independent experiments). (F) S9, KB-R7943–treating IB3-1 cells, and/or IB3-1 shMCU cells were infected with PAO1 at an MOI of 100 for 6 hours and then lysed after the addition of impermeable antibiotics and streaked on LB agar plates for the determination of intracellular CFUs (n = 10 of independent experiments). (G) Effect of KB-R7943 on IB3-1 cell apoptosis, during P. aeruginosa infection, using annexin V Alexa Fluor 488/propidium iodide staining. Cells were plated in 60-mm plates and treated for 1 hour with KB-R7943 before PAO1 infection, as indicated. Cell viability and death were evaluated using a Tali apoptosis kit and the Tali image-based cytometer. Bars show the percentage of IB3-1 (CF) and S9 (non-CF) cells that were annexin V–fluorescein isothiocyanate–positive (n = 6 independent experiments). The reported data are means ± SE of at least three independent experiments. Student’s t test was used for indicated comparisons (*P < 0.05 and **P < 0.01).
on May 13, 2020
http://advances.sciencemag.org/
Bacterial clearanc e (%) Survival (%) Hours lung BALF 0 20 20 12 24 36 48 0 0 40 40 60 60 80 80 100 100 120 −+ −+ −+ −+ KB-R7943: A B C D E G WT KO WT KO Ratio (LC3-II/LC3-I) Ratio (NLRP 3/actin) − −+ − + −+ KB-R7943: + KB-R7943:0.0 0.0 0.1 0.5 0.2 1.0 0.3 1.5 0.4 2.0 **** *** IL-18 (pg/ml) KB-R7943:0 20 40 60 80 100 ** ** WT WT WT WT WT KO KO KO KO KO IL-1 (pg/ml) Global inflammatory score − − − + + + − − − + + + KB-R7943: KB-R7943: 0 0 5 5 10 10 15 15 20 * ** * 0 50,000 150,000 100,000 200,000 WT KO To tal CFU −+ −+ KB-R7943: * * * * * I II III II KB-R7943 Infected KB-R7943 Vehicle Cleared Vehicle KB-R7943 KB-R7943 KB-R7943 Vehicle Vehicle Vehicle F I WT CFTR-KO CFTR-KO NLRP3 Actin − − − − + + + − − + + + KB-R7943: 75 100 150 37 15 LC3-ILC3-II Vehicle Ve hicle KB-R7943 KB-R7943 I II I VII II VIII III IX IV X V XI VI XII WT WT KO KO WT WT KO KO WT WT KO KO BALF BALF PAO1: + + + + PAO1: + + + +
Fig. 6. KB-R7943 limits the P. aeruginosa–triggered inflammatory response in CF mice. C57BL/6 Cftrtm1UNCTgN(FABPCFTR)#Jaw mice (CFTR-KO) (n = 20 for each ex-perimental condition) and their WT littermates (n = 20 for each exex-perimental condition) were inoculated with 1.5 × 10⁶ CFU of P. aeruginosa AA43 isolate embedded in agar beads. Mice were treated with KB-R7943 (300 g/kg) or vehicle via aerosol administration by the Penn-Century MicroSprayer Aerosolizer every 12 hours starting 1 hour before infection. Every 12 hours, mice were monitored for the health status. Two days after infection, 1 hour after the last treatment, murine lungs and BALFs were collected and processed. (A) Kaplan-Meier survival curve for untreated and KB-R7943–treated CFTR-KO mice. The data were analyzed by log-rank (Mantel-Cox) test and Gehan-Breslow-Wilcoxon test (P = 0.0378; GraphPad Prism, USA) (n = 20 mice for each condition of three independent experiments). (B) Clearance and infection were determined on surviving mice. The data were analyzed by Fisher’s test (confidence intervals, 95%; *P < 0.05; GraphPad Prism, USA) (n = 20 mice for each condition of three independent experiments). (C) Bacterial burden in the lungs of KB-R7943–treated and untreated mice after 2 days from P. aeruginosa challenge is shown. Bar chart repre-sent means ± SE of lung CFU in mice. Data were analyzed by two-way ANOVA and Tukey’s post hoc test (*P < 0.05, n = 15 mice analyzed of three independent experi-ments). (D) The images exemplify the lungs of WT and CFTR-KO mice stained with hematoxylin and eosin (H&E), pretreated 1 hour before infection with KB-R7943 and vehicle. Scale bars, 250 m (I, IV, VII, and X) and 500 m (II, III, V, VI, VIII, IX, XI, and XII). (E) Graphs summarize histological scoring of global inflammation grading based on H&E staining (n = 15 of independent experiments). Data were analyzed by Student’s t test used for indicated comparisons and by two-way ANOVA and Tukey’s post hoc test (**P < 0.01). (F) (I) Immunoblots show NLRP3 and LC3 expression in murine WT and CFTR-KO lung homogenates after P. aeruginosa infection. The samples were probed on immunoblots for NLRP3, LC3, and actin as a loading control. Bar chart shows the ratio NLRP3/actin (II) and ratio LC3-II/LC3-I (III) following quantification of signals from immunoblots (n =9 to 12). Student’s t test was used for indicated comparisons (*P < 0.05 and **P < 0.01). (G) The levels of released IL-1 (I) and IL-18 (II) were measured in BALF of WT and CFTR-KO mice exposed to P. aeruginosa infection, treated with KB-R7943 (300 g/kg) and vehicle. The data were analyzed by two-way ANOVA and Tukey’s post hoc test (*P < 0.05 and **P < 0.01; n = 25 of independent experiments).
on May 13, 2020
http://advances.sciencemag.org/
703.3 ± 150.3 pg/ml (CFTR-KO)] and in plasma [194.3 ± 87.3 pg/ml (WT) versus 173.9 ± 56.8 pg/ml (CFTR-KO)], confirming that it is a permeable and stable drug (fig. S9A).
To define the therapeutic effect of KB-R7943 in CFTR-KO and WT mice, we measured the survival, bacterial burden, and inflam-matory response. Survival of CFTR-KO mice after P. aeruginosa infection was significantly improved by KB-R7943 treatment [80% (vehicle) versus 100% (KB-R7943)] (Fig. 6A). In addition, KB-R7943 treatment of CFTR-KO mice led to significantly increased clearance of P. aeruginosa infection both in the lung and BALF (Fig. 6B), with significant decrease of bacterial burden (Fig. 6C and fig. S9B) com-pared to vehicle. Differently, both KB-R7943 and vehicle-treated WT mice survived to infection and did not show differences in bacterial clearance (Fig. 6B) or bacterial burden (Fig. 6C and fig. S9B). These results show that KB-R7943 impacts on a better health status and
P. aeruginosa infection in CFTR-KO mice.
Lung histopathology and the degree of inflammation were in-vestigated by scoring global inflammatory response, extension, and type in tissue sections of murine lungs stained with hematoxylin and eosin (H&E) (Fig. 6, D and E, and fig. S8, C and D). In CFTR-KO and, in part, in WT mice, P. aeruginosa infection favored the diffu-sion of a massive exudate in lungs (Fig. 6D, I and VII), with a large involvement of alveolar spaces and broncho-bronchiolar lumina that markedly reduced the aerate areas (Fig. 6D, II, III, VIII, and IX). KB-R7943 treatment reduced the inflammatory status in CFTR-KO lungs. A marked reduction of the inflammatory cells in alveoli and deep airways was documented (Fig. 6D, IV, V, VI, X, XI, and XII) in KB-R7943–treated mice compared to vehicle. Moreover, P. aeruginosa infection significantly increased histological inflammation scores, which were diminished when the animals were pretreated with KB-R7943 (Fig. 6E and fig. S9, C and D).
In vivo, the pretreatment with KB-R7943 in CFTR-KO mice re-duced NLRP3 inflammasome expression in the lung homogenates after infection to levels detected in ctrl WT mice, thus preventing the P. aeruginosa–triggered NLRP3 inflammasome priming observed in vehicle-treated CFTR-KO mice (Fig. 6F). In line with the data in vitro, the higher LC3-II/LC3-I ratio in KB-R7943–treated CFTR-KO mice than in vehicle-treated CFTR-KO mice confirmed the recovery of autophagy in vivo (Fig. 6F).
Last, the efficacy of KB-R7943 on the exacerbated P. aeruginosa– triggered inflammation in CF was confirmed by the reduced IL-1 and IL-18 levels detected in BALF of treated CFTR-KO mice (Fig. 6G). Conversely, no significant differences in inflammatory cells and tumor necrosis factor– (TNF) levels between KB-R7943 and vehicle-treated mice were detected (fig. S9, E and F), suggesting that the “first proinflammatory signal,” or Toll-like receptor signaling, in both lungs is unchanged with the drug treatment. The reduction of released cytokines in BALF is due to rectified autophagy and escaped P. aeruginosa–dependent mitochondrial dysfunction, avoiding
thus abnormal UPRmt and NLRP3 inflammasome activation in
KB-R7943–treated CFTR-KO mice.
DISCUSSION
The excessive inflammatory response due to chronic airway infec-tion by P. aeruginosa plays a critical role in the CF lung pathology and disease progression. Within the innovative CF therapy pipeline, including CFTR “correctors” and “potentiators,” effective and alter-native anti-inflammatory drugs are lacking. CFTR correctors and
potentiators have garnered much attention in the CF community, although their impact on downstream consequences, such as in-flammation, has been debated. Evidence shows that P. aeruginosa burden decreased in the first 6 months of modulator therapy but rebounded thereafter, increasing the inflammatory response (36).
A number of bacterial pathogens perturb mitochondrial func-tion to promote proliferafunc-tion and infecfunc-tion, such as P. aeruginosa. Conversely, mitochondria present different roles in resistance against bacterial infection, including mitochondrial ROS production and inflammasome activation (37, 38), and protective roles, such as
mitophagy and UPRmt (8, 39).
Previous data showed that CFTR-defective bronchial cells have increased intracellular [Ca2+] associated to increased susceptibility to pathogen-dependent mitochondrial dysfunction (7). The perturbed
Ca2+ homeostasis in patients with CF underlies the compromising
mechanisms of mitochondrial stress response and quality control
pathways. The prolonged and abnormal UPRmt activation is the
negative consequence of the down-regulation of selective autophagic response in CF, which leads to an increase in pathogen survival, resulting in enhanced innate immune and mitochondrial-protective gene expression (40) and, ultimately, worsen pulmonary inflamma-tion (Fig. 3).
During infection, the interactions between ER and mitochondria change to sustain a range of physiological processes. This structural perturbation is proposed to represent a physiological response of the cell to altered mitochondrial bioenergetics during infection
be-cause mitochondria require Ca2+ for efficient production of ATP
(41). ER-mitochondria interactions arise as a result of ER-resident VAPB closely associated with mitochondrial protein PTPIP51, enabling ER membrane recruitment to mitochondria. Here, we re-ported that P. aeruginosa–induced VAPB-PTPIP51 tether regulates autophagy in CF bronchial cells. The increase of VAPB and PTPIP51 expression triggered by bacterial infection in CF bronchial cells induces tightening of the tether and concomitant impairment of autophagy (Figs. 1 and 2). We also demonstrated that blocking the
ER-mitochondria Ca2+ exchange via MCU-targeted short hairpin
RNA (shRNA) or pharmacological inhibition, by KB-R7943, abro-gates the effects of VAPB and PTPIP51 on autophagy in CF cells during bacterial infection (Figs. 4 and 5). Our findings are in line with a large number of studies that show that perturbation of Ca2+ delivery
to mitochondria stimulates autophagy and mitophagy (11, 42, 43). Our discoveries about the regulation of mitophagy and UPRmt in
CF during P. aeruginosa infection have suggested a therapeutic strategy to promote the overall health of the mitochondrial network to limit the CF lung disease progression and bacterial infection. Consistent with the ability of KB-R7943 to reduce CF pulmonary inflammation, the promotion of autophagy appeared to contribute to the protective activity of KB-R7943.
Our findings qualify KB-R7943 as a mitochondrial Ca2+
regula-tor that rectifies unbalanced autophagic activity controlling UPRmt
and NLRP3 inflammasome activation, known to contribute significantly to pathologic airway inflammation in CF (7). The cross-regulation between autophagy and inflammasomes may also explain the ability of KB-R7943 to limit P. aeruginosa–triggered NLRP3 inflammasome priming in the lungs of CFTR-KO mice in vivo (Fig. 6) (44, 45).
According to our study, mitochondrial Ca2+ regulators have
emerged as a new option for CF therapy in controlling inflamma-tion and bacterial infecinflamma-tion. Currently, there are two specific MCU inhibitors, ruthenium red and Ru360, which are known to be
on May 13, 2020
http://advances.sciencemag.org/