ISSN 2091-2730
Wavelet Analysis of Meteorological Data Collected by an Automated
Microcontroller-Weather Station System
Maria Teresa Caccamo, Antonio Cannuli, Salvatore Magazù
Dipartimento di Scienze Matematiche e Informatiche, Scienze Fisiche e Scienze della Terra, Messina University, Messina, Italy, Email: [email protected], +390906765025
Abstract —
The present paper reports the findings obtained through a wavelet analysis, applied to meteorological data collected by means of a LSI-LASTEM weather-station, connected to a microcontroller. For the data collection, the station was located at the Polo Papardo of Messina University (38° 15’ 35.10’’ N latitude and 15° 35’ 58.86’’ E longitude), while a multi-scale wavelet approach was employed for the data analysis. The first part of the work is addressed to the data acquisition system description, which also includes the sensors and the remote microcontroller. Then, the wavelet protocol is introduced and applied by means of both continuous and discrete wavelet transforms; this method provides a time frequency representation of the analyzed signals, capable of highlighting the correlation among the registered meteorological parameters. The analysis through the evaluated wavelet scalograms shows that for all the months a positive correlation between maximum temperature and minimum temperature exists whereas, contrarily to what in most cases occurs, a constant negative correlation exists between daily rainfall and maximum temperature as well as daily rainfall and minimum temperature.Keywords
— Weather monitoring, Automatic weather station, Meteorological parameters, Weather meters, Weather analysis, Continuous and Discrete wavelet transforms, Wavelet data analysis.INTRODUCTION
An automated weather station is a meteorological device, which is able to collect climatic data and through a specific microcontroller to register and to send them to a remote control system. It is often used to satisfy several needs ranging from simple weather monitoring to data acquisition addressed to model development for weather forecasts, to support air pollution analyses and to provide useful information in many fields such as, for example, agriculture, renewable energy and building automation [1]. As a rule, it is possible to classify such devices into two different groups: weather stations that provide data in real-time and others, classified as offline, that do not record data in real-time. A real-time weather station can provide data to users at programmed times, in emergency conditions so allowing to monitor possible critical warning states such as storms, river or tide levels on particular requests. An offline station records data on internal or external data storage devices, or on a website. Accuracy and specifications should adhere to the standards of the World Meteorological Organization (WMO) [2]. In the present work, the meteorological physical parameters collected by a meteorological station sat at Messina University are analyzed by means of both Discrete Wavelet Transform (DWT) and Continue Wavelet Transform (CWT). In particular, the analyzed quantities are the maximum and minimum temperatures and the total daily rainfall for the three years: 2012, 2013 and 2014. As we shall see, the analysis shows that a positive correlation between maximum temperature and minimum temperature exists whereas a negative correlation exists between daily rainfall and maximum temperature as well as daily rainfall and minimum temperature [3]. The obtained findings are discussed in the framework of current theories.
DATA
ACQUISITION
SYSTEM
The data acquisition system is a LSI LASTEM weather station able to capture typical meteorological parameters such as temperature, relative humidity, wind speed, wind direction, barometric pressure, solar radiation and rainfall [4]. Such a station is integrated by a microcontroller for the remote connection. It is well known that, as far as sensors are concerned, they can be classified as analogue, digital and intelligent depending on their output characteristics: in analog sensors, the output is commonly in the form of voltage, current, charge, resistance or capacitance and signal conditioning converts these basic signals into voltage signals; digital sensors contain the signal in a bit or bit group and sensors with pulse or frequency output; finally intelligent sensors or transducers include a microprocessor performing basic data acquisition and processing functions and provide an output in serial digital or parallel form [5]. The employed weather station consists of a 12 inputs data logger, a sensors kit and a software for acquisition programming and data transfer. Each component is specifically designed for long-term operation in extreme conditions. The heart of the system is the data logger in which the values are stored. The data logger is housed within an IP65 box, together with a barometer, data communication systems and power supply. The E-Log data logger, whose characteristics are reported in Table 1, allows the signals acquisition from the meteorological sensors, the processing and the storing of statistical values and the typical calculations of the weather applications with a particularly low power consumption. Different types of communications equipment are possible, such as GPRS or TCP/IP;
ISSN 2091-2730
these can be used to data transfer on the LSI LASTEM web application, where it is possible to view the latest measurement values, to download and produce reports at any time and from any platform. The system is also equipped by standard MODBUS or TTY serial outputs to connect the weather station to other devices (see Fig.1). In our case, the station is remotely connected via microcontroller [6]. The results will be a series of observations which are representative over limited area and which can be analyzed through multiresolution approaches such as those offered by wavelet methods. In the recent years, the wavelet analysis methods have become a useful and a powerful tool for characterizing the variations, the periodicities, the trends of a time series of meteorological
parameters.
Fig. 1: Type and communications protocols scheme
ISSN 2091-2730
Weather meters consist of a wind speed meter, a direction meter, a thermo-hygrometer, a barometer, a radiation sensor, a rain gauge and an atmospheric pressure sensor. The speed wind meter is a DNA202 sensor, characterized by compact size and a robust structure and of rotor and it is suitable to acquire low and high speeds up to 75 m/s. The sensing element is a high efficiency and durability relay-reed. The sensor body is made of anodized aluminum, while the rotor is made of carbon fiber reinforced. The direction wind meter is a DNA212 sensor; it is very compact, sturdy and suitable both in very low and strong wind conditions; it is up to durability applications without maintenance. The measuring element is a Hall Effect transducer and the sensor body is composed of anodized aluminum. The above two sensors are completed of a cable L= 3m with connector IP65. The thermos-hygrometer is a temperature and relative humidity sensor. It is specifically dedicated to meteorological applications where there may be rapid thermo-hygrometric variations and there may be long periods of hygrometric saturation. An anti-radiation shield protects the sensor from solar radiation by ensuring the best accuracy of the temperature measurement. The sensor used to measure barometric pressure has an accuracy of 1hPa; it is housed in the same box (IP65), where the data logger is fit. The sensor for the solar radiation measurement obeys the requirements of Class 2 of the standard ISO9060 and specific WMO No. 8; it is lightweight and compact. The rain gauge is characterized by an exterior part of anodized aluminum. The measurement system consists of a collector cone and a teeter connected to a magnet, which activates a reed relay, each teeter corresponds to 0.2 mm of rain. The rain gauge is mounted on a base positioned on a flat surface. Power supply is a key component of this system, because a continuous power supply is necessary to make the system work continuously. A rechargeable battery is connected with a solar panel. The software used to configure the data logger, diagnostic and data download is 3DOM. It allows to import and export configurations through serial cable to connect the E-log to a PC. The results will be a series of observations, which are representative over limited area which can be analyzed through multiresolution approaches such as that offered by the wavelet method.
RESULTS
AND
DISCUSSION
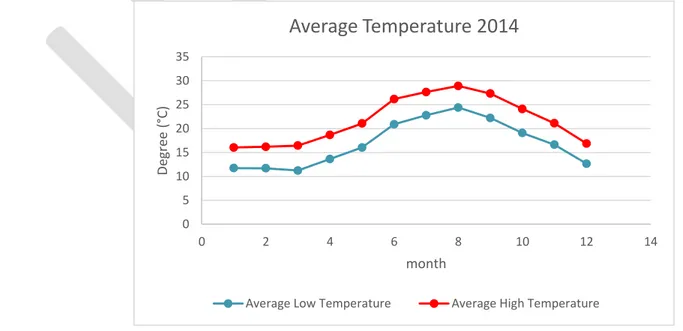
It’s well known that wavelet transforms are a powerful tool for approaching complex problems in various fields such as engineering, mathematics, physics, meteorology and spectroscopic data analyses [7-12]. From a general viewpoint the wavelet analysis allows to decompose a signal into its wavelets component, highlighting the correlation between the primitive signal and the set of the scaled and translated mother functions; furthermore wavelet analysis, in respect to Fourier transform, shows which frequencies are present and where, or at what scale, they are; finally wavelets are also widely employed for the compression or de-noising of a signal, often without appreciable degradation. In order to analyze the meteorological parameters collected by means of a meteorological station, located at 38° 15’ 35.10’’ N latitude and 15° 35’ 58.86’’ E longitude, i.e. Messina University, both Discrete Wavelet Transform (DWT) and Continue Wavelet Transform (CWT) were applied. The registered meteorological quantities are maximum temperature, minimum temperature and total daily rainfall, for a period of three years between 2012 and 2014. Following the Köppen-Geiger classification, Messina has a Mediterranean climate with dry hot summers and mild winter; in particular, summers are dry and hot due to the domination of subtropical high-pressure systems while winters experience moderate temperatures and changeable, rainy weather due to the polar front and the annual mean temperature is 21, 71°C. In Fig. 2, the average of low temperature and the average of high temperature for the year 2014 are reported. As can be seen, the warmest months are July and August, with a value of 27,63°C and 28,90° respectively, on the other hands, the coolest months are January (11,72 °C) and February (11,69 °C).
Fig. 2: Average low temperature and average high temperature for the year 2014 0 5 10 15 20 25 30 35 0 2 4 6 8 10 12 14 De gre e (° C) month
Average Temperature 2014
ISSN 2091-2730
In Fig. 3, the annual rainfall for Messina in the year 2014 is shown. It can be seen that total annual precipitation averages 843.8 mm (33.2 inches) and the most rainfall is seen in January, November and December. November is the wettest month and August is the driest month.
Fig. 3: Rainfall for the year 2014
As far as DWT is concerned, Daubechies (Db) wavelets, introduced by Ingrid Daubechies [13-14] were taken into account. It is well known that Db wavelet allows to split the investigated meteorological parameters into approximation coefficients, which correspond to the signal’s low frequency components and into detail coefficients that represent the signal’s high-frequency counterpart. In Figg. 4-6 the decomposition of maximum temperature, minimum temperature and total daily rainfall, as obtained by means of Daubechies transform at level 5 (Db5), using MATLAB Wavelets Toolbox, are shown. Such an analysis parameter set has been chosen in order to guarantee a good enough approximation coefficient a5 which is connected to the general parameter trends, i.e. on a large time scale, whereas the detailed coefficients give account of the parameter variation on a short time scale [15]. In the Figg. 4-6 the first row represents the input investigated signal; the second raw reports the approximation coefficient: a5 for db5, while d1, d2, d3, d4 and d5 correspond to detail coefficients for five different levels.
ISSN 2091-2730
Fig. 5: Decomposition of minimum temperature data by means of the mother wavelet Daubechies at level 5
Fig. 6: Decomposition of rainfall data by means of the mother wavelet Daubechies at level 5
The analysis, performed by means of DWT, shows, through the evaluated approximation coefficients, i.e. a5, of the two quantities, i.e. the maximum and minimum temperatures, and the detail coefficients, i.e. d1d5 , that, for each x-axis partition (i.e. time windows), a positive correlation between maximum temperature and minimum temperature exists for all the years, since a similar behavior is registered for such quantities; in particular the approximation and the detail coefficients as a function of time are in most the cases each other in phase. On the contrary, the evaluated approximation coefficients of the maximum and minimum temperatures and of the daily rainfall parameter, and the detail coefficients, for each time windows shows that a negative correlation (opposite correlation) exists between daily rainfall and maximum temperature as well as daily rainfall and minimum temperature; in fact the approximation and the detail coefficients as a function of time are in most the cases each other out-of-phase.
As far as CWT is concerned, the Mexican hat wavelet [16], whose name is due to the shape of the function that is like an upside-down Mexican hat, has been considered:
( )
√ ( ) ( )
Its form represents the second derivative of a Gaussian function (
). In Figg. 7-9 the Mexican Hat wavelet transforms for the maximum temperature, minimum temperature and total daily rainfall are shown. In particular, on the top of the figure the investigated signal is reported; in the second raw, the scalogram is shown. In the third row the daily variation of coefficients is reported and, finally, at the bottom figure, one finds the local maximum of the analyzed meteorological parameters; in all the figures the horizontal axis represents the number of days while the vertical axis shows the frequency values. From such an analysis, in respect to the
ISSN 2091-2730
previous approach, it is possible to better appreciate the parameter variations both on an intermediate and on a fine time scales where a strong positive correlation between the two extreme temperatures is observed whereas the daily rainfall parameter emerges at low scale, i.e. fine time window, suggesting that it influences both the extreme temperature with a negative correlation [17-18].
Fig. 7: Mexican hat Continuous Wavelet analysis of Maximum Temperature
ISSN 2091-2730
Fig. 9: Mexican hat Continuous Wavelet analysis of Rainfall
The analysis, performed by means of CWT, confirms, through the evaluated wavelet scalograms (second row), coefficient profiles values (third row) and local maxima (forth row) that a positive correlation between maximum temperature and minimum temperature exists for all the years, since a similar behavior is registered for such quantities. From a general point of view, a negative correlation is most frequent in summers, while negative and positive correlation appear about equally in other seasons. On the contrary, the same quantities reveal that a negative correlation exists between daily rainfall and maximum temperature as well as daily rainfall and minimum temperature all over the year.
CONCLUSION
In present work the results obtained by means of DWT and CWT to data collected by means of the LSI-LASTEM automatic weather station are reported. In particular, the weather station was interconnected to a microcontroller for the remote connection and was able to monitor weather and environmental parameters. The data acquisition system, the employed sensors and the remote connection microcontroller are described in the first section of the paper while, in the second part a wavelet approach, addressed to analyze the collected data series, is applied. From the analysis, it emerges that the maximum and minimum temperature parameters show a positive correlation for all the investigated years whereas a negative correlation is registered between rainfall and maximum temperature as well as rainfall and minimum temperature.
R
EFERENCES[1] G. Booch, C. Robert, M. and J. Newkirk “Case Study: Weather Station.” In Object Oriented Analysis and Design with Applications, 2d. ed. (1998) 59-112.
[2] “Geneva: World Meteorological Organization Geneva: World Meteorological Organization” Measurements at Automatic Weather Stations, WMO-No. 8, 2nd ed., (2010).
[3] K. M Lau, H. Weng, “Climate signal detection using wavelet transform: how to make a time series sing”, Bulletin of the American Meteorology Society, 76 (1995) 2391-2406.
[4] G. Hoogenboom, D.D Gresham, “Auto weather station network “, Proceeding of the 1997 Georgia water resource Conference. Athens, vol.1 (1997) 483-486.
[5] K. Montgomery, K. Chiang, “A New Paradigm for Integrated Environmental Monitoring”, ACM International Conference Proceeding Series (2010).
[6] Y. Zhengtong, Z. Wenfeng, “The research of environmental pollution examination system based on the Cloud Computing”, International Conference on Communication Software and Networks, (2011) 514-516.
[7] S. Magazù, F. Migliardo, M.T. Caccamo, “Innovative Wavelet Protocols in Analyzing Elastic Incoherent Neutron Scattering”, J.Phys. Chem. B, 116 (2012) 9417-9423.
ISSN 2091-2730
[8] S. Magazù, F. Migliardo, B.G. Vertessy, M.T. Caccamo, “Investigations of Homologous Disaccharides by Elastic Incoherent Neutron Scattering and Wavelet Multiresolution Analysis” Chemical Physics. Chem. Phys, 424 (2013) 56-61.
[9] F. Migliardo, M.T. Caccamo, S. Magazù, “Elastic Incoherent Neutron Scatterings Wavevector and Thermal Analysis on Glass-forming Homologous Disaccharides” Journal of Non Crystalline Solids, 378 (2013) 144–151.
[10] F. Migliardo, M.T. Caccamo, S. Magazù, “Thermal Analysis on Bioprotectant Disaccharides by Elastic Incoherent Neutron Scattering” Food Biophysics, 9 (2014) 99-104.
[11] S. Magazù, F. Migliardo, M.T. Caccamo, “Upgrading of Resolution Elastic Neutron Scattering (RENS)”, Advances in Materials Science and Engineering, 2013 (2013) 1-7.
[12] F. Migliardo, M.T. Caccamo, S. Magazù, “Innovative Signal Processing of Neutron Scattering Data through Multiresolution Wavelet Approach”, International Journal of Advanced Computer Science & Application, 5 (2014) 50-53.
[13] Ingrid Daubechies, “Ten Lectures on Wavelets”, Society for Industrial and Applied Mathematics. Beijing, 2004.
[14] Ingrid Daubechies, “The wavelet transforms time-frequency localization and signal analysis”, Society for Industrial and Applied Mathematics. Beijing, 2004.
[15] S. G. Mallat, “A theory for multiresolution signal decomposition: the wavelet representation”, IEEE Transactions on Pattern Analysis., 2 (1989) 674-693.
[16] Enders A. Robinson and Sven Treitel, “Geophysical Signal Analysis”, Prentice-Hall, New Jersey, 1980.
[17] P. Kumar, E. Foufoula-Georgiou, “Wavelet analysis for geophysical applications”, Reviews of Geophysics, 35 (1997) 385-412. [18] R. Bhardwaj, “Wavelet & Correlation Analysis of Weateher Data”, International Journal of Current Engineering and Technology, 2 (2012) 178-183.