Edited by: Sonia Yeh, Chalmers University of Technology, Sweden Reviewed by: Joachim Schleich, Grenoble Ecole de Management, France Daniel Huppmann, International Institute for Applied Systems Analysis, Austria
*Correspondence: Simone Borghesi [email protected]
Specialty section: This article was submitted to Energy Systems and Policy, a section of the journal Frontiers in Energy Research Received: 25 February 2016 Accepted: 01 July 2016 Published: 29 July 2016 Citation: Borghesi S and Montini M (2016) The Best (and Worst) of GHG Emission Trading Systems: Comparing the EU ETS with Its Followers. Front. Energy Res. 4:27. doi: 10.3389/fenrg.2016.00027
The Best (and worst) of GHG emission
Trading Systems: Comparing the
eU eTS with its Followers
Simone Borghesi* and Massimiliano MontiniUniversity of Siena, Siena, Italy
The European Emission Trading System (EU ETS) is generally considered as the prototype system for the other Emission Trading Systems (ETSs) for the reduction of greenhouse gases (GHGs) that are rapidly spreading around the world. To get a deeper understanding on the actual capacity of the EU ETS to stand as a model for the other ETSs, the present paper discusses the differences and similarities of the EU ETS with respect to the other main ETSs and the emerging trends that these systems seem to share, comparing the different cap-and-trade regimes in order to identify the best practices and the desirable features that future ETSs should have. As emerges from the comparative analysis performed in this article, although the followers share some common flaws with the EU ETS, they have also shown the capacity to innovate and possibly devise alternative ways to manage their own ETS regimes, which may in the long term jeopardize the EU leadership in the ETSs context.
Keywords: emission Trading Systems, eU eTS, California cap-and-trade system, Regional Greenhouse Gas initiative, Quebec cap-and-trade system, Chinese eTS pilots, comparative analysis
iNTRODUCTiON
Emission Trading is generally regarded as the main application of market-based instruments to environmental issues. Emission Trading Systems (ETSs) have been extensively applied since the 1970s to solve many air and water problems (see below). In recent years, particular attention has been devoted to the European Union Emissions Trading System (EU ETS) to reduce climate change. A large body of the literature has investigated the properties of this system from a legal, economic, and institutional viewpoint (see Grubb and Neuhoff, 2006; Tietenberg, 2006; Ellerman et al., 2007;
Kruger et al., 2007; Freestone and Streck, 2009; Grubb, 2009; Tuerk et al., 2009; Convery et al.,
2010; Ellerman, 2010; OECD, 2011; Olmstead and Stavins, 2012; Burtraw et al., 2013; Delbeke
and Vis, 2015), while other studies have investigated its environmental effectiveness (cf., for
exam-ple, Anderson and Di Maria, 2011; Rogge et al., 2011a,b; Germà and Stephan, 2015; Calel and
Dechezleprêtre, 2016). Following the introduction of the EU ETS, several other ETSs have been
implemented around the world to reduce greenhouse gas (GHG) emissions.
The aim of this paper is to emphasize the main lessons learnt and the emerging trends of the EU ETS as well as of other relevant ETS regimes, comparing the different systems in order to identify the best practices and the desirable features that future ETS should have. Other studies (e.g., Betz
and Sato, 2006; Perdan and Azapagic, 2011; Newell et al., 2013; Schmalensee and Stavins, 2015; PMR
(Partnership for Market Readiness) and ICAP (International Carbon Action Partnership), 2016) have analyzed the existing GHG ETSs pointing out the lessons that can be learnt by each of them. The present paper differs from these studies in two main respects. In the first place, while most studies
2
Borghesi and Montini Best (and Worst) of ETSs
Frontiers in Energy Research | www.frontiersin.org July 2016 | Volume 4 | Article 27
have mainly focused on the influence that the EU ETS has had on the design of the other ETSs, this work emphasizes the pos-sible existence of a mutual learning process: the EU ETS can (or should) learn from specific features of the others as much as the others have learned in this field from the European Union (EU) in the past. In the second place, it provides a comparison among existing ETSs in a historical perspective underlining the change of leadership (from US to EU) that occurred in the past and the possible new change (from EU to other, possibly linked, ETSs) that might occur in the future. This seems particularly relevant given the increasing importance that ETSs are expected to have among the climate change policies in the future.
To investigate the issue described above, the structure of the paper is the following. Section 2 briefly reviews the origin of the EU ETS in a historical perspective, which has seen the EU changing its role from follower of the early experiences in the United States (US) to forerunner at the international level in the implementation of this instrument. Section 3 discusses the main characteristics of the EU ETS as it currently stands, pointing out the lessons learnt from its implementation. Section 4 analyzes the effectiveness of the EU ETS in promoting technological innovation and in reducing GHG emissions, on the basis of the early experience provided by the first two application periods. Section 5 describes the worldwide sprawling of the ETS, look-ing in particular at some selected “followers” of the EU ETS, which seem to be quite comparable with the European proto-type, namely the Regional Greenhouse Gas Initiative (RGGI) introduced in the Eastern part of the US, and the cap-and-trade systems of California and Quebec.1 Section 6 discusses a few emerging trends that are common to the various ETSs taken into account and the current prospects for ETS cooperation and coordination in the future. Section 7 summarizes the best and worst features of the ETSs examined in the paper, drawing attention on the main positive and negative aspects that emerge from in the application experiences discussed above. The final section concludes emphasizing some important elements that can be drawn from the comparative analysis performed in the paper.
THe eU eTS: FROM FOLLOweR
TO FOReRUNNeR
Following the introduction of the Clean Air Act, in the 1970s, the first cap-and-trade systems were introduced in the USA to curb air emissions. These early experiences were so suc-cessful that other countries decided to implement their own ETSs to address various environmental problems. For instance, Australia has made extensive use of tradable allowances to reduce water pollution and consumption since the early 1990s
(Borghesi, 2013), while the United Kingdom (UK) introduced
1 A few hints will be given whenever possible also on the pilot ETSs that have been
recently implemented in China. As explained below, however, much less informa-tion is available so far on these applicainforma-tion experiences, therefore, when discussing the “followers,” we will focus mainly on the most advanced North-American experiences indicated above.
in 2002 the first broad application of a GHG trading scheme
(Smith and Swierzbinski, 2007).
The EU, on the contrary, for a long time preferred a policy approach that was more based on a “command and control” environmental regulation, at least until the 1990s, when the European Commission firstly promoted the adoption of a EU-wide carbon tax. Although this proposal was eventually abandoned, mainly because of the strong opposition of the European industrial sector, this marked an important change in the European attitude on the appropriate environmental policy instruments and in the following years the EU started to progressively shift toward a larger adoption of market-based instruments (Grubb et al., 2014).
Subsequently, the EU, following the US experience in the application of the ETS to air emissions, introduced its own ETS by Directive 2003/87/EC (2003). The EU ETS was initially applied to CO2 emissions and a few sectors only (energy activities – such as oil refineries – production and processing of ferrous metals, mineral industry, pulp, and paper industry). Later, Directive 2008/101/EC (2008) extended the scope of application of the EU ETS to the aviation sector, so that emissions produced by all flights from, to, and within the European Economic Area (i.e., the 28 EU Member States (MS), plus Iceland, Liechtenstein and Norway) should have being covered by the EU ETS, as of 2012.2 Subsequently, Directive 2009/29/EC (2009) revised the whole EU ETS scheme, further extending its scope of application to additional sectors (petrochemicals, ammonia, aluminum) and gases (N2O and PFCs).
The progressive change of the environmental policy strategy adopted by the EU has eventually led the EU to overtake the US in the use of the ETS as the main policy tool. Indeed, while the EU kept on extending the EU ETS up to its present record dimensions, in the US ETSs for GHGs are applied only in some regions (i.e., California and some of the Northeast and Mid-Atlantic States) and not to the US as a whole.3 As a consequence, the EU and the US ended up inverting their positions in the 2 However, the EU ETS requirements were provisionally suspended in 2012 for
flights to and from non-European countries, by means of the so-called “stop-the-clock-decision.” This was mainly done to allow negotiations in the context of the International Civil Aviation Organization (ICAO) on a possible global market-based measure applying to aviation emissions. The suspension measures were renewed also for the period 2013–2016, so that, practically, so far only emissions produced by (internal) flights occurring within the European Economic Area fall under the EU ETS.
3 In August 2015, the Environmental Protection Agency (2015) adopted the Clean
Power Plan (CPP) that for the first time sets federal limits on carbon emissions, with a view to reduce emissions from power plants by 32% in 2030, as compared to 2005 levels. The CPP imposes specific and differentiated targets to each of the US States, leaving them a certain margin of discretion on how to reduce their emissions and on developing their own national plan to meet the assigned target. As some authors have underlined, the CPP “enables and encourages state-level and multi-state emissions trading” (Schmalensee and Stavins, 2015, p. 16). However, despite the broad support enjoyed in many States, the CPP also has several opponents and it has been subject to a legal challenge. Pending a decision on the merits of the case, in February 2016 the US Supreme Court provisionally suspended the enforcement of the CPP (Goldenberg, 2016). This might cause a long delay in the planned shift towards cleaner energy and in the progressive decarbonisation of the US electricity production sector.
international arena: the EU passed from follower to forerunner in the application of ETSs, while the opposite happened to the US.
This process was correctly described by Ellerman (2010) as a change in leadership in terms of environmental policies at a global level so that most countries, including the US itself, consider the EU ETS as a prototype to be followed in the ETS field. However, some criticalities that emerged in the functioning of the EU ETS, together with the rapid evolution of ETSs around the world, cast some doubts on the capacity of the EU to maintain its leadership and stay ahead of the chasing group in the years to come. To get a deeper understanding on this issue, in the next paragraphs we try to emphasize the main lessons learnt from the application of the EU ETS and compare it with the trends emerging in the other ETSs around the world.
THe eU eTS: FeATUReS AND PROBLeMS
The analysis of the EU ETS Directive in the first two phases of application (2005–2007 and 2008–2012)4 shows some remarkable achievements, but also a few important shortcomings.The main achievement of the EU ETS is given by the records it established, as it is so far the largest carbon market in the world and the first transboundary cap-and-trade system. In fact, the giant European market includes 31 countries (the 28 EU MS plus Iceland, Liechtenstein, Norway) and covers more than 11,000 installations. The unexpected capacity of the EU to establish such a broad system in a relatively short time is by far the most important feature that distinguishes the EU ETS from previous experiences in this field. The advantage of such a large market size goes far beyond all the other well-known theoretical advantages of an ETS system, such as the induced technological innovation, the concrete application of the “polluter pays” principle as well as the increased flexibility as compared to traditional command and control instruments. The large scope of the EU ETS market, in particular, enhances competition among the economic actors involved and broadens the possibility to find buyers for the available allowances, thus encouraging participants to pursue eco-innovation patterns aimed at increasing emissions reduc-tions. Moreover, the EU ETS has also a symbolic value, which goes beyond purely economic considerations and demonstrates the will of the EU to stand as a leader in the international envi-ronmental policy context. This leading attitude, which the EU showed in the past with regard to command and control tools, now extends to the use of market-based instruments that were once a prerogative of the US.
On the other hand, some shortcomings, which tend to weaken its effectiveness, have emerged in the implementation of the EU 4 We will focus here mainly on the first two phases of the EU ETS since few data are
currently available on the initial part of the third phase (2013–2020). Indeed, if we exclude the carbon price (which is available on a daily basis), most EU ETS-related indicators are released with a significant lag by the European Commission. For instance, information on transactions in the EU ETS are yet to be released for the year 2013 in the EU Transaction Log, the official EU registry of all transactions taking place in the EU carbon market.
ETS. More specifically, it is possible to identify three main prob-lems that have hindered the functioning of the system in the first two phases: (i) price volatility, (ii) governance problems, and (iii) monitoring problems.
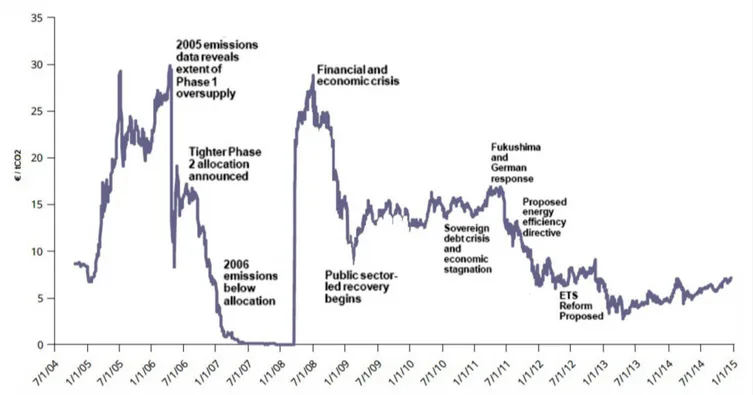
First, a high price volatility characterized the first two phases of the EU ETS (2005–2012, see Figure 1).5 The observed price volatility increased uncertainty among the firms operating on the EU ETS, which may have induced some of them to postpone costly investments in low-carbon technologies in the absence of stable market price signals (Gronwald and Ketterer, 2012; Gronwald and
Hintermann, 2015). In the initial phase (2005–2007), this price
volatility was mainly caused by an over-allocation of emission allowances. Furthermore, the latter could not be banked since the regulator wanted to keep Phase II (which coincided with the first Kyoto compliance period (CP) starting in 2008) separated from Phase I, the pilot program period. This idea, which in principle appeared a perfectly logical way of introducing a new system in a progressive way, however, had detrimental effects on the price of the allowances: spot prices collapsed basically to 0, at €0.06/ ton, by the final quarter of 2007, while contract futures prices for Phase II allowances were above €20/ton.6 In the second phase (2008–2012), price volatility was mainly due to a sharp fall in the allowances’ demand deriving from the deep economic crisis.7 Moreover, in the first two phases, the existence of an excessively decentralized system and the presence of too generic rules for the national caps contributed to further augment the oversupply problem.
This leads us to a second main problem characterizing the EU ETS, particularly in phases I and II, what can be defined as a “governance” problem. Indeed, MS initially had too much freedom in defining the national allocation plans (NAPs) for allowances. As a result, most NAPs ended up allocating too many emission allowances, mainly because of the political pressure on the Governments from interest groups who wanted to receive more allowances (Gilbert et al., 2004; Sijm, 2005). Similarly, over-allocation also characterized the second phase; in such a period, the European Commission asked MS to modify their original NAPs proposals in 11 cases of 12 (with the only exception of the UK), with the effect that the number of emis-sion allowances originally proposed by MS was greatly reduced. Moreover, the existence of too generic rules for the setting of national emission caps caused a lack of adequate stringency of 5 In Phase III, price volatility was lower than that in Phase II (the price range being
€5.84 in Phase III versus €14.36 in Phase II). Moreover, in Phase III (during the years 2013–2015), the average annual price was also lower than that in Phase II (€6.03 versus €8.12). As mentioned above, we will focus here on the first two phases that, differently from Phase III, provide complete information on all transactions details.
6 See Schleich et al. (2006) for an analysis of the implications of the EU decision
to ban banking in Phase I and of the related efficiency losses based on simulation results. See also Clò et al. (2013) for a discussion of the impact of the EUA price drop on the effectiveness of the trading scheme and on the risk of carbon lock-in that the carbon price fall can generate.
7 Koch et al. (2014) investigate the drivers of the variations of the EUA price in
Phase II and find that economic recession is a robust explanatory variable for the observed price fall, while renewable policies and the use of international credits (that are also often invoked as carbon price drivers) have had a moderate impact on the EU ETS carbon price.
FiGURe 1 | intertemporal evolution of eUA prices and major events in the period 2005–2015. Source: authors’ own elaboration based on EEA (2015).
4
Borghesi and Montini Best (and Worst) of ETSs
Frontiers in Energy Research | www.frontiersin.org July 2016 | Volume 4 | Article 27
the system. Beyond the differences concerning cap-setting, MS showed also other remarkable differences at the allocation level.8 Thus, for instance, while most MS allocated allowances for free in the initial phase, some MS (Denmark, Ireland, and Lithuania) preferred to auction a share of them to cover administrative costs. Even within the group of countries that allocated allowances for free on the basis of historical emissions (grandfathering), there were remarkable differences on how to cope with the early action problem, namely, the fact that the historic emissions criterion damaged virtuous firms that had already adopted specific measures to reduce their own emissions before the EU ETS was implemented. In this regard, Germany explicitly accounted for this aspect by using a higher compliance factor for early-moving firms, other countries (e.g., Italy) implicitly recognized early actions by using benchmarks that favored efficient allocations, whereas others (UK and Finland) granted no credits for early action simply stating that it was impossible to take it into proper account in an objective way.
National criteria differed also as far as newcomers and closures were concerned. Most MS required allowances to be returned in case of closure of an installation, but in some countries (e.g., Italy, Germany, Austria) allowances could be transferred to a new installation. As Betz et al. (2004) (p. 385) point out, this may alter competition “since by nature only incumbent firms may benefit from such allowance transfers.” As to newcomers, all countries 8 See Betz et al. (2004), Betz and Sato (2006) for an in-depth discussion of the
dif-ferent design of the NAPs across MS in the initial phase and of their consequences in terms of firms’ competitiveness.
reserved allowances for new entrants, but their share ranged widely from less than 1% of the ET-budget (in Germany, Austria, and Slovenia) to more than 20% in Latvia. Moreover, different countries adopted different kinds of benchmarking for the alloca-tion of new entrants, with some MS using best available technolo-gies as benchmark while others adopting specific emission levels for homogeneous products.
The existence of so many differences on such important aspects could severely alter competition among firms subject to the EU ETS. To address this problem, therefore, Directive 2009/29 abolished the national competence to draft allocation plans and centralized all the relevant EU ETS decision-making power in the hands of the European Commission.
A third main issue that clearly emerged in phases I and II concerned the existence of some monitoring problems and of relevant shortcomings in the functioning of the national registries in some MS. Several frauds occurred in the EU ETS market during the first two phases, which highly undermined the effectiveness of the overall EU ETS showing monitoring and transparency problems. As Frunza et al. (2011) have shown, the volume of allowances being traded in the Paris stock exchange drastically collapsed once the so-called value-added tax (VAT) fraud was discovered.9 As argued by Borghesi and Montini (2014) 9 By VAT fraud, we refer to the practice of some agents of importing allowances
VAT-free (due to the zero rate of taxation on intra-community cross-border trade) and sell them in the importing country with VAT charged and afterwards disappear instead of paying the VAT to the government. To make an example, the fraudster may buy allowances from firm A located in another EU country and then sell them in its own country to firm B charging the VAT. If the fraudster disappears without
(p. 118) “this suggests that the permit exchanges in that market were probably spurred more by the illegal activity that took place in the absence of proper regulation, rather than by the actual need to cover emissions.” Monitoring problems, however, were not limited to the VAT fraud but concerned the whole functioning of the online trading system. Thus, for instance, in November 2010 the cement-maker Holcim declared that 1.6 million emission allowances disappeared from its account in the Romanian reg-istry. The same happened in January 2011 to Blackstone Global Ventures, which declared that 475,000 emission allowances had vanished from its account in the Czech Republic, with an estimated total loss of about 7 million euros. As a consequence, many countries (the Czech Republic, Greece, Estonia, Poland, and Austria) temporarily closed their carbon trading registries and the European Commission decided to suspend spot trades (75% of the ETS market) until January 26, 2011.
To properly address these problems, the EU adopted new anti-fraud measures and a new Regulation on registry (EU Regulation 389/2013), replacing national registries with a Union Registry administered at central level by the European Commission.
On the basis of the pros and cons just shown above, even if it cannot be denied, as Ellerman rightly affirmed, that the EU ETS system is to be considered a prototype in the ETS context, this does not mean that the system was immune from relevant shortcomings, which had to be managed and solved through the years in order to increase the effectiveness of the EU cap-and-trade scheme.
Some relevant shortcomings were addressed by EU Directive 2009/29, in particular with regard to the over-allocation and surplus of EUAs. However, the amendments introduced did not solve all the problems related to the surplus of EUAs in the European carbon market, which continued to negatively affect the system and undermine its effectiveness.
In order to address such persistent problems, the European Commission proposed the back-loading initiative, which was adopted by the Council and the Parliament in 2013, with the aim of postponing auctions for 900 million allowances planned for the period 2014–2016, so as to rebalance supply and demand in the EU ETS market and reduce price volatility.10
However, the back-loading initiative was meant to represent just a temporary solution to be used during the EU ETS 3rd phase (up to 2020), and the European Commission clarified from the very beginning that a more structural EU ETS reform was neces-sary, in order to reduce the EUAs surplus and limit the related negative effects on the functioning of the European carbon
paying the VAT, when firm B reclaims the VAT from the government the Member State will suffer a loss since it has to reimburse an amount of money that it did not receive from the fraudster. This kind of fraud, that exploits the way VAT is treated within multi-jurisdictional trading, has applied to several other items in the past (e.g. microchips, mobile phones, health products, jewellery, etc.) causing relevant losses to the EU budget (cf. Frunza et al., 2011).
10 See Decision No 1359/2013/EU of the European Parliament and of the Council
of 17 December 2013 amending Directive 2003/87/EC clarifying provisions on the timing of auctions of greenhouse gas. See also Commission Regulation (EU) No. 176/2014 of 25 February 2014 amending Regulation (EU) No 1031/2010 in particular to determine the volumes of greenhouse gas emission allowances to be auctioned in 2013–2020.
market.11 For this reason, in 2014 the European Commission proposed the establishment of a market stability reserve.12 The “Proposal on the market stability reserve” was presented alongside the EU Communication on “A policy framework for climate and energy in the period from 2020 to 2030.” The market stability reserve has a twofold aim. On the one side, it aims at addressing and managing the over-allocation and surplus of EUAs described above. On the other side, it aims at increasing the resilience of the European regime, by adjusting the number of EUAs to be auctioned, depending on various market circum-stances. The market stability reserve is meant to operate in an “automatic manner,” on the basis of pre-determined criteria and conditions, which will effectively reduce the discretionary power of the Commission during its implementation, while increasing the overall transparency and effectiveness of the EU ETS. The Proposal on the market stability reserve was approved by the European Parliament on 7 July 2015 and by the Council on 6 October 2015.13 As a consequence, as stated by the Commission, “the market stability reserve shall be established in 2018 and the placing of allowances in the reserve shall operate from 1 January 2019.”14
For the time being, it is impossible to determine whether the back-loading initiative (to be relied upon in the EU ETS third phase) and the market stability reserve (to be relied upon in the EU ETS fourth phase) will be able to successfully address the shortcomings of the European carbon market described above.15 What one can certainly infer from the analysis of the price evolution reported in Figure 1 is that the debate surrounding the decision to implement a market stability reserve had only a marginal effect on the EUA price, which remained rather stable since its initial proposal by the European Commission in 2014. It should be highlighted, however, that the market stability reserve may prove a particularly contro-versial solution, especially if compared with an alternative option, namely the introduction of a price floor, which might have been chosen instead, in order to reach more or less the same objectives.
The European Commission (2012) (p. 10) argued against the
intro-duction of a price floor, claiming that the latter “would alter the very nature of the current EU ETS being a quantity-based market instrument.” According to the Commission, moreover, decisions on the appropriate price floor level would involve substantial government arrangements so that “the carbon price may become primarily a product of administrative and political decisions (or
11 For a critical discussion of the back-loading and of the other structural measures
proposed by the European Commission to reform the EU ETS see de Perthuis and Trotignon (2014). See also Caton et al. (2015) for an analysis of the implications of back-loading on carbon prices that compares the CO2 equilibrium price with and
without this policy measure.
12 See COM (2014) 20, Proposal for the establishment and operation of a market
stability reserve for the EU ETS.
13 At the moment of writing, the Decision of the European Parliament and of the
Council concerning the establishment and operation of a market stability reserve is still awaiting publication on the Official Journal of the European Union.
14 Source: European Commission, http://ec.europa.eu/clima/policies/ets/reform/
index_en.htm
15 See Kollenberg and Taschini (2016) for a theoretical model that investigates the
potential consequences of the market stability reserve mechanism using a stochas-tic partial equilibrium framework.
6
Borghesi and Montini Best (and Worst) of ETSs
Frontiers in Energy Research | www.frontiersin.org July 2016 | Volume 4 | Article 27
expectations about them), rather than a result of the interplay of market supply and demand”.
As we will see below (see The Other Main ETSs: RGGI, California, and Quebec), a price floor has been commonly adopted by some of the most relevant ETSs currently existing around the world (e.g., the US-based California and RGGI ones) where it proved to be an effective solution to avoid the price col-lapse observed instead in the EU ETS.
eFFeCTS OF THe eU eTS ON
eCO-iNNOvATiON AND
POLLUTiON ABATeMeNT
Two particularly important aspects for the assessment of the EU ETS performance concern its impact on pollution abatement and on eco-innovation (EI).16 These two issues are strictly related since the environmental effectiveness of the EU ETS (i.e., its capacity to lower GHG emissions) is heavily influenced by its capacity to induce eco-innovations through carbon pricing. The latter can promote the adoption and diffusion of environmental friendly technologies by firms that do not want to pay the costs of purchasing emission allowances and/or that wish to get a first mover advantage by shifting to a new technology before their competitors. This incentive to shift the technological paradigm obviously rises with an increase in carbon price and decreases with a higher price volatility that generates uncertainty on the expected returns of investing in EI.17
In the last few years, a growing number of studies have tried to assess the EI effects of the EU ETS.18 Two main research lines have been adopted for this purpose. Some scholars have based their empirical analyses on surveys of managerial interviews (e.g., Hoffmann, 2007; Aghion et al., 2009; Anderson et al., 2011; Martin et al., 2011; Rogge et al., 2011a,b; Schmidt et al., 2012), while others have tested the weak version of the Porter hypothesis introducing the EU ETS among the covariates of their econometric models (see Abrell et al., 2011; Borghesi
et al., 2015; Calel and Dechezleprêtre, 2016).19 Although this
literature is still in its early stages of development and mainly focused on the early phases of the EU ETS due to a time lag in the data availability, the main conclusion that seems to emerge so far is that the EU ETS had at most a very weak impact on EI. Innovative investments were probably discouraged by the high price volatility observed in the first phase and by the time initially needed to fully understand and discover the function-ing of this relatively new market. But the limited amount of 16 See Kemp (2010) for the definition of eco-innovation distinguishing between
product, process, and organisational innovations.
17 See, for instance, Popp (2002) for an empirical analysis of the innovation effects
induced by energy prices in general.
18 See Martin et al. (2015) for a review of the literature on this issue.
19 As it is well known, the so-called Porter hypothesis (Porter, 1991) argues that
environmental regulation can have positive effects on firms’ competitiveness. Such a hypothesis has been the object of two interpretations: (i) environmental regulation may trigger innovation (“weak” version of the Porter hypothesis) and (ii) induced innovation may enhance firms’ productivity (“strong” version). The aforementioned studies, therefore, focus on the weak version of the Porter assump-tion taking the EU ETS as specific example of environmental regulaassump-tion.
eco-innovations was mainly driven by relatively low emission prices that obviously provided little financial incentives to R&D and/or to the diffusion of mitigating technologies. This weak EI effect of the EU ETS seems to apply to industrial sectors both at the EU level (e.g., Schmidt et al., 2012, for the power sector) and at individual countries level, as suggested by analyses conducted on the Italian cement and ceramic industries (Borghesi et al., 2012), the German electricity sector (Hoffmann, 2007) as well as the paper industry both in Italy (Pontogolio, 2010) and in Germany (Rogge et al., 2011a,b).
While a certain consensus seems to emerge on the (weak) EI effect of the EU ETS in the first two phases, its environmental effectiveness is more controversial. As a matter of fact, it is hard to assess whether the application of the EU ETS can be considered as a main driver of the observed emission reduction or whether there exists a purely spurious correlation between the two events.
Some early studies have produced interesting results that try to address this difficult question focusing on the first EU ETS phase. Performing a counterfactual analysis, for instance,
Ellerman and Buchner (2008) estimate that in Phase I CO2
emis-sions were between 2.4 and 4.7% lower than what they would have been without the EU ETS. A similar conclusion is achieved
by Anderson and Di Maria (2011) who estimate that the emission
reduction that can be ascribed to the EU ETS was about 2.8%. Other factors, however, contributed to the emission abatement observed during the implementation of the EU ETS. In particular, an increase in average temperatures and in fuel prices has influ-enced the reduction in energy consumption and, therefore, also in EU emissions in the last few years (EEA, 2012b, 2013). These factors helped the EU go remarkably beyond the emissions reduc-tion target (−8% by 2012 as compared to 1990) that was agreed under the Kyoto Protocol. The data periodically reported by the European Environment Agency confirm a rapidly declining emis-sions trend: the overall EU27 GHG emisemis-sions were 7.7% below the 1990 levels in 2006, 11.3% below the target in 2008, 18.4% in 2011, 19.2% in 2012, and 20.7% in 2013 (EEA, 2012a, 2013, 2014a,b,c,d). This shows that the Kyoto targets was largely surpassed and that the emission reduction target for 2020 (−20%) has been achieved by the EU much earlier than originally expected.
This overall positive performance, however, hides remarkable differences within the EU between the original EU-15 countries and the new MS that joined the EU after 2004. In fact, in the new MS GHG emissions decreased by 38.5% between 1990 and 2013 as a consequence of the sharp decline of their production levels, whereas in the EU-15 emissions fell by 16.4% in the same period (EEA, 2014e).
Furthermore, the observed emissions abatement has been largely influenced by the deep economic recession that has sig-nificantly hit the European industrial production. Indeed, before the crisis, the EU-15 emissions were much above the intermediate target needed to achieve the final Kyoto target. In 2008, when the crisis started to bite, EU-15 emissions were still only 6.5% below the 1990 level (EEA, 2010; Borghesi, 2011). These considerations suggest that the economic recession and the enlargement of the EU to Central and Eastern European countries have certainly played a crucial role in helping the EU achieve the Kyoto Protocol target.
THe OTHeR MAiN eTSs: RGGi,
CALiFORNiA, AND QUeBeC
While the EU was revising and fine tuning its own ETS, on the basis of the lessons learnt in phases one and two, a wide array of other ETSs emerged around the world. Among them, we will focus in particular on three ETS regimes as they seem to be quite comparable with the EU ETS: the RGGI, the Californian cap-and-trade system, and the Quebec cap-cap-and-trade system.
Several other countries and regions started to implement their own ETS or are planning to do so in the near future, such as Japan (Sopher and Mansell, 2014a), South Korea (Park and Hong, 2014), Kazakhstan (Kossoy et al., 2015), Switzerland (Sopher and
Mansell, 2014b), New Zealand, Mexico, Brazil, and so on (Hood,
2010; Newell et al., 2013).20 Among them, particular attention
should be devoted to China that between 2013 and 2014 started implementing seven pilot projects in selected cities or provinces (Beijing, Tianjin, Shanghai, Chongqing, Guangdong, Hubei, Shenzhen) with the goal of developing a nation-wide ETS in the future (Ecofys, 2013; Jotzo et al., 2013; De Boer et al., 2015; Kossoy
et al., 2015).21 Despite the important role that these Chinese ETS
programs may have in the years to come, these pilot programs are still in their early stages and the limited data availability concern-ing their recent application prevents for the moment a proper comparison with the main ETSs examined here. For this reason, in what follows we will focus mainly on the more advanced ETS experiences of RGGI, California, and Quebec, providing information on and comparisons with the Chinese pilot ETSs whenever possible.
The RGGI is a CO2 Budget Trading Program established as a result of a Memorandum of Understanding signed in 2005 by a group of 10 USA States wishing to develop a Cap & Trade Programme covering the power sector. It started in 2009 and, although quite limited in scope, it represents the first carbon emissions Cap & Trade experience in the USA. After the withdraw of New Jersey in 2011, it currently applies to nine US States (Connecticut, Delaware, Maine, Maryland, Massachusetts, New Hampshire, New York, Rhode Island, and Vermont) and is structured in 3-year CPs, named “control periods”: 2009–2011, 2012–2014, and 2015–2017. It sets an overall multi-State-wide cap on the CO2 allowances distributed among the participating States, which allocate them to the covered installations. Currently, it applies to 168 facilities distributed in the territory of the involved States.
20 The number of carbon pricing instruments has been increasing by 90% since
2012, reaching today 38 instruments that span across 39 national jurisdictions and 23 subnational jurisdictions, covering about 12% of global GHG emissions
(Kossoy et al., 2015). A detailed analysis of all the existing ETSs goes beyond the scope and admissible length of this paper that intends to present only a selection of the most relevant ETSs. The interested reader is referred to Kossoy et al. (2015)
and PMR and ICAP (2016) for an in-depth and exhaustive description of most existing programs.
21 A national ETS is planned to start in China in 2017. However, from a survey
conducted on 304 China-based stakeholders (de Boer et al., 2015), it turns out that the vast majority of respondents expect that a national ETS will not be fully operational before 2020.
The Californian Cap & Trade System, introduced by the Global Warming Solution Act of 2006, started in 2013 and covers almost 600 facilities, corresponding to 85% of the country’s GHG emissions. It is structured upon three CPs: (1) 2013–2014; (2) 2015–2017; (3) 2018–2020. In particular, in the first period, the scheme covered only the large industry and electricity sectors; while from the second period onward, it has been extended also to fuel transport, distribution, and generation.
The Quebec cap-and-trade system was established in 2011, by the Regulation Respecting a cap-and-trade system for GHG Emission Allowances, and started in 2013. It initially covered almost 80% of Quebec’s GHG emissions, and such percent-age has increased up to 85% from 2015. It is structured upon the same three CPs as the Californian Cap & Trade System, namely: 2013–2014; 2015–2017; 2018–2020. In the first CP, the scheme covered industrial and electricity sectors only, while from the second CP onward it has been extended to fossil fuel distribution.
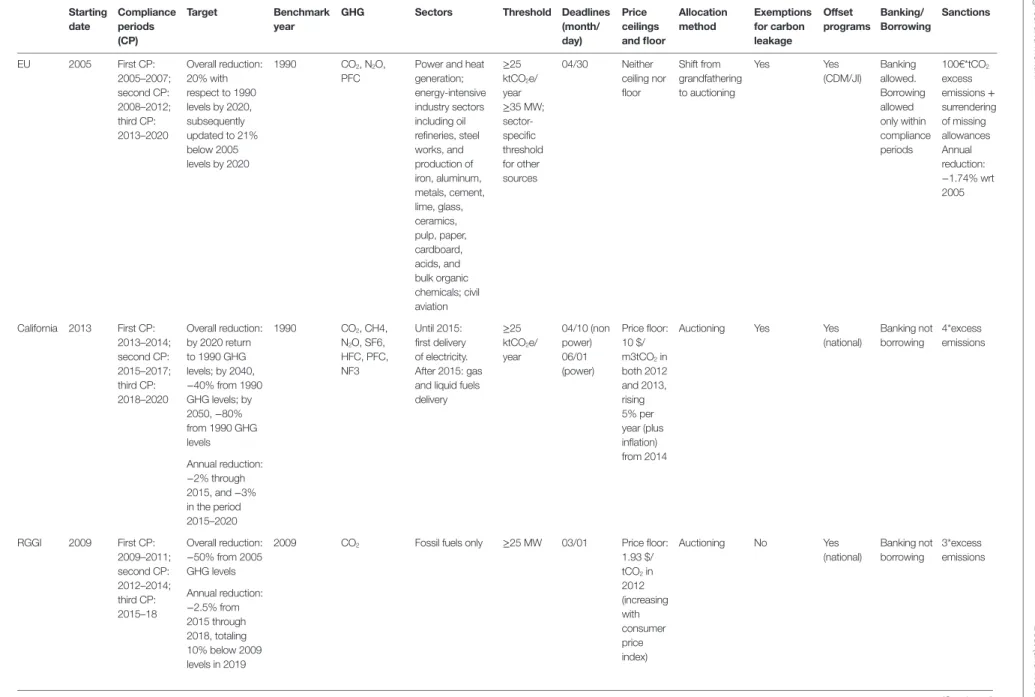
All the ETS regimes described above closely resemble the EU approach to ETS. Table 1 below provides a comparison of the selected ETSs, highlighting the most relevant aspects underlying their design and features. Table A1 in Appendix reports available information on the Chinese pilot projects focusing on the same aspects examined in Table 1 for comparability reasons. For the purpose of the comparative analysis, the EU ETS will be consid-ered as a benchmark against which the other relevant ETSs will be described and assessed.
Table 1 shows that, as far as their scope is concerned, all ETSs examined here – with the exception of RGGI – present several relevant similarities and common features.
For instance, they all cover a wide range of GHG emissions beyond CO2. In addition to that, following the European model, all the regimes analyzed establish exemptions for installations below certain similar thresholds. Furthermore, all ETSs have been divided in three CPs, although these obviously differ across the various regimes because of their different starting dates (with the exception of California and Quebec that started together and adopted the same CPs).
Moreover, all the ETSs analyzed foresee the possibilities for linking with other project-based GHG emissions offset pro-grams. For instance, the EU ETS allows the use of CO2 reduction units generated through the implementation of the project-based mechanisms foreseen under the Kyoto Protocol (Clean Development Mechanism and Joint Implementation). Following a similar approach, the RGGI, the Californian, and the Quebec cap-and-trade systems allow the use of credits produced from national offset projects carried out in specific sectors.
An additional common feature to most of the ETS analyzed refers to the possibility of applying banking and/or borrowing. In this respect, in line with the EU approach, all the three ETSs analyzed (California, RGGI, and Quebec) allow banking, but not borrowing of the allowances.22 Finally, with regard to the preferred 22 As pointed out by Newell et al. (2014), banking is widely recognized as “an
impor-tant tool to avoid short-term supply-demand imbalances and associated price movements.” See Chevallier (2012) for a survey of the banking literature. Notice that borrowing is allowed in the EU ETS only within compliance periods: indeed,
TABLe 1 | The eU eTS and the other main eTSs: a comparison. Starting date Compliance periods (CP) Target Benchmark year
GHG Sectors Threshold Deadlines (month/ day) Price ceilings and floor Allocation method exemptions for carbon leakage Offset programs Banking/ Borrowing Sanctions EU 2005 First CP: 2005–2007; second CP: 2008–2012; third CP: 2013–2020 Overall reduction: 20% with respect to 1990 levels by 2020, subsequently updated to 21% below 2005 levels by 2020 1990 CO2, N2O, PFC
Power and heat generation; energy-intensive industry sectors including oil refineries, steel works, and production of iron, aluminum, metals, cement, lime, glass, ceramics, pulp, paper, cardboard, acids, and bulk organic chemicals; civil aviation ≥25 ktCO2e/ year ≥35 MW; sector-specific threshold for other sources 04/30 Neither ceiling nor floor Shift from grandfathering to auctioning Yes Yes (CDM/JI) Banking allowed. Borrowing allowed only within compliance periods 100€*tCO2 excess emissions + surrendering of missing allowances Annual reduction: −1.74% wrt 2005 California 2013 First CP: 2013–2014; second CP: 2015–2017; third CP: 2018–2020 Overall reduction: by 2020 return to 1990 GHG levels; by 2040, −40% from 1990 GHG levels; by 2050, −80% from 1990 GHG levels 1990 CO2, CH4, N2O, SF6, HFC, PFC, NF3 Until 2015: first delivery of electricity. After 2015: gas and liquid fuels delivery ≥25 ktCO2e/ year 04/10 (non power) 06/01 (power) Price floor: 10 $/ m3tCO2 in both 2012 and 2013, rising 5% per year (plus inflation) from 2014
Auctioning Yes Yes
(national) Banking not borrowing 4*excess emissions Annual reduction: −2% through 2015, and −3% in the period 2015–2020 RGGI 2009 First CP: 2009–2011; second CP: 2012–2014; third CP: 2015–18 Overall reduction: −50% from 2005 GHG levels
2009 CO2 Fossil fuels only ≥25 MW 03/01 Price floor:
1.93 $/ tCO2 in 2012 (increasing with consumer price index) Auctioning No Yes (national) Banking not borrowing 3*excess emissions Annual reduction: −2.5% from 2015 through 2018, totaling 10% below 2009 levels in 2019 (Continued) 8
Borghesi and Montini
Best (and W
orst) of ETSs
Fr
ontiers in Energy Resear
ch | www .fr ontiersin.org July 2016 | Volume 4 | Article 27
Starting date Compliance periods (CP) Target Benchmark year GHG Sectors Thr eshold
Deadlines (month/ day) Price ceilings and floor Allocation method
e
xemptions for carbon leakage
Of fset pr ograms Banking/ Borr owing Sanctions Québec 2011
First CP: 2013–2014 second CP: 2015–2017; thir
d CP: 2018–2020 Overall r eduction: By 2020, − 20% from 1990 GHG levels. By 2030, −37.5% fr om 1990 GHG levels. By 2050, −80% or − 95% reduction fr om 1990 GHG levels 1990 CO 2 , CH4, N2 O, HFCs, PFCs, SF6
Until 2015: industrial and electricity sectors After 2015: also fossil fuel distribution
≥ 25 ktCO 2 e/ year 01/11
Price floor: 10 $/ m3tCO
2
starting in 2012 (rising 5% per year plus inflation ther
eafter) Auctioning Ye s Ye s (national)
Banking not borr
owing
3*excess emissions
Annual r
eduction:
after 2015 –4% until 2020
Source: Authors’ own elaboration.
TABL
e
1
| Continued
allocation method, a common feature shared by all the regimes taken into account is the progressive shift from grandfathering to auctioning, originally envisaged in the EU ETS.23 Such a shift generated widespread worries within the industrial community of all countries, which led everywhere to the adoption of specific provisions against the risk of delocalization of productive activi-ties toward “ETS-free countries.” In fact, in order to protect the sectors potentially exposed to carbon leakage, all the various ETS, apart from RGGI, include similar exemptions.24
Beside the common features and similarities shown above, a closer look at the ETS regimes taken into account reveals that the followers took a different path on some relevant issues with respect to the pattern set by the EU. As to the sanctioning rules, for instance, while all ETS examined foresee the obligation for non-compliant firms to surrender the missing allowances in a subsequent period, some remarkable differences apply. In fact, the EU ETS provides for the application of a fixed monetary sanc-tion of 100€ for each missing ton, whereas the RGGI, Quebec, and Californian ETSs opted for a different sanctioning regime, establishing that non-compliant firms installations have to return, respectively, three times (for RGGI and Quebec) and four times (for California) as many allowances as those not surrendered in each given period.25 The existence of different sanctioning regimes may imply large differences in the complying costs for the opera-tors being sanctioned. Just to provide an example, consider the current prices of EU ETS, RGGI, and Californian allowances.26 Given the corresponding sanction systems, a firm that emitted 50 tons in excess of the allowances at disposal would have to pay 5274.5€ in the EU ETS, 2164€ in the Californian system while only 693.3€ in the RGGI.
As far as the target setting is concerned, while Quebec has chosen the same target of the EU, corresponding to a −20% emission reduction by 2020 (as compared to 1990 levels), the US-based regimes have chosen different paths (see Table 1).
allocation for the current year takes place in February, while the deadline to sur-render allowances for emissions of the previous year is end of April. In California borrowing is allowed only under very specific and restrictive conditions (see PMR and ICAP, 2016), whereas it is never allowed in the RGGI and in the Quebec ETS.
23 Notice that progressive transition towards full auctioning is planned for the
future also in the Shenzhen ETS pilot, the first to be launched in China. At the moment, however, allowances are mainly grandfathered in all Chinese ETS pilots (see Table A1 in Appendix).
24 The existence and the entity of a carbon leakage effect induced by the
imple-mentation of environmental policies is the subject of a heated debate and of an extensive theoretical and empirical literature. See, among the others, Taylor (2004), Dean et al. (2009), Chung (2014) for analyses of the possible delocalisation effect of environmental regulation in general, Martin et al. (2014a and 2014b),
Borghesi et al. (2016a) for a discussion of the effect of the EU ETS regulation in particular.
25 The amount of the penalties and the way non-compliant firms are sanctioned
are even more diverse across the Chinese ETS pilots (see Table A1 in Appendix).
26 To perform the numerical calculation we used the €/US$ exchange rate as of 20
April 2016 and the following allowances prices taken by the data sources indicated among brackets on the same day: (i) EU ETS= 5.49€ per allowance (https:// www.eex.com/en/market-data/emission-allowances/spot-market/european-emission-allowances#!/2016/04/20); (ii) CARB: $12.29 (equivalent to 10.82€) per allowance (http://calcarbondash.org); (iii) RGGI: $5.25 (equivalent to 4.622€) per allowance (https://rggi-coats.org/eats/rggi/index.cfm?fuseaction=reportsv2. price_rpt&clearfuseattribs=true).
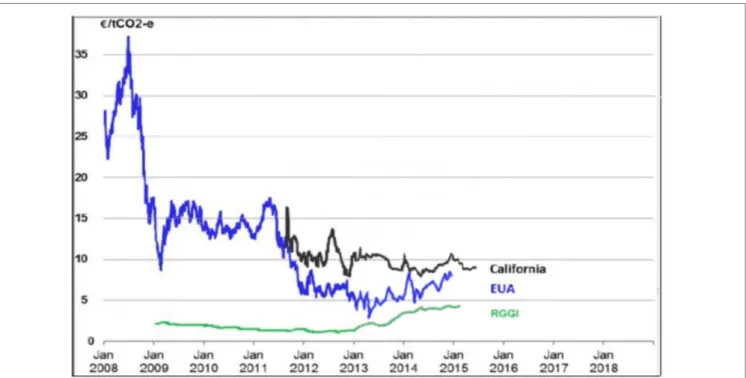
FiGURe 2 | intertemporal evolution of emission allowance prices on different eTS markets. Source: authors’ own elaboration based on EEX data (https://
www.eex.com/en#/en), CARB data (http://calcarbondash.org), and RGGI data (https://rggi-coats.org/eats/rggi/index.cfm?fuseaction=reportsv2.price_ rpt&clearfuseattribs=true).
10
Borghesi and Montini Best (and Worst) of ETSs
Frontiers in Energy Research | www.frontiersin.org July 2016 | Volume 4 | Article 27
In fact, California merely aims at returning its emissions to the 1990 levels by 2020, while RGGI has chosen a stabilization target for 2014 and a 10% reduction target for 2020 (as compared to 2009 levels). In this regard, the RGGI choice of taking a different benchmark year for its emissions reductions (2009 instead of 1990) makes the systems not fully comparable to the others, while the Californian target of returning to the 1990 level does not appear to be so stringent in absolute terms.27 However, in April 2015, the Californian Governor issued a much more ambitious target, namely, reducing GHG emissions by 40% with respect to the 1990 levels by 2030. This revised target is in line with the EU-28 target for 2030, denoting the desire to converge on common targets in the future across different ETS regimes.
A totally different approach has been adopted, instead, by China where all pilot ETSs have set their own targets in terms of emission intensity reduction (see Table A1 in Appendix). Although 27 By stringency, we refer here to the effort imposed by the regulator according
to the emission reduction target, which can be measured by the ratio of emis-sions to allocated allowances (cf. Borghesi et al., 2015). Notice, however, that the price of the emission allowances can also be seen as a proxy of regulation stringency, as it enters other measures of environmental policy stringency, such as the Pollution Abatement Cost Expenditures and the survey-based perception of stringency. In this regard, the Californian regime may look more stringent than the other two since the allowance price is currently much higher in the Californian cap-and-trade system than in the EU ETS and in the RGGI (see previous footnote for a comparison of current prices). See Brunel and Levinson (2013) and Kozluk and Zipperer (2013) for reviews of the existing measures of environmental policy stringency and a detailed discussion of their shortcomings.
abating emission intensity (i.e., emissions per unit of GDP) improves the eco-efficiency of the economic system, this is not comparable to the target of reducing total emissions that has been set by the European and North-American ETSs discussed above. Indeed, a lower emission intensity can be consistent with higher total emissions as long as the latter grow more slowly than GDP. In this sense, while the other main ETSs seem to move in the same direction toward similar or common targets, at the moment the route chosen by the Chinese government deeply departs from that of the others.
Other features of ETS regimes show remarkable differences that set the followers apart from the EU ETS. This applies in particular to the adoption of price floors and ceilings. While the EU ETS has neither a price floor, nor a price ceiling,28 a different choice has been made by the three other ETSs analyzed, which have all chosen an intermediate path, whereby a price floor, but not a price ceiling is provided.29 Having a price floor has proved to be crucially important in particular for the US-based regimes, 28 The only exception among the countries taking part to the EU ETS is represented
by the UK that in August 2013 has unilaterally introduced a price floor equal to £16 per tonne of CO2, which is expected to rise over time. The government decision
has been criticised by many commentators, for the risk that companies pass the cost on to consumer energy bills and for the competition loss that UK firms may suffer as compared to their competitors in the rest of Europe where the price floor does not apply.
29 All the three followers taken into account, however, adopt allowance price
con-tainment reserves. Such reserves represent a soft price ceiling as the government is prepared to sell a fixed amount of allowances at a given price, but do not set an absolute limit on the price (the so-called hard price cap). As PMR and ICAP (2016)
as both the RGGI and the Californian ETS allowance prices have basically hit the floor in their early stages of application. As emerges from Figure 2 – that compares the price trends of the EUAs, Californian, and RGGI carbon allowances for the period 2008–2015 – the Californian ETS has shown a price volatility that resembles the one characterizing the EU ETS, with the Californian price that has fallen down to $12.22 in August 2013 moving on a declining trend toward its floor (set at US$10/unit in 2012 and increased by 5% plus inflation rate every year). Even in the case of the flatter price trend of the RGGI, it is possible to identify a tendency of the emission price to decline toward the price floor, falling from 2.97 in 2009 to 1.96 in 2010 and tracking the floor price (US$1.86 in 2010 and US$1.89 in 2011) from September 2010 onward. During that period the share of secondary market exchange-based transactions collapsed from 85% in 2009 to 6% in 2011; therefore, the existence of a price floor prevented RGGI price from declining even further. A price floor has been intro-duced also in the province of Guangdong, which is the largest among the Chinese pilot projects and the first to use auctioning (see Table A1 in Appendix). Also in this case, available evidence confirms the tendency to hit the floor: during the first 5 months of implementation of the project (December 2013–April 2014), the average price [61.8 Chinese Yuan (CNY)] turned out to be very close to the price floor (60 Yuan) initially set by the regulator authority (World Bank, 2014). Even in Guangdong, therefore, the price floor was effective and probably helped agents progressively adapt to the introduction of the new ETS regime. In this regard, it may be argued that the followers of the EU ETS might have actually improved the functioning of their ETS with respect to the original EU model and that the introduction of a similar price floor in the EU ETS would have probably prevented the European price from collapsing.30
THe eU eTS AND iTS FOLLOweRS:
COMMON TReNDS AND LiNKiNG
PeRSPeCTiveS
The analysis performed above has shown many common features in the different ETSs, especially with regard to their scope, alloca-tion method and overall climate change goals to be achieved. As a consequence, a first trend that can be identified is that all the ETSs tend to converge to a common structure. Moreover, the ETS is recognized in all the countries analyzed as a key tool to tackle climate change (Grubb et al., 2014), though not the only one. In fact, all the countries analyzed tend to implement their respective cap-and-trade schemes along with other renewable energy and energy efficiency instruments, within the broader context of their national climate change policy.
Furthermore, another emerging trend is the provision of special, softer regimes, protecting the national industrial sector from the major risks related to the loss of competitiveness as a
(p. 113) point out, this “provides some assurance to the market, but not a guarantee, that the price will not rise above that level.”
30 For a discussion and comparison of the possible mechanisms to implement a
price floor and the related implementation pitfalls see Wood and Jotzo (2011).
consequence of the ETS obligations. All the ETSs analyzed (RGGI excluded) endorse this choice, envisaging a direct, free allocation of allowances rather than auctioning, for some exposed sectors, while requiring a rigorous identification of the sectors benefiting from these special regimes (to be determined by the law) and usually providing for these exemption regimes to be temporary.
Finally, all the ETSs analyzed foresee some possibilities of “linking” with other project-based GHG emissions offset pro-grams. For instance, the EU ETS allows installations to use Clean Development Mechanisms and Joint Implementation credits for compliance purposes. Similarly, the RGGI, the Californian, and the Quebec cap-and-trade systems allow the use of credits pro-duced from national offset projects carried out in specific sectors, although the sectors involved differ across the ETSs. Moreover, all the ETSs allowing for such types of linking solutions (i.e., allow-ing the use of “external” credits for compliance purposes within the ETS), set specific limitations in the amount or percentage of credits that can be used for that purpose, and prescribe specific conditions for the eligibility of the projects generating the offset credits. Notice that if two ETSs are unilaterally linked to an offset market it follows that they will be automatically linked to each other. In other words, unilateral linking of each ETS to common offset programs can generate indirect linking across ETSs.
Beyond this “unilateral” kind of linking, with each ETS rec-ognizing credits produced from various offset projects, another common feature that is emerging among most ETSs is their effort to establish “bilateral” linking. By this, we mean that one ETS can link to another ETS, so that both ETSs involved mutually recog-nize their allowances as eligible for compliance under either of the two programs, thus enabling a two-way flow of allowances.31 So far, the only existing example of bilateral linking in opera-tion is the one between California and Quebec, which has been established by means of an international agreement signed by the Parties in 2013. However, several other jurisdictions are cur-rently considering the conclusion of similar linking agreements. For instance, the EU had reached a preliminary agreement with Australia for a bilateral linking, to be started in 2018, but this was eventually abandoned due to Australian government’s deci-sion to repeal its ETS legislation after the 2013 elections. As a consequence, the EU is now looking for other partners for the development of bilateral linking agreements that would allow to extend the carbon market and fully exploit the increasing returns to scale that larger markets can generate. The possible emergence of some bilateral linking agreements in the near future has the potential to modify the economic equilibria among the existing ETSs in the years to come. Think, for instance, of the role that the nation-wide Chinese ETS – that is expected to emerge in the near future – would play in the international context. The giant dimen-sion of such a system would make it a very attractive partner for bilateral linkings to expand the number of potential purchasers/ sellers of one’s own allowances. A bilateral linking, moreover, would probably help the commercial relationships between the linked countries, further reinforcing the attractiveness of linking 31 See Borghesi et al. (2016b) for a discussion of the different kinds of linking and
of the necessary and optional features that ETS regimes need to have to achieve linking agreements.
12
Borghesi and Montini Best (and Worst) of ETSs
Frontiers in Energy Research | www.frontiersin.org July 2016 | Volume 4 | Article 27
to China. For these reasons, we may reasonably expect that in the years to come the main ETS regimes will fight to conquest the most attractive partners (including but not limited to China). This might jeopardize the leadership role played by the EU ETS so far, possibly transforming it from forerunner into follower again.
THe BeST AND wORST OF eTSs
The comparative analysis performed in the previous sections highlights positive and negative aspects of the ETSs, some of which are shared by most ETSs, while others represent idiosyn-cratic features of a single ETS regime. In this section, we briefly summarize these positive and negative aspects, what we some-how ironically call “the best and worst” of the ETSs, to provide a roadmap of what to preserve, extend or change in the future design of the ETSs.
One natural candidate to be introduced in the shortlist of the best features is certainly the existence of heterogeneous instal-lations, coming from different sectors and producing different GHGs. This element plays a crucial role for effective trading as it allows to exploit different marginal abatement costs. In this sense, the progressive extension to additional sectors and GHGs of the EU ETS certainly went in the right direction, while this feature might need to be further developed in other contexts, such as the RGGI that includes only power plants.
Another desirable feature that most ETSs have introduced is the phasing in of auctioning over time. While grandfathering can be initially justified by the desire to prevent a rapid increase in the costs for firms subject to a new ETS, the regulatory authority must clarify from the beginning that a free allocation of allowances can only be a temporary measure and should set a clear intertemporal path toward auctioning. This is not to say that auctioning is the panacea for all problems. Difficulties can arise also in the auc-tioning design, as is well documented in the ETS literature (e.g.,
Cramton and Kerr, 2002; Smith and Swierzbinski, 2007). In our
opinion, however, setting a clear time plan for the progressive introduction of auctioning can provide an important and credible signal that the new ETS is here to stay, which may induce firms to make plans and investments in eco-innovation in due time.
Another best practice of many ETSs (RGGI excluded) is the introduction of carbon leakage rules. The choice of adopting carbon leakage rules is somehow related to that of auctioning the allowances, though the one does not necessarily imply the other. While auctioning can reduce the risk of windfall profits that may derive from allocating allowances for free, the introduction of carbon leakage rules can lower the risk of delocalization that occurs in the case of unilateral environmental policies. Moreover, while auctioning may provoke the opposition of the industrial sector (that has to pay, differently from what happens with grandfathering), the existence carbon leakage rules can lower this opposition providing the necessary support of the industrial sector to the new instrument. These two measures, therefore, can be seen as complementary instruments that should go hand-in-hand in the design of an ETS. For carbon leakage rules to be credible, the regulator must set ex ante clear and objective criteria to identify the sectors at risk of delocalization. In this sense, the
criteria adopted by the EU and California of taking carbon inten-sity and trade exposure as criteria to exempt from auctioning the sectors at risk of relocation can certainly be useful, although they might need to be partially improved in the future.32 What is to be avoided, instead, is a continuous extension of the sectors included in the list of those at risk of relocation,33 as this would undermine the credibility of the system inducing the perception that carbon leakage provisions are just an escamotage obtained by industrial lobbies to keep receiving allowances for free.
Beyond the risk of production relocation, another kind of leakage may arise in the ETS context. Many of the ETS examined here (e.g., EU ETS and RGGI) are pure source-based cap-and-trade systems that set emission limitation on the emitting facility. This means they do not cover emissions embodied in imports from uncapped regions. In other words, to avoid the costs asso-ciated with an ETS, the economic agents can either move their production activity to countries where no ETS is in place or they can simply import goods from such countries. To overcome this problem, the best practice among existing ETSs is probably the “first-seller approach” adopted by the Californian ETS whereby responsibility is assigned to the entity that first imports power into the State’s electricity market (Hobbs et al., 2010). From this viewpoint, the Californian regime can be seen as a hybrid cap-and-trade “combining a source-based approach for in-state resources and emissions accounting for imports in order to limit emissions leakage” (Hobbs et al., 2010, p. 26).
Finally, another important provision for a well-functioning ETS may be given by the existence of de minimis rules for small installations. This provision, which is common to most existing ETSs, can be reasonably justified by the high transaction costs that small emitters (below some given threshold level) would have to face if they were exposed to the same rules as the other emitters.
Moving now to the “worst of” side, we can distinguish two main groups of problems, that is, shortcomings in the cap-setting and in the way the ETSs operated. As to the first aspect, if the cap is set too high with respect to the actual demand for allowances, this will obviously result in a low allowance price; if, instead, the cap is frequently revised (e.g., due to scientific uncertainty on the correct number of allowances to be allocated), this will contribute to increase price volatility. In our view, both a low price and a highly volatile price may constitute problems that hinder the proper functioning of the ETS. A low allowance price gives agents no incentive to abandon the old polluting technologies and invest in new environmentally friendly ones. A highly unstable price generates uncertainty on the expected returns of invest-ing in such technologies, which may discourage investments in eco-innovation.
32 As Martin et al. (2014a) have argued, the carbon intensity criterion is highly
correlated to carbon leakage while trade intensity is not. They conclude that the current exemption criteria adopted by the EU ETS should be amended to consider a sector at risk of carbon leakage only if it is both trade intensive and carbon inten-sive. See also Martin et al. (2014b) for the proposal of an efficient compensation scheme of industries at risk of relocation and for a discussion of its implications for the EU ETS.
33 See Borghesi et al. (2016b) for a complete list of all the sectors exempted from
the auctioning of allowances under the EU ETS, the Californian regime and the Quebec regime.