Edited by: José J. Pueyo, Consejo Superior de Investigaciones Científicas, Spain Reviewed by: Sara Maldonado, University of Buenos Aires, Argentina Sergey Shabala, University of Tasmania, Australia *Correspondence: Stefania Biondi [email protected]; Stefano Del Duca [email protected] †
These authors have contributed equally to this work.
Specialty section: This article was submitted to Crop Science and Horticulture, a section of the journal Frontiers in Plant Science Received: 30 December 2015 Accepted: 28 April 2016 Published: 18 May 2016 Citation: Aloisi I, Parrotta L, Ruiz KB, Landi C, Bini L, Cai G, Biondi S and Del Duca S (2016) New Insight into Quinoa Seed Quality under Salinity: Changes in Proteomic and Amino Acid Profiles, Phenolic Content, and Antioxidant Activity of Protein Extracts. Front. Plant Sci. 7:656. doi: 10.3389/fpls.2016.00656
New Insight into Quinoa Seed Quality
under Salinity: Changes in Proteomic
and Amino Acid Profiles, Phenolic
Content, and Antioxidant Activity of
Protein Extracts
Iris Aloisi1 †, Luigi Parrotta1 †, Karina B. Ruiz1, 2, Claudia Landi3, Luca Bini3,
Giampiero Cai3, Stefania Biondi1* and Stefano Del Duca1*
1Department of Biological, Geological and Environmental Sciences, University of Bologna, Bologna, Italy,2Departamento de Producción Agrícola, Universidad de Chile, Santiago, Chile,3Department of Life Sciences, University of Siena, Siena, Italy
Quinoa (Chenopodium quinoa Willd) is an ancient Andean seed-producing crop well known for its exceptional nutritional properties and resistance to adverse environmental conditions, such as salinity and drought. Seed storage proteins, amino acid composition, and bioactive compounds play a crucial role in determining the nutritional value of quinoa. Seeds harvested from three Chilean landraces of quinoa, one belonging to the salares ecotype (R49) and two to the coastal-lowlands ecotype, VI-1 and Villarrica (VR), exposed to two levels of salinity (100 and 300 mM NaCl) were used to conduct a sequential extraction of storage proteins in order to obtain fractions enriched in albumins/globulins, 11S globulin and in prolamin-like proteins. The composition of the resulting protein fractions was analyzed by one- and two-dimensional polyacrylamide gel electrophoresis. Results confirmed a high polymorphism in seed storage proteins; the two most representative genotype-specific bands of the albumin/globulin fraction were the 30- and 32-kDa bands, while the 11S globulin showed genotype-specific polymorphism for the 40- and 42-kDa bands. Spot analysis by mass spectrometry followed by in silico analyses were conducted to identify the proteins whose expression changed most significantly in response to salinity in VR. Proteins belonging to several functional categories (i.e., stress protein, metabolism, and storage) were affected by salinity. Other nutritional and functional properties, namely amino acid profiles, total polyphenol (TPC) and flavonoid (TFC) contents, and antioxidant activity (AA) of protein extracts were also analyzed. With the exception of Ala and Met in R49, all amino acids derived from protein hydrolysis were diminished in seeds from salt-treated plants, especially in landrace VI-1. By contrast, several free amino acids were unchanged or increased by salinity in R49 as compared with VR and VI-1, suggesting a greater tolerance in the salares landrace. VR had the highest TPC and AA under non-saline conditions. Salinity increased TPC in all three landraces, with the strongest increase occurring in R49, and enhanced radical scavenging capacity in R49 and VR. Overall, results show that salinity deeply altered the seed proteome and amino acid profiles and,
in general, increased the concentration of bioactive molecules and AA of protein extracts in a genotype-dependent manner.
Keywords: antioxidant activity, Chenopodium quinoa, polyphenols, salt stress, seed storage proteins
INTRODUCTION
Quinoa (Chenopodium quinoa Willd., Amaranthaceae) is an Andean seed-producing crop cultivated since ca. 7000 years around Lake Titicaca in the Andean highlands (altiplano) from where it spread as far north as Ecuador and down to southern Chile, and from 3800 m above sea level to coastal and lowlands areas. This diversification in terms of native habitats and the wide genetic diversity has led to the identification of five ecotypes: salares (salt flats), highlands, inter-Andean valleys, yungas, and coastal-lowlands. The salares of the Andes are found principally in southern Bolivia, northern Chile, and Argentina. These highland deserts are extremely arid; temperatures often fall well below freezing and quinoa is the only crop that can grow under these edapho-climatic conditions (Fuentes et al., 2009). Other landraces (local varieties) are adapted to totally different environments. For example, in central and southern Chile, quinoa can grow at sea level; here annual rainfall, distributed throughout the year, ranges from 400 to 1500–2000 mm and soils have a high water retention capacity. Thus, quinoa has attracted the attention of scientists since over a decade mainly for its extreme tolerance and adaptability to unfavorable environmental conditions, such as salinity, drought, and frost (Jacobsen et al., 2003). However, different accessions, landraces, and cultivars of quinoa have been shown to exhibit different degrees of tolerance to abiotic, in particular salt stress (Gómez-Pando et al., 2010; Adolf et al., 2012; Peterson and Murphy, 2015).
Consumption of seeds is the most common use of quinoa, which is, therefore, considered a “cereal-like” crop. European and North American consumers are increasingly aware of the exceptional nutritional qualities of quinoa seeds that, together with sprouts, are now considered “functional foods” ( Vega-Gálvez et al., 2010). This is because seeds have high protein content and contain all the essential amino acids (Abugoch et al., 2008). In quinoa seeds, protein and lipid reserves are accumulated in embryonic protein and lipid bodies, respectively, which occupy most of the cell (Prego et al., 1998). The classification of seed storage proteins dates from the turn of the century, when Osborne (1924)classified them into groups on the basis of their extraction and solubility, convention still used nowadays for storage proteins from plant seeds in general. These proteins are soluble in water (albumins), dilute saline solution (globulins), alcohol mixtures (prolamins), and dilute acid or alkali (glutelins). The major seed storage proteins include albumins, globulins, and prolamins (Shewry et al., 1995). The main protein fractions in quinoa seeds are globulins and albumins. Brinegar and Goundan (1993)characterized the 11S storage protein, chenopodin, and showed that it is composed of two subunit groups bridged by a disulfide bond, the acidic A subunit group (32–39 kDa) and the basic B subunit group (22– 23 kDa). Moreover, they reported that the 11S and 2S (8–9 kDa)
polypeptides represented ca. 35 and 37%, respectively of total proteins (Brinegar and Goundan, 1993; Brinegar et al., 1996). The genomic and amino acid sequences of the 11S globulin of quinoa have been reported (Balzotti et al., 2008).
Quinoa seeds are also rich in bioactive compounds, such as vitamins (vitamin B2, vitamin E), carotene, tocopherols, and other molecules exerting antioxidant properties (e.g., phenolics) that scavenge harmful radicals (Pa´sko et al., 2009; Hirose et al., 2010; Repo-Carrasco-Valencia et al., 2010; Miranda et al., 2014). Diversity in these nutritional traits across genotypes has been reported (González et al., 2011; Vidueiros et al., 2015). In seeds of six quinoa genotypes from three geographical areas of Chile, significant differences in all the parameters analyzed were reported, with VR showing the highest content of protein, and vitamins E and C (Miranda et al., 2013, 2014). Seeds were also described as good sources of antioxidant compounds, although phenolic content, antioxidant and antimicrobial activities also varied among genotypes.
While many studies have been performed to investigate the tolerance of different quinoa genotypes to abiotic stress (mainly salinity) in terms of agronomic performance (growth, yield) and morpho/physiological mechanisms underlying salt tolerance (Adolf et al., 2013; Ruiz et al., 2016b), fewer have been devoted to the effects of high salinity on the nutritional quality of quinoa seeds. Increases or no effects in total protein content have been reported in most cases (Karyotis et al., 2003; Hariadi et al., 2011; Pulvento et al., 2012; Miranda et al., 2013). The effects of drought and salinity on seed phenolic content were investigated and only limited changes in these compounds under reduced irrigation (with or without salinity) were found (Gómez-Caravaca et al., 2012). Recently, increased total polyphenolics content (TPC) and antioxidant activity (AA) in methanol extracts of quinoa seeds harvested from plants grown under salinity has been observed, suggesting that stressful conditions may positively affect the seed’s content of these important bioactive compounds (Ruiz et al., 2016a). Flour and the protein concentrate (PC) of seeds of amaranth, a close relative of quinoa, have been shown to contain polyphenols and to possess AA (Escudero et al., 2011). To date, these parameters have not been investigated in quinoa protein extracts.
The purpose of the present work was to investigate changes in the amino acid and protein profiles of seeds obtained from quinoa plants grown under saline conditions. In general, the capacity to accumulate more storage proteins in seeds plays an important role in the initial stages of the next generation, especially germination (Koyro and Eisa, 2008). Our purpose, however, was to conduct a more detailed investigation on the changes occurring under salinity in the relative amounts of different protein fractions (albumin/globulin fraction) and, more specifically, in spot patterns of individual proteins. The proteomic analysis reveals which proteins are involved in the
salt-stress response in quinoa, thus contributing to a better understanding of the complex metabolic network involved in stress responses of halophytes (Koyro et al., 2013). In addition, the TPC and AA of protein extracts were evaluated in control and salinized seeds. These features strongly contribute to the nutraceutical properties of quinoa ( Repo-Carrasco-Valencia et al., 2010; Abderrahim et al., 2015; Tang et al., 2015), may influence seed longevity (Sano et al., 2015), and can ultimately lead to the production of PCs to be used in the food industry and as dietary complements for their high protein level, functional properties, and low content of anti-nutritional factors (Cordero-De-Los-Santos et al., 2005; Escudero et al., 2011; Castel et al., 2014). To date, the phenolics content and AA of quinoa seed protein extracts have not yet been examined. Given the strong genotypic differences reported for all aspects of quinoa’s responses to saline conditions (Adolf et al., 2012; Ruiz et al., 2016b), including nutritional aspects (Miranda et al., 2014; Abderrahim et al., 2015; Tang et al., 2015; Vidueiros et al., 2015), these parameters were comparatively analyzed in different genotypes. Thus, three Chilean landraces originating from contrasting habitats, namely R49, belonging to the salares ecotype, and two landraces belonging to the coastal-lowlands ecotype but from different latitudes and altitudes (VI-1, Villarrica), were examined. Seeds were harvested from plants grown in a pot experiment under saline (100 or 300 mM NaCl) and non-saline (0 mM NaCl) conditions.
MATERIALS AND METHODS
Plant Material
Seeds of three Chilean landraces of C. quinoa (Willd.), one belonging to the salares ecotype (R49) and two, VI-1 and Villarrica (VR), to the coastal-lowlands ecotype were collected along an altitudinal gradient from the arid northern highland with saline soils (R49, 3800 m a.s.l.) to sea level, and along a latitudinal gradient of ca. 2500 km, from ca. 34◦S (VI-1)
down to the rainier southern region (ca. 39◦S, VR) with higher
precipitation and non-saline soils (Peterson and Murphy, 2015). All seeds were obtained from the National Seed Bank of Chile managed by INIA-Intihuasi (Vicuña, Chile).
Vernalized seeds were sown in 20-L plastic pots containing a garden soil:sand (1:1) mixture. When plants had four to six well-expanded leaves (ca. 34 days after sowing) salt treatment was started by irrigating pots weekly with 0, 100, or 300 mM NaCl solutions; all the pots (control and salt-treated) were also watered weekly with 100–200 mL water supplemented with Phostrogen (N:P:K 10:10:27; 0.4 g L−1; Bayer Garden, Cambridge, UK).
Plants were grown (October to April) in a greenhouse under natural daylight conditions; the temperature was maintained at 23 ± 3◦C. Seeds were collected at maturity starting from 91 days
and up to 140 days after the first salt treatment, depending on the landrace, weighed, and stored in an air-tight container at 4◦C
until use.
Chemicals
All chemicals were obtained from Sigma-Aldrich (Milan, Italy) unless otherwise indicated.
Seed Flour Preparation
In order to remove saponins, quinoa seeds were washed repeatedly with cold water until there was no more foam in the wash water, and then dried at 50◦C up to 15 ± 3%
moisture. The dried seeds were ground to a fine powder using a mortar and pestle. The resulting flour was defatted with hexane under continuous stirring overnight and then air-dried at room temperature. Flours were stored at 4◦C until use.
Preparation of Protein Fractions
Protein fractions were prepared by a solvent-based sequential extraction following the methods ofJu et al. (2001),Bergamo et al. (2011),Džunková et al. (2011), andZevallos et al. (2012), with slight modifications. Briefly, the albumin/globulin fraction was obtained by suspending 50 mg of flour in 300 µl of 5% NaCl; the suspension was then homogenized for 5 min and centrifuged at 5500 g for 10 min. The procedure was repeated twice and the supernatants were collected. The flour was further extracted for prolamin-like proteins following the same procedure but using 250 µl of 60% (v/v) aqueous ethanol. The crude acid-soluble globulins and the 11S-enriched fraction were simultaneously isolated followingThanh et al. (1975). Briefly, defatted quinoa flour was extracted with 63 mM Tris-HCl buffer containing 10 mM β-mercaptoethanol, pH 7.8, for 1 h and then centrifuged for 15 min at 9500 × g. The extraction buffer was adjusted to pH 6.6, dialyzed against 63 mM Tris-HCl containing 10 mM β-mercaptoethanol, pH 6.6, at 4◦C for at least 4 h and centrifuged
for 20 min at 9500 × g. The precipitate corresponded to the crude 11S fraction while the supernatant, which corresponded to the crude acid-soluble globulin fraction, was further purified by adjusting the pH to 4.8. After centrifugation, the precipitate was dispersed in water and the pH was raised to 7.0. For assaying radical scavenging activity, extraction of the 11S-enriched fraction was performed by omitting β-mercaptoethanol both in the extraction and dialyzing buffers (Thanh et al., 1975). Protein concentration was determined spectrophotometrically at 562 nm using the bicinchoninic acid kit and bovine serum albumin (BSA) as standard.
SDS-PAGE and Gel Staining
All one-dimensional electrophoretic runs were performed with the Mini Protean III apparatus (Bio-Rad Laboratories, Segrate, Italy). Proteins (40 µg lane−1) were separated by SDS
polyacrylamide gel electrophoresis (SDS-PAGE) according to the method ofLaemmli (1970). For the glutenin-like enriched fraction, 2 M urea was added to both stacking and resolving gels. The molecular mass standard was the Biomol (Hamburg, Germany) BLUEplus prestained Protein Ladder (10–180 kDa). Gels were fixed at room temperature in 50% methanol: 5% glacial acetic acid for 20 min, then in 50% methanol for 10 min. After fixing, gels were washed twice in deionized water (10 min each) and stained with silver as previously described (Shevchenko et al., 1996) with minor modifications. Protein profiles were densitometrically analyzed using the AIDA software 4.14 (raytest Isotopenmessgeräte GmbH, Straubenhardt, Germany).
Protein Precipitation
For protein precipitation, 4 vol of 20% trichloroacetic acid (TCA) and 0.007% β-mercaptoethanol in cold acetone were added to samples, mixed and kept at −20◦C for at least 45 min.
Proteins were pelleted by centrifugation at 15,000 × g for 15 min at 4◦C and then washed with cold acetone containing
β-mercaptoethanol. This step was repeated at least three times and residual acetone was finally removed by air-drying. The last pellet was resuspended with buffer for 2DE analysis (see below) and the protein concentration of samples was determined using a commercial kit (2-D Quant Kit, GE HealthCare, Milan, Italy), performed as described in the instruction manual and using BSA as reference.
Two-Dimensional Electrophoresis (2DE)
For 2DE analyses, 11-cm IPG Strips with a 3–10 pH gradient (Bio-Rad) were used in combination with 10% Criterion XT gels (Bio-Rad). Strips were rehydrated in the solubilization buffer (40 mM Tris, 8 M urea, 2 M thiourea, 2% CHAPS, traces of bromophenol blue) to which 18 mM DTT and 20 µl ml−1
IPG buffer were added. Samples were dissolved to 1 mg ml−1
concentration in the solubilization buffer. Strips were rehydrated overnight in an Immobiline Dry Strip Reswelling Tray covered with a Dry Strip Cover PlusOne (GE HealthCare). Strips were run using a Protean IEF cell (Bio-Rad) through eight different steps:
• From 0 to 300 V for 30 min. • 300 V for 1 h and 30 min. • From 300 to 4000 V for 2 h. • 4000 V for 1 h and 30 min.
• From 4000 to 8000 V for 1 h and 30 min. • 8000 V until a total of 20,000 Vhr (Volts h−1). • From 8000 to 250 V for 10 min.
• Hold step of 250 V until use of strips.
Strips were stored at −80◦C or used immediately. In both cases,
they were equilibrated for 15 min in equilibration buffer (50 mM Tris-HCl, pH 8.8 containing 6 M urea, 30% glycerol, 2% SDS, bromophenol blue, 10 mg ml−1 dithiothreitol). Proteins were
then separated in the second dimension based on a Bis-Tris buffer system (pH 6.4) that uses discontinuous chloride and MES or MOPS ion fronts to form moving boundaries to stack and then separate denatured proteins by size. Molecular weight standards of the Precision series (Bio-Rad) were run in parallel. Gels were stained with Bio-Safe Coomassie blue (Bio-Rad) as described in the instruction protocol.
Spot Analysis
Images of gels were captured using the Fluor-S Multi-Imager (Bio-Rad). The exposure time was 5–7 s for gels stained with Coomassie blue. Analysis of spots in 2DE gels was performed using the Spot Detection Wizard of PDQuest (Bio-Rad) by selecting the weakest protein spot and the larger protein clusters. Subsequently, spot analysis was improved manually by adding unidentified spots and by removing incorrect signals. After creating a Master (virtual) gel, spots were matched to determine qualitative and quantitative differences. Further analysis of
spots was done using the Spot and Match set tools. The intensity of protein spots was normalized in relation to the total abundance of effective spots. After normalization and background subtraction, gels from control and treated samples were used to create a match set, which allowed the differential expression analysis between treated and control samples. Spots were considered as up- or down-regulated if their amount changed at least by a factor of 2. All samples were analyzed in duplicate.
Protein Identification by Mass
Spectrometry
Protein identification was performed as previously described (Hellman et al., 1995; Soski´c et al., 1999). Spots of interest were manually excised, destained in 2.5 mM ammonium bicarbonate and 50% (v/v) acetonitrile and then dehydrated in acetonitrile. Gel pieces were rehydrated in trypsin solution and in-gel protein digestion was performed by an overnight incubation at 37◦C. For MALDI-TOF MS, 1.25 µl of each protein digest
was directly spotted onto the MALDI target and air-dried. After drying, 0.75 µl of matrix solution [5 mg ml−1
α-cyano-4-hydroxycynnamic acid in 50% (v/v) acetonitrile and 0.5% (v/v) trifluoroacetic acid] was added to samples, which were allowed to dry again. Acquisition of mass spectra was performed using an Ultraflex III MALDI-TOF/TOF mass spectrometer (Bruker Daltonics, Billerica, MA, United States) in reflector positive mode. Spectra were analyzed by Flex Analysis software v. 3.0. Peptide mass fingerprinting (PMF) database searching was carried out in NCBInr and/or Swiss-Prot/TrEMBL databases set for Viridiplantae (Green Plants) using Mascot (Matrix Science Ltd., London, UK, http://www.matrixscience.com) on-line available software. The search settings were as follows: mass tolerance was set at 100 ppm, trypsin as the digestion enzyme with one allowed missed cleavage and oxidation of methionine as a variable modification. In order to accept identifications, the number of matched peptides, the extent of sequence coverage, and the probabilistic score were considered. Peptide digests that did not give unambiguous identifications were subjected to peptide sequencing by tandem mass spectrometry. MS/MS analysis was performed on the Ultraflex III MALDI-TOF/TOF instrument. Two to three PMF peaks showing a high intensity were CID (Collision Induced Dissociation) fragmented using Argon as collision gas, and MALDI-TOF/TOF tandem MS was performed in LIFT mode by software controlled data acquisition. Fragmented ions were analyzed using the Flex Analysis software v. 3.0. The MS/MS database search was carried out in NCBInr and/or Swiss-Prot/TrEMBL databases using the on-line MASCOT MS/MS ion search software. The following parameters were applied for the database search: taxonomy: Viridiplantae (Green Plants), trypsin specificity, one missed cleavage allowed, peptide precursor mass tolerance: ±100 ppm, fragment mass tolerance ±0.6 Da, peptide precursor charge state +1, carbamidomethylation of cysteine as a fixed modification, oxidation of methionine as a possible modification. Protein identification was considered significant based on Mascot ion score, peptide coverage by “b” and “y” ions, and expected value.
Amino Acid Analysis
Analysis of free amino acids and amino acids derived from complete hydrolysis of proteins in quinoa flour was performed in triplicate essentially as described by Silvanini et al. (2014)
with some modifications. To analyze the content of free amino acids, 0.5 ml dH2O and 75 µl trifluoroacetic acid were added to
20 mg of quinoa flour. After mixing, samples were centrifuged at 12,000 g for 5 min at room temperature. Supernatants were dried by Speed-Vac and residues were dissolved in 20 µl of 20 mM HCl. The content of protein-derived amino acids (PAAs) was determined by mixing each flour sample with 6 N HCl and phenol crystal (around 1 mg to avoid oxidation) followed by incubation for 24 h at 110◦C. After heating, samples were
centrifuged at 4000 rpm for 15 min at room temperature. The supernatant was dried under vacuum and the residue was dissolved in 20 µl of 20 mM HCl. Both free amino acids and those derived from hydrolysed proteins were derivatized according to the AccQ-Tag protocol (Waters, Milford, MA, USA). For HPLC analysis, a C18 AccQ-Tag column (3.9 × 150 mm; Waters, Milford, MA, USA) was used. A gradient elution was performed using a phosphate buffer solution as eluent A and acetonitrile:water 60:40 (v/v) as eluent B. The temperature was set at 37◦C; the flow rate was 1 ml min−1. The fluorescent detector
parameters were set as follows: λex = 250 nm, λem = 395 nm, gain 1, eufs 100. All data are expressed as mg 100 g−1flour.
Extraction of Total Proteins
Extraction of total proteins was performed essentially as described byEscudero et al. (2004). After adding 15 ml of double distilled water to an aliquot (50 mg) of the flour and continuous stirring for 30 min at room temperature (RT), the pH was taken to 9.0 with 0.1 N NaOH. After further stirring for 30 min, the homogenate was centrifuged at 4500 × g for 20 min at RT. The supernatant was collected and taken to pH 5.0 with 0.1 N HCl. After stirring for another 20 min and centrifugation at 4500 × g at 4◦C, the supernatant was discarded and the pellet
re-suspended in 500 µl of 63 mM Tris-HCl, pH 8.0. Protein concentration was determined spectrophotometrically at 562 nm using the bicinchoninic acid kit and BSA as standard.
Total Phenolics and Flavonoid Contents
The Folin-Ciocalteu (FC) assay was performed according to
Singleton and Rossi (1965) with some modifications; 50 µl of protein extract (1 mg protein ml−1) were mixed with 250 µl of
FC reagent (previously diluted 10-fold with distilled water) and 500 µl distilled water. The reaction mixture was incubated for 1 min at room temperature and then 800 µl of 20% (w/v) Na2CO3
was added. After incubation at 40◦C for 30 min, the absorbance
was measured spectrophotometrically at 760 nm (Jasco V-530, Jasco Corporation, Tokyo, Japan). The total polyphenolic content (TPC) was evaluated from a gallic acid standard curve and was expressed as mg gallic acid equivalents (GAE) g−1 seed DW.
The Prussian blue method (Hagerman and Butler, 1994) was also applied to determine total polyphenols. After adding 12 µl of 0.1 M FeNH4(SO4)2to 100 µl protein extract (1 mg protein ml−1),
the mixture was incubated for 20 min at RT. Subsequently, 12 µl of 8 mM K3Fe(CN)6 were added, and after 5 min at room
temperature, the optical density of the mixture was determined at 720 nm. Gallic acid was used as standard to make a calibration curve and data were expressed as mg GAE g−1DW.
The total flavonoid content (TFC) was determined with AlCl3
according to Liu et al. (2002)with slight modifications using rutin as standard. The seed protein extract (50 µl) was added to 450 µl of 100% methanol followed by 500 µl of 2% (w/v) AlCl3 in methanol. This reaction mixture was incubated for 15
min at room temperature. Finally, the absorbance of the reaction mixture was measured spectrophotometrically at 430 nm. Data were expressed as mg rutin equivalents (RE) g−1DW.
Radical Scavenging Activity
Free radical scavenging capacity of the protein extracts was determined by using the ABTS assay performed according to
Arnao et al. (2001)with slight modifications. The ABTS›+radical
cation was generated by oxidizing a 2.0 mM aqueous solution of ABTS with 70 mM K2S2O8and incubating in the dark for 24 h
at room temperature. The reaction mixture contained 1.0 ml of ABTS›+(diluted with methanol in order to obtain an absorbance of 0.7 at 734 nm) and different amounts (12.5, 25, 50, 100 µl) of sample solutions (1 mg ml−1total protein or 11S fraction) or Tris
buffer for the blank. The absorbance at 734 nm was measured after a reaction time of 20 min. Trolox equivalents per g DW of seeds were calculated using a standard curve prepared with a range of Trolox concentrations (0–30 µM) in order to calculate the Total Antioxidant Activity (TAC) value for the samples.
Statistical Analysis
Two independent experiments were performed. Each experiment consisted of three pots per treatment (0, 100, and 300 mM NaCl), each containing one plant per landrace, and set up according to a randomized block design. Flour preparation, protein extractions, SDS-PAGE, and AIDA analyses were performed at least twice. TPC, TFC, and AA data were performed in triplicate from two separate protein extractions. To determine the overall significances, a two-way factorial analysis of variance (two-way ANOVA) was used with salt treatment and landrace as factors. Mean comparisons were made by applying Tukey’s post-hoc test using InfoStat software (www.infostat.com.ar). Differences were considered significant at P < 0.05.
RESULTS
Seed Storage Protein Profiles and Spot
Analysis
Sequential extraction of the different protein fractions and isolation of the major storage proteins were performed on seeds of the three quinoa landraces (R49, VI-I, and VR) grown with/without 100 or 300 mM NaCl. A combination of SDS-PAGE and 2DE was used to, first of all, identify the fractions that were most affected by salt, and second the proteins that were most involved in the salt-induced response. The protein fraction analyzed was the one enriched in albumins/globulins. A general feature was the reduction of these storage proteins, expressed as mg protein mg−1 flour, after the 300 mM NaCl treatment. In
particular, the albumin/globulin fraction declined by ca. 12, 7, and 15% in R49, VI-I, and VR, respectively (data not shown).
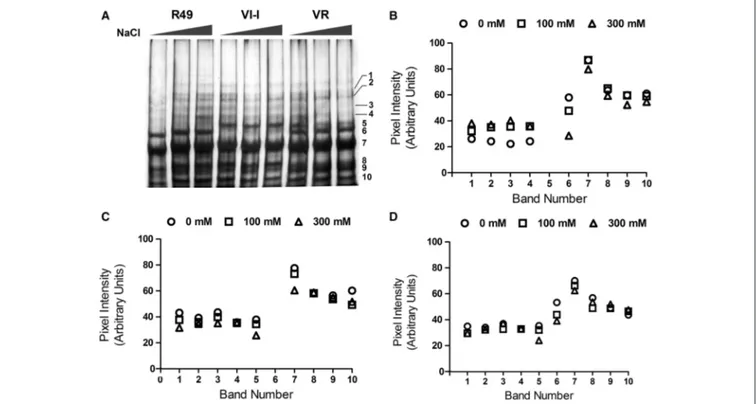
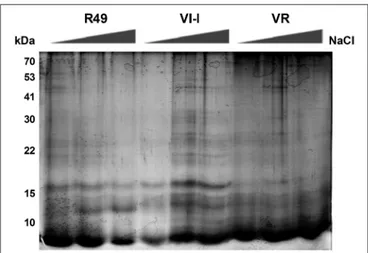
As shown in Figure 1, the proteins were resolved into distinct bands that spanned a broad range of apparent molecular weights from 15 to >55 kDa. The image analysis software identified 10 major bands of 49 (1), 45 (2), 42 (3), 40 (4), 32 (5), 30 (6), 25 (7), 22 (8), 19 (9), and 16 (10) kDa. Some difference in the band patterns among genotypes was evident: in R49 the 32-kDa (5) band was absent while VI-I seemed to lack the 30-kDa band (6); VR had both the 32- (5); and the 30-kDa (6) bands. Comparing the protein profiles in control and salt-treated seeds by SDS-PAGE revealed that the NaCl treatment induced significant changes in the protein patterns and that the three landraces were differentially affected by salinity. In R49, the profile was very similar in seeds from control and 100 mM NaCl-treated plants; in the 300 mM NaCl treatment, the high molecular weight bands (1–4) appeared to be slightly increased, while the low molecular weight bands (6–10) decreased significantly relative to controls (Figure 1B). Under saline conditions (300 mM NaCl), VI-I showed a decrease in different proteins; the decline was most evident in the low molecular-weight bands except for 8 and 9 (5–10; Figure 1C). Finally, in VR, both salt treatments decreased the intensity of bands 5, 6, and 7 in a concentration-dependent manner (Figure 1D).
Subsequently, a proteomic profile of the albumin/globulin fraction was performed by 2DE in control and salt-treated samples of landrace VR. This genotype was chosen because, in addition to changes in the SDS-PAGE band pattern,
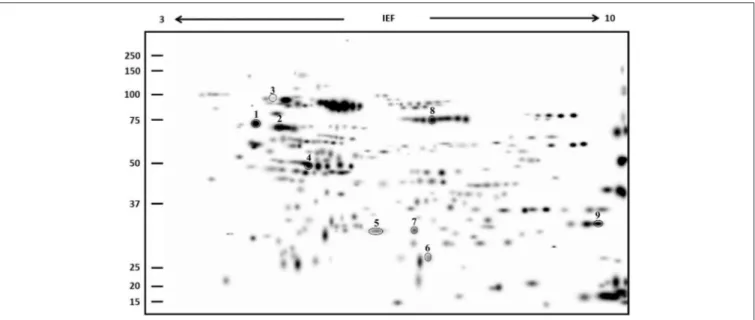
under salinity it also exhibited the highest TPC, TFC, and AA (see below) and the greatest percentage decrease in the albumin/globulin fraction. Two-DE gels revealed significant differences in protein composition between the two samples. Following the analysis of master gels obtained from albumin/globulin fractions, the nine spots whose abundance changed at least two-fold during treatments were selected and processed for identification by MALDI-TOF MS (Figure 2). Spots were numbered arbitrarily and correspond to numbers indicated in the identification list. As shown in Table 1, the spots analyzed by MS revealed specific correspondence to peptides in the protein database. They were clustered into seven functional categories: stress (chaperone/folding), transcription factors, respiration, photosynthesis, storage proteins, metabolism, and cell division. The spot intensities show that significant changes, either increases or decreases, occurred in response to salinity (Figure 3).
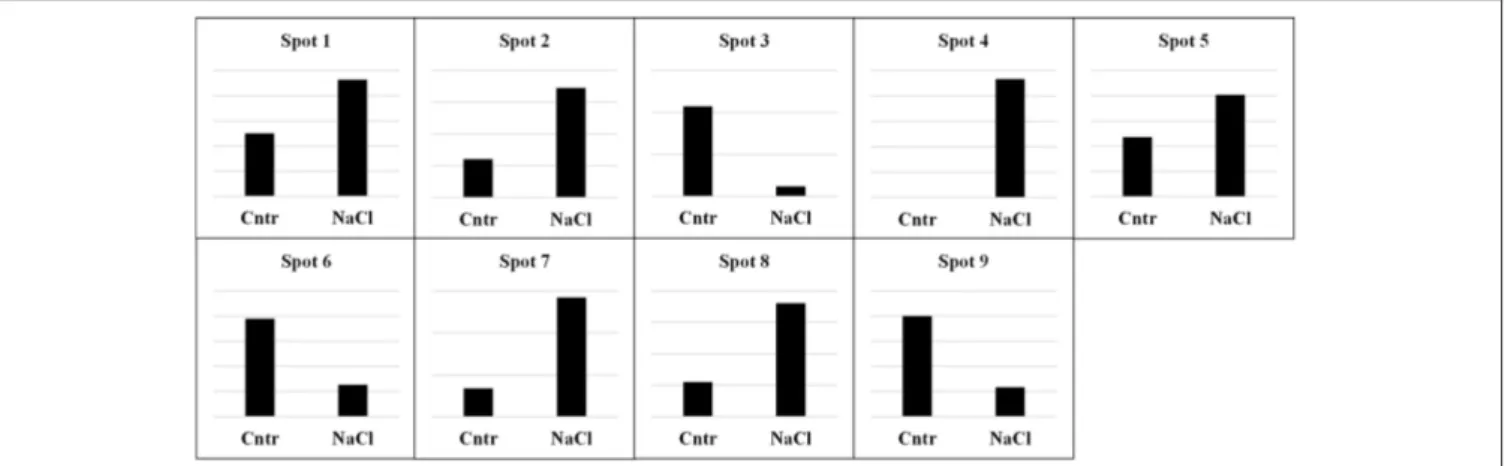
Three spots (1, 2, and 9) correspond to proteins involved in stress responses or as support in protein folding. In this category, spot 1 corresponds to a stromal chloroplast 70-kDa heat shock-related protein of Glycine soja, and to a putative heat shock protein of Ricinus communis. Analysis of the spot 2 sequence revealed a correspondence to several proteins with similar function: a GRP-78/luminal-binding protein of Spinacia oleracea, a luminal-binding protein of Beta vulgaris subsp. vulgaris, a luminal-binding protein 5 of Jatropha curcas, an endoplasmic reticulum chaperone binding protein of Lycium chinense, and a putative heat shock protein of R. communis. The intensity of
FIGURE 1 | Representative SDS-PAGE (A) of the albumin/globulin fraction of seeds from plants of three quinoa landraces (R49, VI-I, and VR) irrigated with 0, 100, or 300 mM NaCl. The 10 major bands identified by the AIDA Image Analyzer software are numbered: 49 (1), 45 (2), 42 (3), 40 (4), 32 (5), 30 (6), 25 (7), 22 (8), 19 (9), and 16 (10) kDa. Intensity of the 10 major bands in control and salt-treated (100 or 300 mM NaCl) samples of the three landraces: R49 (B), VI-I (C), and VR (D).
FIGURE 2 | Master gel obtained from the PDQuest-based comparison of 2DE gels of albumin/globulin fraction samples of VR (control and 300 mM NaCl-treated). The virtual image of gel represents all spots as detected in all samples tested. Molecular mass standards are indicated on the left while the pH range is at the top. Equivalent protein contents (200 µg) were loaded in each sample. Spots analyzed by MALDI-TOF are circled and numbered.
spots 1 and 2 increased after salt treatment. Spot 9 corresponded to peptidyl-prolyl cis-trans isomerase CYP20-1 of Amborella trichopoda, a protein involved in enhancing the correct folding of proteins; it decreased in seeds of salt-stressed plants as compared with controls. The second functional category is represented by spot 3, which corresponds to an Ethylene Insensitive3-like 1 protein of Phoenix dactylifera, a positive regulator in the ethylene response pathway. Its expression level decreased after treatment with NaCl. A protein involved in respiration was also identified (although only in the NaCl-treated samples). Spot 4 was matched to a mitochondrial beta-subunit of ATP synthase in different organisms (Fragaria vesca subsp. vesca, Oryza sativa and Pyrus ×bretschneideri). Spot 5 was identified as a plastid movement impaired protein of Medicago truncatula; the protein showed an increased level in the NaCl-treated sample. Mass spectrometry analysis revealed that spot 6 corresponded to the 11S seed storage globulin A of C. quinoa. The expression level of this protein showed a drastic decrease in samples treated with NaCl. Spot 7 found homology with a pantothenate kinase of Micromonas sp. This protein converts pantothenate to phosphopantothenate, using ATP as phosphate donor and was significantly up-regulated under salinity. Finally, spot 8 matched to a helicase protein of Tetrahymena thermophile, a protein involved in the unwinding of DNA or RNA helix. The expression level of this protein was drastically increased in samples treated with NaCl.
Profiles and Spot Analysis of Globulin
Fractions
As the albumin/globulin fraction from seed proteins of quinoa was strongly affected by salinity, a further attempt was made to isolate and analyze the crude acid-soluble globulins and the 11S- (chenopodin) enriched fractions by SDS-PAGE. As shown in Figure 4, proteins of the crude acid-soluble globulin fraction
were resolved into distinct bands that spanned a broad range of apparent molecular weights from 15 to >90 kDa. Results showed that the protein profiles were represented by eight major and distinct bands, common to all three landraces, with molecular weights of 90, 68, 45, 43, 31, 20, 18, and 15 kDa. Comparing the protein profiles in seeds from control and salt-treated plants revealed that the NaCl treatment did not induce significant changes in the protein composition; however, seeds of plants grown under 300 mM NaCl showed a general reduction in these storage proteins. In particular, the crude acid-soluble globulin fraction declined by 22.5, 13.9, and 25.3% in R49, VI-I, and VR, respectively.
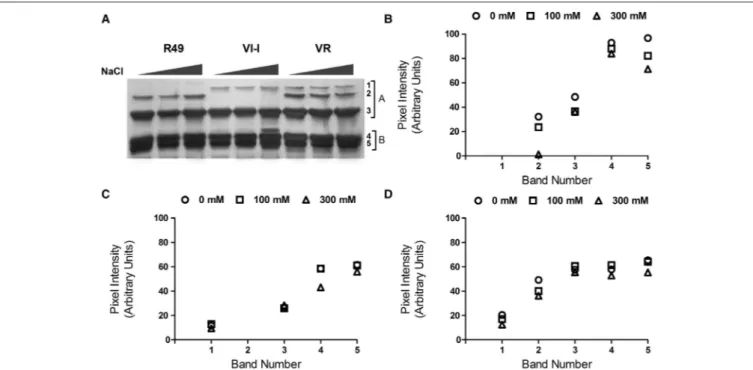
As shown by 2DE followed by mass spectrometry of the albumin/globulin fraction, a general reduction of chenopodin, the major 11S storage protein, was also evident (Figure 5). Proteins of the 11S-enriched fractions were resolved into distinct bands giving the typical electrophoretic pattern of chenopodin, in which subunits A (32–42 kDa) and B (22–23 kDa) were clearly evident (Figure 5A). By image analysis, five major bands of 42 (1), 40 (2), 32 (3), 24 (4), and 22 (5) kDa were identified. As already reported for the albumin/globulin fraction, protein band patterns showed some differences among genotypes: the 42-kDa (1) band was absent in R49, VI-I did not present the 40-kDa (2) band and VR had both. Comparing the protein profiles in control and salt-treated seeds by SDS-PAGE revealed that the NaCl treatment induced a significant reduction in the 11S-enriched fraction and that the three landraces were differentially affected by salinity (Figures 5B–D).
As previously done for the albumin/globulin fraction, a proteomic profile of the 11S fraction was obtained by 2DE. Only landrace VR was analyzed because, as outlined above, all of the five main bands were affected by salt treatment. The comparison between control and salt-treated samples revealed
T A B L E 1 | P ro te in s id e n ti fi e d b y M A L D I-T O F a n d /o r M A L D I-T O F /T O F ma s s s p e c tr o me tr y d u ri n g a n a ly s is o f th e a lb u mi n /g lo b u li n fr a c ti o n fr o m s e e d s a q u in o a la n d ra c e (V R ). S p o t P ro te in n a me A c c e s s io n n u mb e r P ri n c ip a l fu n c ti o n p I/ M W M A S C O T s e a rc h re s u lt s S c o re M a tc h e d C o v e ra g e p e p ti d e s 1 S tr o m a l7 0 kD a h e a t sh o c k-re la te d p ro te in , c h lo ro p la st ic [G ly c in e s o ja ] g i|7 3 4 4 1 8 5 2 1 In te ra c ts w ith n e w ly im p o rt e d c h lo ro p la st p ro te in s to a ss is t in th e ir m a tu ra tio n 4 .8 4 6 5 5 2 1 1 0 2 1 3 2 4 H e a t sh o c k p ro te in , p u ta tiv e [R ic in u s c o m m u n is ] g i|2 5 5 5 7 0 9 9 0 S tr e ss re sp o n se 5 .3 5 7 5 4 3 1 1 1 3 1 5 2 4 2 G R P -7 8 [S p in a c ia o le ra c e a ]/L u m in a l-b in d in g p ro te in g i|3 9 1 3 7 8 6 P ro b a b ly p la ys a ro le in fa c ili ta tin g th e a ss e m b ly o f m u lti m e ric p ro te in c o m p le xe s in si d e th e E R 5 .0 3 7 3 7 7 5 1 7 7 2 1 3 4 L u m in a l-b in d in g p ro te in [B e ta vu lg a ri s su b sp . vu lg a ris ] g i|7 3 1 3 2 1 5 3 8 P ro te in in vo lv e d in p ro c e ss in g E R 4 .9 8 7 3 5 8 4 1 5 3 1 9 3 3 L u m in a l-b in d in g p ro te in 5 [J a tr o p h a c u rc a s ] g i|8 0 2 6 1 2 3 0 3 P ro b a b ly p la ys a ro le in fa c ili ta tin g th e a ss e m b ly o f m u lti m e ric p ro te in c o m p le xe s in si d e th e E R 5 .1 1 7 3 6 9 3 1 4 8 1 9 3 0 E n d o p la sm ic re tic u lu m c h a p e ro n e b in d in g p ro te in [L yc iu m c h in e n s e ] g i|7 4 9 3 9 6 7 6 1 A T P b in d in g 5 .0 8 7 3 3 4 3 1 3 9 1 8 3 0 H e a t sh o c k p ro te in , p u ta tiv e [R ic in u s c o m m u n is ] g i|2 5 5 5 5 5 6 5 9 S tr e ss re sp o n se 5 .1 7 7 3 4 6 4 1 3 4 1 8 2 8 3 P R E D IC T E D : E T H Y L E N E IN S E N S IT IV E 3 -l ik e 1 p ro te in [P h o e n ix d a c ty lif e ra ] g i|6 7 2 1 7 4 4 0 3 P ro b a b le tr a n sc rip tio n fa c to r a c tin g a s a p o si tiv e re g u la to r in th e e th yl e n e re sp o n se p a th w a y. C o u ld b in d th e p rim a ry e th yl e n e re sp o n se e le m e n t p re se n t in th e E T H Y L E N E -R E S P O N S E -F A C T O R 1 p ro m o te r 5 .0 8 4 0 2 5 2 8 2 1 1 2 9 4 P R E D IC T E D : A T P sy n th a se su b u n it b e ta , m ito c h o n d ria l[ F ra g a ri a ve s c a su b sp . ve sc a ] g i|4 7 0 1 2 6 0 6 9 P ro d u c e s A T P fr o m A D P in th e p re se n c e o f a p ro to n g ra d ie n t a c ro ss th e m e m b ra n e w h ic h is g e n e ra te d b y e le c tr o n tr a n sp o rt c o m p le xe s o f th e re sp ira to ry c h a in 6 .0 1 6 0 1 1 9 1 3 0 1 9 4 6 P u ta tiv e A T P sy n th a se b e ta su b u n it [O ry za s a ti va Ja p o n ic a G ro u p ] g i|5 6 7 8 4 9 9 1 P ro d u c e s A T P fr o m A D P in th e p re se n c e o f a p ro to n g ra d ie n t a c ro ss th e m e m b ra n e . T h e c a ta ly tic si te s a re h o st e d p rim a ril y b y th e b e ta su b u n its 5 .3 3 4 5 9 3 7 1 1 0 1 5 4 8 P R E D IC T E D : A T P sy n th a se su b u n it b e ta , m ito c h o n d ria l[ P yr u s x b re ts c h n e id e ri ] g i|6 9 4 3 1 1 4 1 2 P ro d u c e s A T P fr o m A D P in th e p re se n c e o f a p ro to n g ra d ie n t a c ro ss th e m e m b ra n e . T h e c a ta ly tic si te s a re h o st e d p rim a ril y b y th e b e ta su b u n its 6 .1 3 6 0 1 7 8 1 0 8 1 8 4 1 P R E D IC T E D : A T P sy n th a se su b u n it b e ta , m ito c h o n d ria l-lik e [P yr u s x b re ts c h n e id e ri ] g i|6 9 4 3 3 0 9 9 5 P ro d u c e s A T P fr o m A D P in th e p re se n c e o f a p ro to n g ra d ie n t a c ro ss th e m e m b ra n e . T h e c a ta ly tic si te s a re h o st e d p rim a ril y b y th e b e ta su b u n its 6 .0 1 6 0 1 5 1 1 0 8 1 8 4 1 5 P la st id m o ve m e n t im p a ire d p ro te in [M e d ic a g o tr u n c a tu la ] g i|9 2 2 3 6 9 3 8 9 R e q u ire d fo r th e c h lo ro p la st a vo id a n c e re sp o n se u n d e r h ig h in te n si ty b lu e lig h t. T h is a vo id a n c e re sp o n se c o n si st s in th e re lo c a tio n o f c h lo ro p la st s o n th e a n tic lin a ls id e o f e xp o se d c e lls . A c ts in a ss o c ia tio n w ith W E B 1 to m a in ta in th e ve lo c ity o f c h lo ro p la st p h o to re lo c a tio n m o ve m e n t vi a c p -a c tin fil a m e n ts re g u la tio n 9 .9 4 2 3 5 2 3 7 7 9 4 2 6 1 1 S se e d st o ra g e g lo b u lin A [C h e n o p o d iu m q u in o a ] g i|1 1 5 3 4 3 5 1 1 F u n c tio n s in th e st o ra g e o f n u tr iti o u s su b st ra te s 6 .8 8 5 4 0 3 4 8 2 1 2 2 1 7 P a n to th e n a te ki n a se [M ic ro m o n a s sp . R C C 2 9 9 ] g i|2 5 5 0 7 0 8 2 5 A T P b in d in g a n d p a n to th e n a te ki n a se a c tiv ity . C a ta ly si s o f th e re a c tio n : A T P + p a n to th e n a te = A D P + D -4 ′-p h o sp h o p a n to th e n a te 5 .6 9 1 0 4 2 9 3 8 1 1 1 1 2 8 H e lic a se c a rb o xy -t e rm in a ld o m a in p ro te in [T e tr a h ym e n a th e rm o p h ila S B 2 1 0 ] g i|8 2 9 1 6 8 8 0 9 A T P b in d in g a n d h e lic a se a c tiv ity . C a ta ly si s o f th e re a c tio n : N T P + H 2 O = N D P + p h o sp h a te , to d riv e th e u n w in d in g o f a D N A o r R N A h e lix 7 .8 8 2 2 3 0 3 0 9 2 2 3 1 5 9 P e p tid yl -p ro ly lc is -t ra n s is o m e ra se C Y P 2 0 -1 [A m b o re lla tr ic h o p o d a ] g i|5 8 6 7 1 8 0 1 2 P P Ia se s a c c e le ra te th e fo ld in g o f p ro te in s. It c a ta ly ze s th e c is -t ra n s is o m e riz a tio n o f p ro lin e im id ic p e p tid e b o n d s in o lig o p e p tid e s. B in d s c yc lo sp o rin A (C sA ). C sA m e d ia te s so m e o f its e ff e c ts vi a a n in h ib ito ry a c tio n o n P P Ia se 8 .9 9 2 2 3 0 1 7 7 8 4 0 F o r e a c h s po t, n u m be r, pr o te in n a m e , o rg a n is m , a c c e s s ion n u m be r, pr in c ipa lf u n c ti on s , th e or e ti c a lpI , m ol e c u la r m a s s (MW ), a n d Ma s c ot s e a rc h da ta a re s h ow n .
FIGURE 3 | Relative abundance of individual spots from the albumin/globulin fractions of quinoa seeds harvested from plants grown under control (Cntr) or saline (NaCl) conditions. Spots are numbered as shown in the master gel (Figure 2). Each spot is presented with the value of its relative quantification. The first column indicates the control sample, while the second column indicates the 300 mM NaCl treatment. Scales are different in the Y-axes of each graph because they were optimized to highlight the different intensity of spots between samples. In all cases, the most intense spot was used as reference for calibrating the scale of Y-axes.
remarkable differences in protein composition (Figure 6). Fifteen spots whose expression levels changed significantly were further analyzed by mass spectrometry. They revealed a specific correspondence to proteins found in databases (Table 2). As in the case of the albumin/globulin fraction, the proteins were clustered into five main functional categories: stress (chaperone/folding), storage proteins, photosynthesis, respiration, and ion transport. The spot intensities in seeds of plants grown under non-saline or saline (300 mM NaCl) conditions are represented in Figure 7. Three different proteins (spots 1, 2, and 4) are involved in stress (chaperone/folding). Two were identified as hypothetical and predicted proteins; however, subsequent BLAST analysis revealed that they corresponded to heat shock 70-kDa protein 6, chloroplastic-like of Gossypium raimondii and heat shock cognate 70-kDa protein 1 of Aegilops tauschii, respectively. The third protein was identified as a heat shock protein 90 of Nicotiana tabacum. In all cases, salt stress increased the accumulation of these proteins compared to controls.
For the storage category, nine spots corresponding to the 11S seed storage globulin of C. quinoa and a predicted-legumin B-like of B. vulgaris subsp. vulgaris were identified. The expression levels of these proteins changed significantly under salinity. In the case of 11S globulin, the salt-treated sample showed a significant down-regulation or a complete disappearance of spots 6, 9, 10, 11, 12, and 13. On the other hand, the expression level of spots 7 and 8 increased in salt-treated samples compared to controls. Spot 3 corresponds to a chloroplastic RuBisCO large subunit-binding protein, subunit alpha of Brassica napus. This photosynthetic protein increased after salt treatment. For the respiration category, spot 5 had a significant correspondence to mitochondrial ATP synthase subunit beta of Prunus mume and its intensity increased during stress. The ion transport category was represented by spot 14, which corresponds to a predicted cation/H(+) antiporter 6B of Camelina sativa whose intensity increased during stress.
FIGURE 4 | Representative SDS-PAGE of the crude acid-soluble globulin fraction of seeds of three quinoa landraces (R49, VI-I, and VR) irrigated with 0, 100, or 300 mM NaCl.
Prolamin-Like Proteins
Detecting and separating quinoa prolamin-like proteins was quite problematic because these polypeptides are scarcely soluble. The ethanol-soluble prolamin-like proteins were scarce and consisted of low-molecular weight polypeptides (Figure 8). Comparing the protein profiles in control and salt-treated seeds by SDS-PAGE revealed that the NaCl treatment did not induce changes in the pattern of proteins possibly related to gluten.
Amino Acid Profiles
The HPLC analysis of free amino acids and of amino acids derived from the complete hydrolysis of proteins (PAAs) from control and salt-treated seeds of quinoa revealed that some (Asp, Ser, Glu, Gly) were below the limit of detection in most samples
T A B L E 2 | P ro te in s id e n ti fi e d b y M A L D I-T O F a n d /o r M A L D I-T O F /T O F ma s s s p e c tr o me tr y d u ri n g a n a ly s is o f th e 1 1 S fr a c ti o n o f q u in o a la n d ra c e V R s e e d . S p o t P ro te in n a me /O rg a n is m A c c e s s io n n u mb e r P ri n c ip a l fu n c ti o n B L A S T p I/ M W M A S C O T s e a rc h re s u lt s S c o re M a tc h e d p e p ti d e s C o v e ra g e 1 H yp o th e tic a lp ro te in B 4 5 6 _0 0 6 G 2 3 2 4 0 0 [G o s s yp iu m ra im o n d ii] g i|7 6 3 7 7 0 7 9 3 P re ve n tin g a g g re g a tio n , a ss is tin g re fo ld in g , p ro te in im p o rt a n d tr a n sl o c a tio n , si g n a lt ra n sd u c tio n , a n d tr a n sc rip tio n a la c tiv a tio n H e a t sh o c k 7 0 kD a p ro te in 6 , c h lo ro p la st ic -l ik e [G o s s yp iu m ra im o n d ii] 5 .4 5 6 3 3 2 4 1 3 5 1 2 2 7 2 P re d ic te d p ro te in [H o rd e u m vu lg a re su b sp . vu lg a re ] g i|3 2 6 5 0 6 1 3 2 P re ve n tin g a g g re g a tio n , a ss is tin g re fo ld in g , p ro te in im p o rt , a n d tr a n sl o c a tio n , si g n a lt ra n sd u c tio n , a n d tr a n sc rip tio n a la c tiv a tio n H e a t sh o c k c o g n a te 7 0 kD a p ro te in 1 [A e g ilo p s ta u s c h ii] 5 .0 7 7 1 4 7 6 1 1 7 1 6 2 8 3 R u B is C O la rg e su b u n it-b in d in g p ro te in su b u n it a lp h a , c h lo ro p la st ic [B ra s s ic a n a p u s ] g i|1 3 5 1 0 3 0 R u B P c a rb o xy la se /o xy g e n a se (R u b is C O ) c a ta ly zi n g th e a c tu a l p rim a ry C O 2 fix a tio n re a c tio n 4 .8 4 5 7 7 1 4 1 1 5 1 4 3 0 4 H e a t sh o c k p ro te in 9 0 [N ic o ti a n a ta b a c u m ] g i|4 6 0 9 3 8 9 0 F a c ili ta tin g m a tu ra tio n o f si g n a lin g m o le c u le s, g e n e tic b u ff e rin g 4 .9 5 8 0 3 5 8 1 0 2 1 0 1 5 5 A T P sy n th a se su b u n it b e ta , m ito c h o n d ria l[ P ru n u s m u m e ] g i|6 4 5 2 7 0 1 0 2 P ro d u c e s A T P fr o m A D P in th e p re se n c e o f a p ro to n g ra d ie n t a c ro ss th e m e m b ra n e w h ic h is g e n e ra te d b y e le c tr o n tr a n sp o rt c o m p le xe s o f th e re sp ira to ry c h a in 5 .2 0 4 5 9 8 9 1 1 8 1 1 4 1 6 1 1 S se e d st o ra g e g lo b u lin [C h e n o p o d iu m q u in o a ] g i|4 5 5 1 0 8 7 7 S e e d st o ra g e F Y L A G K P Q Q E H S R 7 P R E D IC T E D : le g u m in B -l ik e [B e ta vu lg a ri s su b sp . vu lg a ris ] g i|7 3 1 3 2 0 8 4 1 F u n c tio n s in th e st o ra g e o f n u tr iti o u s su b st ra te s m s/m s S F F L A G N P Q G R 8 P R E D IC T E D : le g u m in B -l ik e [B e ta vu lg a ri s su b sp . vu lg a ris ] g i|7 3 1 3 2 0 8 4 1 S e e d st o ra g e S F F L A G N P Q G R 9 1 1 S se e d st o ra g e g lo b u lin A o r B [C h e n o p o d iu m q u in o a ] C -f ra g m e n t g i|1 1 5 3 4 3 5 1 1 o r g i|1 1 5 3 4 3 5 1 3 F u n c tio n s in th e st o ra g e o f n u tr iti o u s su b st ra te s 6 .8 8 5 4 0 3 4 o r 6 .5 8 5 3 9 4 2 8 2 o r 7 3 1 5 o r 1 4 3 2 o r 3 1 1 0 1 1 S se e d st o ra g e g lo b u lin A o r B [C h e n o p o d iu m q u in o a ] C -f ra g m e n t g i|1 1 5 3 4 3 5 1 1 o r g i|1 1 5 3 4 3 5 1 3 F u n c tio n s in th e st o ra g e o f n u tr iti o u s su b st ra te s 6 .8 8 5 4 0 3 4 o r 6 .5 8 5 3 9 4 2 7 9 o r 7 0 1 3 o r 1 2 2 8 o r 2 7 1 1 1 1 S se e d st o ra g e g lo b u lin A o r B [C h e n o p o d iu m q u in o a ] C -f ra g m e n t g i|1 1 5 3 4 3 5 1 1 o r g i|1 1 5 3 4 3 5 1 3 F u n c tio n s in th e st o ra g e o f n u tr iti o u s su b st ra te s 6 .8 8 5 4 0 3 4 o r 6 .5 8 5 3 9 4 2 7 9 o r 7 0 1 3 o r 1 2 2 8 o r 2 7 1 2 1 1 S se e d st o ra g e g lo b u lin A o r B [C h e n o p o d iu m q u in o a ] C -f ra g m e n t g i|1 1 5 3 4 3 5 1 1 o r g i|1 1 5 3 4 3 5 1 3 F u n c tio n s in th e st o ra g e o f n u tr iti o u s su b st ra te s 6 .8 8 5 4 0 3 4 o r 6 .5 8 5 3 9 4 2 8 8 o r 7 8 1 4 o r 1 3 3 2 o r 3 1 1 3 1 1 S se e d st o ra g e g lo b u lin A o r B [C h e n o p o d iu m q u in o a ] C -f ra g m e n t g i|1 1 5 3 4 3 5 1 1 o r g i|1 1 5 3 4 3 5 1 3 F u n c tio n s in th e st o ra g e o f n u tr iti o u s su b st ra te s 6 .8 8 5 4 0 3 4 o r 6 .5 8 5 3 9 4 2 8 5 o r 7 5 1 4 o r 1 3 2 8 o r 2 7 1 4 P R E D IC T E D : c a tio n /H (+ ) a n tip o rt e r 6 B [C a m e lin a s a ti va ] g i|7 2 7 5 7 9 7 3 8 M o n o va le n t c a tio n : p ro to n a n tip o rt e r a c tiv ity ; p o ta ss iu m io n tr a n sp o rt , so d iu m io n tr a n sp o rt D S IIL G IIM G T K 1 5 1 1 S se e d st o ra g e g lo b u lin A o r B [C h e n o p o d iu m q u in o a ] C -f ra g m e n t g i|1 1 5 3 4 3 5 1 1 o r g i|1 1 5 3 4 3 5 1 3 F u n c tio n s in th e st o ra g e o f n u tr iti o u s su b st ra te s 6 .8 8 5 4 0 3 4 o r 6 .5 8 5 3 9 4 2 1 3 0 o r 1 1 8 1 3 3 1 o r 2 9 F o r e a c h s po t, n u m be r, pr o te in n a m e , o rg a n is m , a c c e s s ion n u m be r, pr in c ipa lf u n c ti on s , th e or e ti c a lpI , m ol e c u la r m a s s (MW ), a n d Ma s c ot s e a rc h da ta a re s h ow n .
FIGURE 5 | Representative SDS-PAGE of the 11S (chenopodin)-enriched fraction from seeds of three quinoa landraces (R49, VI-I, and VR) irrigated with 0, 100, or 300 mM NaCl (A). The five major bands identified by AIDA Image Analyzer software are labeled with numbers: 42 (1), 40 (2), 32 (3), 24 (4), and 22 (5) kDa. The intensity of the five major bands is shown for control and salt-treated (100 or 300 mM NaCl) landraces: R49 (B), VI-I (C), and VR (D).
FIGURE 6 | Master gel obtained from the PDQuest-based comparison of 2DE gels of the 11S fraction from control and 300 mM NaCl-treated samples. The virtual gel image represents all spots as detected in all samples. Molecular mass standards are indicated on the left while the pH range is at the top. Equivalent protein contents (200 µg) were loaded in each sample. Spots analyzed by MALDI-TOF are circled and numbered.
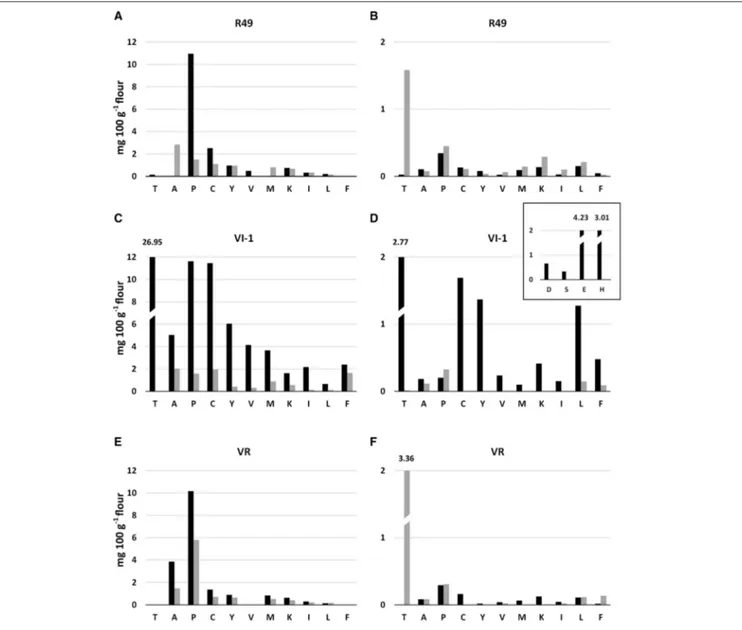
and were present only as free amino acids in VI-1 controls (Figure 9D, inset). Overall, the PAA profile was quite different from that of the free amino acids, both quantitatively (PAAs were much more abundant) and qualitatively (Figure 9).
In seeds of control plants, the profile derived from protein hydrolysis showed that Pro was the most abundant PAA in R49
and VR, followed by Cys and Tyr in R49, and by Ala, Cys, Tyr and Met in VR; in VI-1, Pro content was comparable to that of the other landraces, but the most abundant amino acid was Thr (several fold higher than the other amino acids, Figures 9A,C,E). In control plants of VI-1, by far the most abundant essential free amino acids were His and Thr, followed by essential and
FIGURE 7 | Relative abundance of individual spots in the 11S fraction of quinoa seeds harvested from plants grown under control (Cntr) or saline (NaCl) conditions. Spots are numbered as shown in the master gel (Figure 6). Each spot is presented with the value of its relative quantification. Scales are different in the Y-axes of each graph because they were optimized to highlight the different intensity of spots between samples. In all cases, the most intense spot was used as reference for calibrating the scale of Y-axes.
FIGURE 8 | Representative SDS-PAGE of the ethanol-soluble prolamin-like proteins.
non-essential amino acids Cys, Tyr, Leu, Glu; in R49 and VR these amino acids were much less abundant or not detectable (Figures 9B,D,F). Pro was the most represented free amino acid in these two landraces followed by Cys. Free Lys content was also ca. three-fold higher in VI-1 than in the other landraces.
Salt differentially affected the amino acid composition of the three landraces. Again, the PAA profile differed substantially from that of free amino acids also in salt-treated samples (Figures 9A,C,E). The non-essential PAAs Ala, Pro, and Cys decreased strongly in all landraces relative to controls, except for Ala in R49, which increased. In R49 there were no changes in
some essential amino acids (Lys, Ile, Phe) while other essential amino acids (Thr, Val) declined. Met was the only essential PAA that increased in response to salinity, but only in R49. In VR, all essential PAAs either decreased (Met, Lys, Ile) or remained unchanged; only Leu increased slightly (30% above control value). The strongest overall salt-induced reduction in amino acids was observed in VI-1.
It is noteworthy that in R49 free Thr was induced 60-fold by salinity; other free essential amino acids, namely Val, Lys, and Ile were also significantly enhanced (ca. 2.6−, 2.1−, 3.6-fold) while Leu increased by 25% (Figures 9B,D,E). By contrast, in VR and VI-1, all free essential amino acids were down-regulated, with the exception of Phe in VR, which increased by ca. 7.5-fold. Amongst the non-essential amino acids Ala, Pro, and Cys, there were no or very limited reductions (20–40%) in all three landraces and Pro even increased by 30 and 60% in R49 and VI-1, respectively. In VI-1, most free amino acids were undetectable in salt-treated samples showing a similar trend to the PAAs; in this landrace, Thr disappeared under salinity, whereas in R49 and VR the opposite occurred.
Total Phenolic and Flavonoid Content, and
Antioxidant Activity
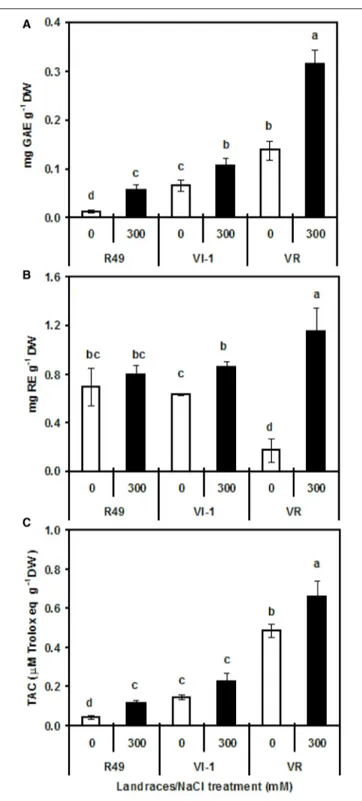
In the total proteins extracted from quinoa seeds, there was a genotype-dependent and salt-dependent variation in TPC as determined by the FC assay (Figure 10A). Under non-saline conditions, VR had the highest values followed by VI-1and R49. In all three landraces, seeds from plants grown with 300 mM NaCl had higher TPC than those grown without NaCl. The strongest increase (3.5-fold) was observed in R49 while in VR
FIGURE 9 | Contents (mg amino acid 100 g−1flour) of protein-derived amino acids (A,C,E) and free amino acids (B,D,F) in seeds of control (black) and
salt-treated (gray) landraces R49, VI-1, and VR. D, Aspartic acid; S, Serine; E, Glutamic acid; G, Glycine; H, Histidine; R, Arginine; T, Threonine; A, Alanine; P, Proline; C, Cysteine; Y, Tyrosine; V, Valine; M, Methionine; K, Lysine; I, Isoleucine; L, Leucine; F, Phenylalanine.
and VI-1 the increase was lower (ca. 60–70% above control levels). Using the Prussian blue method, polyphenols were below detection limit in R49 and VI-1 control and treated seeds; in VR controls, polyphenols were confirmed to be substantially more abundant than in the other two landraces (0.17 ± 0.007 GAE mg−1 DW) and dramatically enhanced (five-fold) under
salinity (data not shown). Flavonoid concentrations were similar in R49 and VI-1 but lower in VR; however, salinity enhanced TFC only in VR (Figure 10B). The radical scavenging capacity of the seed protein extracts assayed with the ABTS method indicated that TAC was significantly different between landraces, with VR exhibiting higher values as compared with R49 and VI-1. It was slightly but significantly higher in seeds from salt-treated plants of R49 and VR as compared with controls (Figure 10C). The 11S globulin-enriched fraction, extracted without using
β-mercaptoethanol, also revealed some ABTS radical scavenging capacity. Values were much lower (0.005–0.006 mM Trolox equivalent g−1 DW) than those of the total protein extract and
did not change significantly in salt-treated vs. control samples (data not shown).
DISCUSSION
Quinoa seeds are regarded as one of the most nutritionally well-balanced plant foods under cultivation, especially for their protein content and excellent balance between carbohydrates, lipids, and proteins. The increasing interest in quinoa as a crop is also centered on its remarkable adaptability to harsh environmental conditions such as low water content and high
FIGURE 10 | Total polyphenols as assayed by the Folin-Ciocalteu method (A), total flavonoids (B), and total antioxidant activity (TAC, C) in protein extracts of quinoa seeds harvested from plants grown under control (0) or saline (300 mM NaCl) conditions.
alkalinity of saline soils. Soil salinity is, in fact, among the major factors limiting crop yield and productivity worldwide and is expected to increase in the future. Several comparative studies have shown that the extent to which these and other
parameters are affected by salinity in quinoa is strongly genotype-dependent (Gómez-Pando et al., 2010; Adolf et al., 2012).
In the framework of our current investigations on salinity tolerance in quinoa, we have measured growth, yield, germination capacity, leaf TPC, and seed quality in the three Chilean landraces R49, VI-I, and VR exposed to two levels of salinity (Ruiz et al., 2016a). In the present work, we aimed to delve further into the effects of salt treatment on the seed proteome and on the polyphenol content, and AA of seed extracts. The PC of Amaranthus cruentus seeds were reported to have improved nutritional quality as compared with flour through increased content of factors that directly or indirectly influence lipid metabolism and enhance antioxidant protection (Escudero et al., 2011). The AA of PCs obtained through different pilot-scale industrial processes from A. mantegazzianus seeds was recently evaluated in order to optimize production for the food industry (Castel et al., 2014).
Proteomic Changes
Preliminary analyses were conducted on the three different Chilean landraces in order to unveil genotype-specific responses. In fact, seed protein electrophoresis has been utilized in taxonomy for the explanation of the origin and evolution of a number of cultivated plants (Ahmad and Slinkard, 1992; Jha and Ohri, 1996; Nath et al., 1997; Ghafoor et al., 2002). Seed protein profiles of 40 wild and cultivated taxa of Chenopodium were congruent with taxonomic position, crossability relationships, and other biochemical characters, confirming SDS-PAGE as a powerful tool in solving taxonomic problems (Bhargava et al., 2005). More recently, Džunková and co-workers showed that both classical SDS-PAGE and chip electrophoresis analysis of seed storage proteins were useful methods for studying amaranth taxonomy in order to assess differences among different species and even among accessions (Džunková et al., 2011). They suggested that specific fractions, including albumin-and glutelin-enriched fractions, instead of whole extracts, could better reveal differences among landraces. In the present study, the best candidates for SDS-PAGE-mediated polymorphism analysis were the most abundant seed storage proteins, i.e., the albumin/globulin fraction. In fact, results confirm a high polymorphism in seed storage proteins both in the position and in the intensity of some bands. The two most representative genotype-specific bands of this fraction were the 30- and 32-kDa bands.
Because of their low concentrations, prolamins were not suitable for this type of analysis, both in quinoa, herein analyzed, and amaranth andDžunková et al. (2011). While the globulins of amaranth did not differ in band intensity and position (Džunková et al., 2011), we showed that chenopodin, the 11S globulin of quinoa, displayed a high polymorphism in the three landraces analyzed, with genotype-specific protein bands of 40-and 42-kDa. Balzotti et al. (2008) reported the phylogenetic relationships between quinoa and 49 other species by using the coding DNA sequence for the well-conserved 11S basic subunit. On the basis of amino acid alignments, more than 74% sequence identity between amaranth and quinoa was revealed.
To better understand the effects of salt stress on quinoa seeds, we further investigated the composition of storage proteins after irrigation with 300 mM NaCl as compared with untreated controls. Both quantitative and qualitative differences in protein expression as a result of salt treatment were found. The albumin/globulin fraction, and in particular the 11S globulin, was the most affected fraction in terms of reduced percentage content as well as altered profile, both in SDS-PAGE and 2DE. Proteomic analysis revealed increases in the expression of proteins known to be involved directly in ER lumenal protein folding and in the assembly of proteins (Shewry et al., 1995), thus indirectly in the response to cellular stresses. Thus, despite a general decrease in protein content, up-regulation of some specific proteins, such as proteins involved in specific and fundamental cellular processes (photosynthesis and metabolism) as well as in stress adaptation, was observed by analyzing in detail the selected landrace (VR).
An interesting finding was that the expression level of heat shock-related protein (HSP70 and HSP90) and of a GRP-78/Luminal-binding protein (an endoplasmic reticulum chaperone involved in response to different types of stress) increased after salt treatment. Abiotic stresses, such as salinity, usually cause protein dysfunction. Maintaining proteins in their functional conformations thereby preventing the aggregation of non-native proteins is particularly important for cell survival under stress. Heat-shock proteins (HSPs)/chaperones are responsible for protein folding, assembly, translocation, and degradation in many normal cellular processes; they also stabilize proteins and membranes, and can assist in protein refolding under stress conditions (Wang et al., 2004). Data presented in this paper are supported by previous findings showing that at late developmental stages, when seeds undergo dehydration, LEA proteins, also regarded as chaperonins, are synthesized as part of the developmental program. Moreover, salinity triggers an abscisic acid (ABA)-mediated response that induces dehydrin accumulation in embryo cells (especially in the nucleus). This could imply a role for dehydrins as protective molecules for DNA when the cells are undergoing the normal dehydration process. Under salinity, however, dehydration could be drastically exacerbated, thereby favoring chaperonin accumulation (Burrieza et al., 2012). In Arabidopsis thaliana cell suspension cultures, the expression of HSP70 also increased under salt stress (Ndimba et al., 2005). Worthy of notice was the reduced content of a member of the peptidyl-prolyl cis-trans isomerase family, also called cyclophilins, known to assist protein folding by accelerating the isomerization of Xaa-Pro bonds, which is a rate-limiting step in the folding process of some proteins. This could be explained by the general decrease of proteins, including the substrates of cyclophilins.
Other proteins of quinoa seeds that responded to salinity are involved in the photosynthetic machinery, i.e., RuBisCO and plastid movement impaired protein. The RuBisCO enzyme is sensitive to salt stress as revealed by enhanced expression in leaves of salt-treated Triticum durum (Caruso et al., 2008). In developing embryos of B. napus L. (oilseed rape), RuBisCo acts without the Calvin cycle. This improves the carbon efficiency of developing green seeds in a metabolic context able to increase the
efficiency of carbon use during the formation of oil (Schwender et al., 2004). Although photosynthesis is usually negatively affected by salinity, the enhanced expression of RuBisCO without the Calvin cycle could be involved in plant adaptation to salt stress at the seed level.
The Plastid Movement Impaired protein is required for regulation of chloroplast position in cells in order to reduce their avoidance. Unfortunately, it is difficult to assign a specific function in seed tissues to this protein directly involved in movement of plastids in response to light and normally expressed in leaves. We can only speculate that salt stress and, more generally, abiotic stress cause changes in the expression level of this protein. Salt stress also seemed to perturb proteins involved in respiration. In fact, the expression of mitochondrial ATP synthase was up-regulated in seeds of salt-treated quinoa plants. Mitochondrial ATP synthase is a key enzyme in plant metabolism and upregulation of its activity might be required in response to stressful conditions such salt stress. Increased production of ATP might fuel all the metabolic pathways generally involved in plant homeostasis. In addition, it has been proposed that increased activity of ATP synthase creates the driving force for Na+ transport by the Salt Overly
Sensitive1 (SOS1) membrane-localized proteins, whose activity is currently regarded as a strong basis for salt tolerance in plants (Zhu, 2003). Over-expression of an ATP synthase gene in Arabidopsis suspension-cultured cells increased resistance to salt, drought, oxidative, and cold stresses (Zhang et al., 2008). Up-regulation of SOS1 gene expression was also reported for Chilean landraces of quinoa grown on saline media (Ruiz-Carrasco et al., 2011).
Salinity also affected three other main protein categories. Increased expression levels were observed for ion transport proteins (e.g., a cation/H+ antiporter), and for pantothenate
kinase, and helicase carboxy-terminal domain protein involved in metabolism and cell division, respectively. The over-expression of these proteins during stress, and more specifically salt stress, has been reported in several studies. In particular, expression of the cation antiporter was found to increase in salt-treated tomato plants; the protein plays an important role in adaptation to salinity by improving K+ accumulation
(Rodriguez-Rosales et al., 2008). Pantothenate kinase activity plays a critical role in regulating intracellular coenzyme A (CoA) levels in bacteria and animals. In plants, pantothenate kinase activity was first reported in stroma of spinach chloroplasts, but little is known about the role of this enzyme (Tilton et al., 2006). Pantothenate, also known as vitamin B5 or “anti-stress vitamin,” is part of the water-soluble B vitamin group. It is the key precursor of CoA and acyl carrier protein, which are essential co-factors for many metabolic enzymes (Raman and Rathinasabapathi, 2004). It was suggested that an increased level of CoA, mediated by an increased activity of pantothenate kinase, may be responsible for improved plant growth and stress resistance (Rubio et al., 2008). The main function of helicase is to bind ATP and to catalyze the reaction that drives the unwinding of DNA or RNA helix. Over-expression of this protein is one of the first cellular responses to stress conditions. Thus, pea DNA helicase was stimulated by salinity and cold stress in
both shoots and roots (Vashisht et al., 2005). Moreover, DNA helicase 45 mRNA was induced in pea seedlings in response to high concentrations of salt and overexpression of this protein in transgenic tobacco plants conferred salinity tolerance, suggesting an important target pathway for manipulating stress tolerance in crop plants (Sanan-Mishra et al., 2005).
Ethylene Insensitive 3-like 1 protein is probably a transcription factor acting as positive regulator in the ethylene signaling pathway. The expression of this protein decreased in salt-treated quinoa seeds. Ethylene plays important roles in multiple aspects of plant growth and development and its biosynthesis is induced by many stresses. However, its role in salt stress is uncertain.Cao et al. (2007)reported that alteration of ethylene signaling in Arabidopsis mutants affected salt-stress responses. El-Iklil and coworkers showed that lower ethylene production was associated with salt tolerance in tomato treated with high salt concentrations (El-Iklil et al., 2000), whereas higher ethylene production has been suggested as an indicator for salt tolerance in rice seeds (Khan et al., 1987). No information is available on the hormonal responses to abiotic stress in quinoa, except for one report on increased ABA levels under drought (Jacobsen et al., 2009).
The category exhibiting the greatest variation in expression levels under salinity was the functional category of seed storage proteins. Storage proteins accumulate in developing seeds as a source of nitrogen, carbon, sulfur, and amino acids for use in germination and growth of developing seedlings. Globulins generally fall into two major groups based on these coefficients: the 7-8S vicilin type and the 11-12S legumin type. Because legumin-type seed storage proteins vary in size, the 11-12S globulins are collectively referred to as legumins in other species (Balzotti et al., 2008). In our study, proteins belonging to this category were the 11S globulin A or B, and the legumin β-like. The 11S globulins are the major storage proteins in most legumes and in many other dicots (e.g., brassicas, composites, and cucurbits) and in some cereals (oats and rice;Shewry et al., 1995). Also known as chenopodin, the 11S globulin is the major seed storage protein of quinoa. We found two different subunits of chenopodin; A and B subunit. The 11S globulin is a hexamer consisting of six pairs of acidic (34–36 kDa) and basic subunits (22–24 kDa), with each subunit pair connected by a disulfide bond (Brinegar and Goundan, 1993). Recently, the quinoa 11S globulin gene has been suggested to belong to a multigene family (Stevens et al., 2006), as in other species (Shewry et al., 1995). These proteins are related to each other based on their primary structures, with homologies reaching 63% between soybean proA1aB1b and pea prolegumin (Tandang-Silvas et al., 2010).
In the present paper, the 11S seed storage globulin displayed the strongest decrease in salt-treated samples as compared with controls; in fact, in all analyses we found a substantial down-regulation of these proteins and even a complete absence of the corresponding spots in 2DE gels. The decrease in total protein content (Ruiz et al., 2016a) and in percentage content of the albumin/globulin fraction is thus ascribable to the severe reduction of the major seed storage protein, chenopodin. Decreased protein content with increasing salinity can also be
attributed to disturbance in nitrogen metabolism or inhibition of nitrate absorption through reduced water uptake and decreased root permeability (Karyotis et al., 2003; Pulvento et al., 2012). The legumin β-like protein displayed an opposite trend insofar as the spot intensity increased in salt-treated samples. Legumin holoproteins are composed of six nearly identical subunits with molecular weights of 50–60 kDa. Each subunit is composed of two differently sized polypeptide chains. The larger more hydrophilic one (30–40 kDa) is named α-chain, whereas the smaller more hydrophobic one (20 kDa) is named β-chain (Müntz, 1996). A relatively lower decrease in energy-rich storage compounds, such as storage proteins (legumin-like and 11S seed storage protein) was found in tolerant wheat genotypes than in less tolerant and sensitive genotypes upon cold treatment (Kosová et al., 2015). In soybean seeds, β-conglycinin and glycinin are the two major storage proteins; sulfur deficiency caused a substantial decrease in the level of glycinins and a concomitant increase in β-conglycinins; the subunit composition of these proteins was also affected (Gayler and Sykes, 1985). The crude acid-soluble globulin seemed not to be affected by growing quinoa under salinity, but since a crude extract and not a purified or highly enriched fraction (as was done for the 11S globulin) was analyzed, we cannot exclude possible changes in protein expression and content. Prolamin-related proteins likewise did not show evident changes in the presence of salt. This is probably due to the low amount of these peptides in gluten-free seeds such as those of quinoa. However, also in this case, we cannot exclude slight changes in this fraction, which represents a very interesting research topic with respect to gluten allergy also in so-called gluten-free crops.
Amino Acid Profiles
The amino acid profile of quinoa is one of its major nutritional attributes as it contains all the essential amino acids (Escuredo et al., 2014). The amino acid composition of quinoa seeds of cultivars from the Andean highlands (Bolivia/Argentina) and Argentinian Northwest were shown to vary depending on genotype and area of cultivation (González et al., 2011). Changes in the amino acid profile under drought and salinity, alone or combined, have been described in wild and cultivated barleys (Ahmed et al., 2013), but not in quinoa. In barley, the contents of all amino acids (except Met) were significantly increased relative to controls under drought alone or under combined stress in all genotypes, whereas they decreased or remained unchanged under salinity alone. Present results confirm the strongly genotype-dependent amino acid profile, both under control and salinized conditions, in the three Chilean landraces analyzed. Unexpectedly, the profiles of R49 (salares ecotype) and VR (coastal lowlands ecotype) were more similar than those of VR and VI-1, which belong to the same ecotype.
The non-essential amino acids Ala, Pro, and Cys were generally the most abundant PAAs in all three landraces. With the exception of VI-1, Pro was also the most abundant free amino acid; it was one of the few whose content was unaltered or enhanced by salinity in all three landraces, including VI-1. Induction of free amino acids in response to abiotic stress