Global surveillance of cancer survival 1995–2009:
analysis of individual data for 25 676 887 patients from
279 population-based registries in 67 countries (CONCORD-2)
Claudia Allemani, Hannah K Weir, Helena Carreira, Rhea Harewood, Devon Spika, Xiao-Si Wang, Finian Bannon, Jane V Ahn, Christopher J Johnson,
Audrey Bonaventure, Rafael Marcos-Gragera, Charles Stiller, Gulnar Azevedo e Silva, Wan-Qing Chen, Olufemi J Ogunbiyi, Bernard Rachet,
Matthew J Soeberg, Hui You, Tomohiro Matsuda, Magdalena Bielska-Lasota, Hans Storm, Thomas C Tucker, Michel P Coleman,
and the CONCORD Working Group*
Summary
Background
Worldwide data for cancer survival are scarce. We aimed to initiate worldwide surveillance of cancer
survival by central analysis of population-based registry data, as a metric of the eff ectiveness of health systems, and to
inform global policy on cancer control.
Methods
Individual tumour records were submitted by 279 population-based cancer registries in 67 countries for
25·7 million adults (age 15–99 years) and 75 000 children (age 0–14 years) diagnosed with cancer during 1995–2009
and followed up to Dec 31, 2009, or later. We looked at cancers of the stomach, colon, rectum, liver, lung, breast
(women), cervix, ovary, and prostate in adults, and adult and childhood leukaemia. Standardised quality control
procedures were applied; errors were corrected by the registry concerned. We estimated 5-year net survival, adjusted
for background mortality in every country or region by age (single year), sex, and calendar year, and by race or ethnic
origin in some countries.
Estimates were age-standardised with the International Cancer Survival Standard weights.
Findings
5-year survival from colon, rectal, and breast cancers has increased steadily in most developed countries. For
patients diagnosed during 2005–09, survival for colon and rectal cancer reached 60% or more in 22 countries around
the world; for breast cancer, 5-year survival rose to 85% or higher in 17 countries worldwide. Liver and lung cancer
remain lethal in all nations: for both cancers, 5-year survival is below 20% everywhere in Europe, in the range 15–19%
in North America, and as low as 7–9% in Mongolia and Thailand. Striking rises in 5-year survival from prostate
cancer have occurred in many countries: survival rose by 10–20% between 1995–99 and 2005–09 in 22 countries in
South America, Asia, and Europe, but survival still varies widely around the world, from less than 60% in Bulgaria
and Thailand to 95% or more in Brazil, Puerto Rico, and the USA. For cervical cancer, national estimates of 5-year
survival range from less than 50% to more than 70%; regional variations are much wider, and improvements between
1995–99 and 2005–09 have generally been slight. For women diagnosed with ovarian cancer in 2005–09, 5-year
survival was 40% or higher only in Ecuador, the USA, and 17 countries in Asia and Europe. 5-year survival for stomach
cancer in 2005–09 was high (54–58%) in Japan and South Korea, compared with less than 40% in other countries. By
contrast, 5-year survival from adult leukaemia in Japan and South Korea (18–23%) is lower than in most other
countries. 5-year survival from childhood acute lymphoblastic leukaemia is less than 60% in several countries, but as
high as 90% in Canada and four European countries, which suggests major defi ciencies in the management of a
largely curable disease.
Interpretation
International comparison of survival trends reveals very wide diff erences that are likely to be attributable
to diff erences in access to early diagnosis and optimum treatment. Continuous worldwide surveillance of cancer
survival should become an indispensable source of information for cancer patients and researchers and a stimulus
for politicians to improve health policy and health-care systems.
Funding
Canadian Partnership Against Cancer (Toronto, Canada), Cancer Focus Northern Ireland (Belfast, UK),
Cancer Institute New South Wales (Sydney, Australia), Cancer Research UK (London, UK), Centers for Disease
Control and Prevention (Atlanta, GA, USA), Swiss Re (London, UK), Swiss Cancer Research foundation (Bern,
Switzerland), Swiss Cancer League (Bern, Switzerland), and University of Kentucky (Lexington, KY, USA).
Copyright
©Allemani et al. Open Access article distributed under the terms of CC BY.
Introduction
The global burden of cancer is growing, particularly in
countries of low and middle income. The need to
implement eff ective strategies of primary prevention is
urgent.
1,2Prevention is crucial but long term. If WHO’s
global target of a 25% reduction in deaths from cancer
and other non-communicable diseases in people aged
30–69 years is to be achieved by 2025 (referred to as
Lancet 2015; 385: 977–1010
Published Online
November 26, 2014 http://dx.doi.org/10.1016/ S0140-6736(14)62038-9 See Comment page 926
This online publication has been corrected. The corrected version fi rst appeared at thelancet.com on Dec 8, 2014
See Online/Comment
http://dx.doi.org/10.1016/ S0140-6736(14)62251-0 *Members listed at end of report
Cancer Research UK Cancer Survival Group, Department of Non-Communicable Disease Epidemiology, London School of Hygiene & Tropical Medicine, London, UK (C Allemani PhD, H Carreira MPH, R Harewood MSc, D Spika MSc, X-S Wang PhD, J V Ahn MSc, A Bonaventure MD, B Rachet FFPH, Prof M P Coleman FFPH);
Division of Cancer Prevention and Control, Centers for Disease Control and Prevention, Atlanta, GA, USA
(H K Weir PhD); Northern
Ireland Cancer Registry, Centre for Public Health, Queen’s University Belfast, Belfast, UK
(F Bannon PhD); Cancer Data
Registry of Idaho, Boise, ID, USA (C J Johnson MPH); Unitat d’Epidemiologia i Registre de Càncer de Girona, Departament de Salut, Institut d’Investigació Biomèdica de Girona, Girona, Spain (R Marcos-Gragera PhD); South East Knowledge and Intelligence Team, Public Health England, Oxford, UK
(C Stiller MSc); Department of
Epidemiology, Universidade do Estado do Rio de Janeiro, Rio de Janeiro, RJ, Brazil
(Prof G Azevedo e Silva MD);
National Offi ce for Cancer
Prevention and Control and National Central Cancer Registry, National Cancer
25 × 25),
3we will need not only more eff ective prevention
(to reduce incidence) but also more eff ective health
systems (to improve survival).
4In the fi rst international comparison of cancer survival,
a transatlantic study of patients diagnosed during
1945–54, survival for 12 cancers in three US states was
typically higher than in six European countries.
5In 2008,
a global comparison of population-based cancer survival
(CONCORD) showed very wide variations in survival
from cancers of the breast (women), colon, rectum, and
prostate.
6That analysis included 1·9 million adults
(age 15–99 years) diagnosed with cancer during 1990–94
and followed up until 1999 from 31 countries (16 with
100% population coverage) on fi ve continents.
Three large international comparisons of cancer
survival have been published since 2008. The European
cancer registry study on survival (EUROCARE)-5
provided survival estimates for all cancers for patients
diagnosed during 2000–07 in 29 countries in Europe.
7In
SurvCan (cancer survival in Africa, Asia, the Caribbean,
and Central America), relative survival estimates were
reported for patients diagnosed during 1990–2001 in
12 low-income and middle-income countries.
8The
International Cancer Benchmarking Partnership
published survival estimates for four common cancers
for patients diagnosed during 1995–2007 in six
high-income countries.
9These three studies diff er with respect
to geographic and population coverage, calendar period,
and analytical methods and do not enable worldwide
comparison of cancer survival.
Surveillance of cancer survival is seen as important by
national and international agencies, cancer patient
advocacy groups, departments of health, politicians, and
research agencies. Cancer survival research is being used
to formulate cancer control strategies,
9to prioritise cancer
control measures,
10and to assess both the eff ectiveness
11,12and cost-eff ectiveness
13of those strategies.
We designed CONCORD-2 to initiate long-term
worldwide surveillance of cancer survival on the broadest
possible basis. Our aim is to analyse progress toward the
overarching goal in the Union for International Cancer
Control’s World Cancer Declaration 2013: “there will be
major reductions in premature deaths from cancer and
improvements in quality of life and cancer survival”.
14Methods
Cancer registries
We identifi ed population-based cancer registries that were
operational in 2009 and had either published reports on
survival or were known to follow up registered cancer
patients to establish their vital status. Many registries had
met quality criteria for inclusion in either the quinquennial
compendium Cancer Incidence in Five Continents,
15,16published by the International Association of Cancer
Registries (IACR) and the International Agency for
Research on Cancer (IARC), or similar compendia; other
registries were established more recently.
We invited all these registries to contribute data for
patients diagnosed during all or part of the 15-year
period 1995–2009, including data on their vital status at
least 5 years after diagnosis, or at Dec 31, 2009, or a
later year. Of 395 registries invited, 306 (77%) agreed to
participate: of these, 24 (8%) did not submit data, either
because of resource constraints (n=4), legal constraints
(1) or reversal of the original decision (3), or because
they could not provide complete follow-up data (6) or
did not respond to further communication (10).
We excluded three registries because they provided data
that did not adhere to the protocol and could not be
rectifi ed, leaving 279 participating registries (71% of
those invited).
Among the cancers suggested by participating registries,
the ten we prioritised for study (referred to as index sites)
accounted collectively for almost two-thirds of the
estimated global cancer burden in 2008, both in developed
and developing countries.
4They comprised cancers of the
stomach, colon, rectum, liver, lung, breast (women),
cervix, ovary, and prostate in adults (age 15–99 years), and
leukaemia in adults, and precursor-cell acute
lympho-blastic leukaemia in children (age 0–14 years).
Ethics approval
We obtained approval for CONCORD-2 from the Ethics
and Confi dentiality Committee of the UK’s statutory
National Information Governance Board (now the Health
Research Authority; ECC 3-04(i)/2011) and the National
Health Service (NHS) research ethics service (southeast;
11/LO/0331). We obtained separate statutory or ethics
approval (or both) in more than 40 other jurisdictions to
secure the release of data. Registries in all other
jurisdictions obtained their own ethics approval locally.
We applied strict security constraints to the
transmission of data fi les. We gave every registry a set of
unique numeric codes for the name of every fi le; these
codes have no meaning outside the CONCORD-2 study.
All data fi elds were numeric or coded. We developed a
fi le transmission utility deploying 256-bit advanced
encryption security, with random, strong, one-time
passwords that were generated automatically at the point
of data transmission but sent separately, thus eliminating
the need for email or telephone exchanges to confi rm
passwords. We also provided free access to a similar
commercial utility (HyperSend; Covisint, Detroit, MI,
USA) that complies with US federal law on the secure
transmission of sensitive health data.
Protocol
We fi nalised the protocol (in which we defi ned the data
structure, fi le transmission procedures, and statistical
analyses) after a 2-day meeting in Cork, Ireland, in
September, 2012, with 90 members of the CONCORD
Working Group from 48 countries (the protocol was
revised by October, 2012). English poses a communication
barrier in many countries; therefore, native speakers
Center, Beijing, China
(W-Q Chen PhD); Ibadan Cancer
Registry, University City College Hospital, Ibadan, Nigeria
(Prof O J Ogunbiyi FWACP);
New South Wales Central Cancer Registry, Australian Technology Park (M J Soeberg PhD), and Cancer Institute NSW
(H You MAppStats), Sydney,
NSW, Australia; Population-Based Cancer Registry Section, Division of Surveillance, Center for Cancer Control and Information Services, National Cancer Center, Tokyo, Japan
(T Matsuda PhD); Department
of Health Promotion and Postgraduate Education, National Institute of Public Health and National Institute of Hygiene, Warsaw, Poland
(Prof M Bielska-Lasota MD);
Cancer Prevention and Documentation, Danish Cancer Society, Copenhagen, Denmark
(H Storm MD); and Kentucky
Cancer Registry, University of Kentucky, Lexington, KY, USA
(Prof T C Tucker PhD) Correspondence to: Prof M P Coleman, Cancer Research UK Cancer Survival Group, Department of Non-Communicable Disease Epidemiology, London School of Hygiene & Tropical Medicine, London WC1E 7HT, UK
For the protocol see http:// www.lshtm.ac.uk/eph/ncde/ cancersurvival/research/concord/ protocol/index.html
translated the protocol into Chinese (Mandarin),
Portuguese, and Spanish, and other native speakers did
back-translation to check the translation against the
English original. We made the protocol available in all
four languages. We held protocol workshops in Argentina
(for Spanish-speaking South American researchers),
Brazil, China, India, Japan, Puerto Rico, Russia, and the
USA (for North America), which we followed up with
conference calls and online seminars. We responded to
telephone or email queries in Chinese, English, French,
Italian, Portuguese, and Spanish.
We defi ned countries, states, and world regions by
their UN names and codes (as of 2007).
17Only Cuba and
Puerto Rico provided data from the Caribbean and
Central America so we grouped them with South
America as America (Central and South). We wrote this
Article and prepared the maps without prejudice to the
status, boundaries, or name of any country, territory, or
region. We have shortened some names for convenience
(eg, Korea for South Korea), which does not have any
political signifi cance. We created world maps and
27 regional maps in ArcGIS version 10, using digital
boundaries (shapefi les) of countries and subnational
regions from the Database of Global Administrative
Areas (GADM 2.0).
18We obtained national populations
for 2009 from the UN Population Database
17or national
authorities (Canada, Portugal, and the UK) and
subnational populations from the relevant registries.
We defi
ned solid tumours by anatomical site
(topography) and leukaemia by morphology (table 1).
We coded topography and morphology according to the
International Classifi cation of Diseases for Oncology
(3rd edn; ICD-O-3).
19For ovarian cancer, we included the
fallopian tube, uterine ligaments, and adnexa, and the
peritoneum and retroperitoneum, where high-grade
serous ovarian carcinomas are often detected.
We excluded Kaposi’s sarcoma and solid tumours with
lymphoma morphology.
The classifi cation of leukaemias and lymphomas has
changed since the mid-1990s. To minimise diff erences in
the range of leukaemia subtypes included in our analyses,
we asked registries to provide data for all haemopoietic
malignant diseases in adults and children, as defi ned by
the ICD-O-3 morphology code range 9590–9989.
In consultation with specialists in the cancer
registry-based project on haematologic malignancies
(HAEMACARE) group,
20we selected subtypes of adult
leukaemia from nine morphology groups,
21excluding
myelodysplastic and myeloproliferative neoplasms such
as chronic myeloid leukaemia (appendix p 2).
Precursor-cell acute lymphoblastic leukaemia is the most common
form of leukaemia in children; we included
HAEMACARE group 15—a relatively homogeneous
group comprising precursor-cell lymphoblastic
lymphoma and precursor-cell lymphoblastic leukaemia
(B-cell, T-cell, and not otherwise specifi ed), and we refer
to these six entities as acute lymphoblastic leukaemia.
22For survival analyses, we included only invasive primary
malignant diseases (ICD-O-3 behaviour code 3). To
facilitate quality control and comparisons of the intensity
of early diagnostic and screening activity, however, we
asked registries to submit data for all solid tumours at
each index site, including those that were benign
(behaviour code 0), of uncertain or borderline malignancy
(1), or in situ (2).
We asked registries to submit full dates (day, month,
year) for birth, diagnosis, and death or last known vital
status, both for quality control and to enable comparable
estimation of survival.
23When the day of diagnosis or the
day or month of birth or last known vital status were
missing, we developed an algorithm to standardise the
imputation of missing dates for all populations (details
available on request). Participating registries completed a
detailed question naire on their methods of operation,
including data defi nitions, data collection procedures,
coding of anatomical site, morphology and behaviour,
the tracing of registered cancer patients to ascertain their
vital status, and how tumour records are linked with data
on vital status.
We included patients who were diagnosed with two or
more primary cancers at diff erent index sites during
1995–2009 in the analyses for each cancer—eg, colon
cancer in 2000, breast cancer in 2005. We measured
survival from the date of diagnosis until the date of death,
or loss to follow-up, or censoring. When two or more
See Online for appendix
Topography or morphology codes* Description Stomach C16·0–C16·6, C16·8–C16·9 Stomach
Colon C18·0–C18·9, C19·9 Colon and rectosigmoid junction Rectum C20·9, C21·0–C21·2, C21·8 Rectum, anus, and anal canal Liver C22·0–C22·1 Liver and intrahepatic bile ducts Lung C34·0–C34·3, C34·8–C34·9 Lung and bronchus Breast
(women)
C50·0–C50·6, C50·8–C50·9 Breast
Cervix C53·0–C53·1, C53·8–C53·9 Cervix uteri
Ovary† C48·0–C48·2, C56·9, C57·0–C57·4, C57·7–C57·9 Ovary, fallopian tube, and uterine ligaments, other and unspecifi ed female genital organs, peritoneum and retroperitoneum
Prostate C61·9 Prostate gland
Leukaemia (adults)‡ 9670, 9687, 9727, 9728, 9729, 9800, 9801, 9805, 9820, 9823, 9826, 9832, 9833, 9835, 9836, 9837, 9840, 9860, 9861, 9866, 9867, 9870, 9871, 9872, 9873, 9874, 9891, 9895, 9896, 9897, 9910, 9920, 9930, 9931, 9940, 9984, 9987 Leukaemia Leukaemia (children)‡
9727, 9728, 9729, 9835, 9836, 9837 Precursor-cell acute lymphoblastic leukaemia
*International Classifi cation of Diseases for Oncology, 3rd edn (ICD-O-3).19 We defi ned solid tumours with topography
(anatomical site) codes. †Includes peritoneum and retroperitoneum (C48·0–C48·2), where ovarian cancers of high-grade serous morphology are frequently detected; also includes the fallopian tube, uterine ligaments, and adnexa (C57·0–C57·4), and other and unspecifi ed female genital organs (C57·7–C57·9). ‡We defi ned adult leukaemia subtypes with morphology codes in HAEMACARE groups 6, 11, 15, 17, 18, 19, 20, 21, and 22 (appendix p 2).20 The six
morphology codes used to defi ne precursor-cell acute lymphoblastic leukaemia (referred to as acute lymphoblastic leukaemia) in children are those in HAEMACARE group 15 only.
primary malignant diseases occurred at the same index
site during 1995–2009, we included the fi rst cancer only.
We retained the most complete record for patients with
synchronous primary cancers in the same organ.
North American registries defi ne multiple primary
cancers under the rules of the Surveillance, Epidemiology
and End Results (SEER) programme,
24whereas registries
in the European Network of Cancer Registries (ENCR)
and elsewhere generally use the rules of the IACR,
25which are more conservative. The North American
Association of Central Cancer Registries (NAACCR)
prepared a program to enable all North American
registries to recode their entire incidence databases to
the IACR multiple primary rules, before their datasets
for 1995–2009 were extracted for CONCORD-2.
Quality control
The quality and completeness of cancer registration data
can aff ect both incidence and survival estimates and,
thus, the reliability of international comparisons.
26We developed a suite of quality control programs,
27extending the checks used in the fi rst CONCORD study,
6cross-checked with those used in the EUROCARE
study,
28IARC/IACR tools for cancer registries,
29and
WHO’s classifi cation of tumours.
22,30–32We applied these
checks systematically in three phases and sent registries
a detailed report on how to revise and resubmit their
data, if needed, after every phase.
First, we sent registries a protocol adherence report
that showed, for every cancer, the proportion of tumour
records that were coded in compliance with the protocol.
Second, we checked the data in every tumour record for
logical coherence against 20 sets of criteria, including
eligibility (eg, age, tumour behaviour), defi nite errors
(eg, sex-site errors and invalid dates or date sequence),
and possible errors including a wide range of
inconsistencies between age, tumour site, and
morphology.
27We sent registries exclusion reports that
showed, for every index cancer and calendar period, the
number of tumour records in each category of defi nite or
possible error, the number of tumours registered from a
death certifi cate only or detected at autopsy, and the
number of patients whose data could be included
in survival analyses. When we identifi ed errors in
classifi
cation, coding, or pathological assignment,
we asked registries to correct and resubmit their data.
Finally, we analysed: the proportion of tumour records
with morphological verifi
cation or non-specifi c
morphology; distributions of the day and month of birth,
diagnosis, and last known vital status; and proportions of
patients who died within 30 days, were reported as lost to
follow-up, or were censored within 5 years of diagnosis.
Follow-up for vital status
Cancer registries use various methods to ascertain the
vital status (alive, dead, emigrated, lost to follow-up) of
registered cancer patients. In countries with limited
administrative infrastructure, so-called active follow-up
can be used to establish vital status via direct contact with
the patient, the family, or a local authority (eg, a village
headman), or by home visit. Many registries in both
high-income and low-income countries also seek
information from the hospital or the treating clinician in
hospital or primary care.
Most registries link their database with a regional or
national index of deaths, using identifi ers such as name,
sex, date of birth, and identity number. Tumour records
that match to a death record are updated with the date of
death. Many registries also use other offi
cial databases
(eg, hospital and primary care databases, social insurance,
health insurance, drivers’ licences, and electoral registers)
to establish the date on which a patient was last known or
believed to have been alive, to have migrated within the
country, or to have emigrated to another country. Cancer
registrations are updated with the vital status and the
date of last known vital status. These methods are
typically summarised as passive follow-up.
Some registries receive information on the vital status
of all registered patients on an almost continuous basis,
or at least every month or every 3 months. Other registries
seek to trace the vital status of patients registered in a
particular calendar year only, 1 year or even 5 years after
the end of that year: this approach can increase the
proportion of patients lost to follow-up. It also means that
5-year survival estimates for more recently diagnosed
patients cannot be obtained, even with the period
approach.
We asked all 279 participating registries how they
ascertained the vital status of registered cancer patients.
Of 243 registries that responded to the question,
147 (60%) stated that they used only passive follow-up,
92 (38%) that they used both passive and active follow-up,
and four (2%) only active follow-up.
Statistical analysis
Most registries submitted data for patients diagnosed
from 1995 to 2009, with follow-up to 2009 or later; some
registries only began operation after 1995 or provided
data for less than 15 years. We were able to estimate
5-year survival using the cohort approach for patients
diagnosed in 1995–99 and 2000–04, because in most
datasets, all patients had been followed up for at least
5 years. We used the period approach
33to estimate 5-year
survival for patients diagnosed during 2005–09, because
5 years of follow-up data were not available for all patients
(appendix p 174).
We estimated net survival up to 5 years after diagnosis
for both adults and children. Net survival represents the
cumulative probability that the cancer patients would
have survived a given time, say 5 years
or more after
diagnosis, in the hypothetical situation that the cancer
was the only possible cause of death. Net survival can be
interpreted as the proportion of cancer patients who
survive up to that time, after eliminating other causes of
death (background mortality). We used the recently
developed Pohar Perme estimator
34of net survival
imple-mented with the program stns
35in Stata version 13.
36This
estimator takes unbiased account of the fact that older
patients are more likely than younger patients to die
from causes other than cancer—ie, that the competing
risks of death are higher for elderly cancer patients.
To control for the wide diff erences in background
mortality between participating jurisdictions and over
time, we constructed 6514 life tables of all-cause mortality
in the general population of each country or the territory
covered by each participating registry, by age (single
year), sex, and calendar year of death, and by race or
ethnic origin in Israel (Arab, Jewish), Malaysia (Chinese,
Malay, Indian), New Zealand (Māori, non-Māori), and the
USA (Black, White). The method of life table construction
depended on whether we received raw data (numbers of
deaths and populations) or mortality rates, and on
whether the raw data or the mortality rates were by single
year of age (so-called complete) or by 5-year or 10-year
age group (abridged). We checked the life tables by
examination of age-sex-mortality rates, life expectancy at
birth (appendix p 175), the probability of death in the age
bands 15–59 years, 60–84 years, and 85–99 years and,
where necessary, the model residuals.
Of the 279 participating registries, 21 provided
complete life tables that did not need interpolation or
smoothing, for each calendar year. For 172 registries,
we obtained raw data from either the registry, the
relevant national statistical authority, or the Human
Mortality Database.
37We derived life tables for 1996 and
2010 if possible, each centred on three calendar years of
data (eg, 1995–97, 2009–11) to increase the robustness of
the rates. We modelled raw mortality rates with Poisson
regression and fl exible functions to obtain smoothed
complete life tables extended up to age 99 years. We then
created life tables for every calendar year from 1997 to
2009 by linear interpolation between the 1996 and 2010
life tables.
38Rather than extrapolate, we used the 1996
life table for 1995.
62 of 279 registries provided abridged mortality rates,
or complete mortality rates that were not smoothed.
We used the Ewbank relational model
39with three or
four parameters to interpolate (if abridged) and smooth
the mortality rates for the registry territory against a
high-quality smooth life table for a country with a similar
pattern of mortality by age. We could not obtain reliable
data on all-cause mortality for 24 registries. We took
national life tables published by the UN Population
Division
40and interpolated and extended them to
age 99 years with the Elandt-Johnson method.
41For each country and registry, we present estimates of
age-standardised net survival for each cancer at 5 years
after diagnosis. We report cumulative survival probabilities
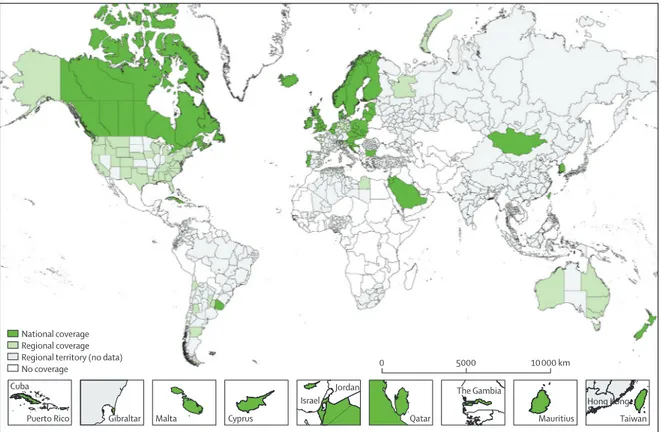
Figure 1: Participating countries and regions (adults)
National registries in smaller countries are shown in boxes at diff erent scales. 28 regional maps and a world map for childhood acute lymphoblastic leukaemia are in the appendix (pp 112–40).
National coverage Regional coverage Regional territory (no data)
No coverage 0 5000 10 000 km
Cuba
Puerto Rico Gibraltar Malta Cyprus
Israel Jordan Qatar Mauritius Hong Kong The Gambia Taiwan
as percentages. For adults, we used the International
Cancer Survival Standard (ICSS) weights, with age at
diagnosis categorised into fi ve groups: 15–44 years,
45–54 years, 55–64 years, 65–74 years, and 75–99 years for
eight solid tumours and leukaemia in adults; and
15–54 years, 55–64 years, 65–74 years, 75–84 years, and
85–99 years for prostate cancer.
42For children, we
estimated survival for the age groups 0–4 years, 5–9 years,
and 10–14 years; we obtained age-standardised estimates
by assigning equal weights to the three age-specifi c
estimates.
43We derived CIs for both unstandardised and
age-standardised survival estimates assuming a normal
distribution, truncated to the range 0–100. We derived SEs
with the Greenwood method
44to construct the CIs
We did not estimate survival if fewer than ten patients
were available for analysis. If between ten and 49 patients
were available for analysis in a given calendar period
(1995–99, 2000–04, 2005–09), we merged data for
two consecutive periods. For less common cancers in the
smallest populations, we sometimes needed to merge data
for all three periods. When between ten and 49 patients in
total were available, we only estimated survival for all ages
combined. If 50 or more patients were available,
we attempted survival estimation for each age group. If an
age-specifi c estimate could not be obtained, we merged
data for adjacent age groups and assigned the combined
estimate to both age groups. If two or more age-specifi c
estimates could not be obtained, we present only the
unstandardised estimate for all ages combined.
Role of the funding sources
The funders had no role in study design, data collection,
data analysis, data interpretation, or writing of the report.
The corresponding author had full access to all data in
the study and had fi nal responsibility for the decision to
submit for publication.
Results
279 cancer registries from 67 countries provided data for
this study (fi gure 1; appendix pp 112–40). Nine African
countries took part (ten registries), eight countries were
in Central and South America (27 registries), Canada and
the USA comprised North America (57 registries),
16 countries were in Asia (50 registries), 30 European
countries participated (128 registries), and New Zealand
and Australia represented Oceania (seven registries). For
countries with less than 100% coverage of the population,
the country name is used for brevity in the text (eg, Libya,
the USA), but a more accurate term is used in the tables
(eg, Libya [Benghazi], US registries). Some registries
provided data for only part of their territory.
We examined records for 28 685 445 patients diagnosed
with cancer of the stomach, colon, rectum, liver, lung,
breast (women), cervix, ovary, and prostate in adults
(age 15–99 years), leukaemia in adults, and precursor-cell
acute lymphoblastic leukaemia in children (age 0–14 years)
during the period 1995–2009 (table 2). Of these,
1 682 081 (5·9%) records were for an in situ cancer, mostly
of the cervix, breast, colon, or prostate. The proportions of
in situ cancer are not comparable directly because some
registries do not record in situ cancer, others did not
submit data for index sites in which in situ malignant
disease is common, and screening programmes in which
in situ cancers are frequently detected were introduced in
some countries during 1995–2009. The variation between
continents is still of interest: for example, a little over 1%
of cervical cancers in African registries were in situ,
compared with 20% in Central and South American
registries and 81% in Oceania. For breast cancer in situ,
the variation was from 0·1% in African registries to 16%
in North American registries and about 4–5% in other
regions of the world (appendix pp 3–63). Patients with
in situ cancer were not included in survival analyses.
We excluded a further 360 773 (1·3%) patients either
because their year of birth, month or year of diagnosis, or
year of last vital status were unknown, or because the
tumour was not primary invasive malignant disease
(behaviour code 3) or the morphology was that of Kaposi’s
sarcoma or lymphoma in a solid organ, or for other
reasons (table 2). The proportion of patients with an
unknown date of last vital status ranged from 0% to 40%
or more for some cancers in some African registries.
Proportions are presented in the appendix (pp 3–63) for
each registry, for all cancers combined, and for each
cancer separately.
Of 26 642 591 patients eligible for inclusion in the
survival analyses, 905 841 (3·4%) were excluded because
their cancer was registered from a death certifi cate only
or discovered at autopsy (table 2), and 59 863 (0·2%) were
excluded for other reasons, including defi nite errors
(eg, unknown vital status or sex, sex-site error, or invalid
dates or sequence of dates) or possible errors (eg, apparent
inconsistencies between age, cancer site, and morphology)
for which the record was not later confi rmed as correct by
the relevant registry.
Of 25 676 887 patients available for survival analyses
(96·4% of those eligible), pathological evidence of
malignant disease (histological, cytological, or
haema-tological fi ndings) was available for 23 338 015 patients
for all cancers combined (91·1%; table 2), ranging from
83·1% in Asian registries, 85·5% in African registries,
and 87·4% in Central and South American registries to
90–95% in Europe, Oceania, and North America. The
range of pathological evidence at a national level was very
wide, from 15% in The Gambia, 36% in Mongolia, and
66% in Chinese registries, up to 99% or more in Belgium,
Mauritius, and Sweden. For 938 703 (3·7%) patients,
morphological features were poorly specifi ed (eg,
malignant neoplasm or tumour, ICD-O-3 codes
8000–8005): this proportion also varied widely, from
around 1% in North American registries to 17% for all
African registries combined and as high as 59% in
The Gambia. Data for every registry are shown in the
appendix (pp 3–63).
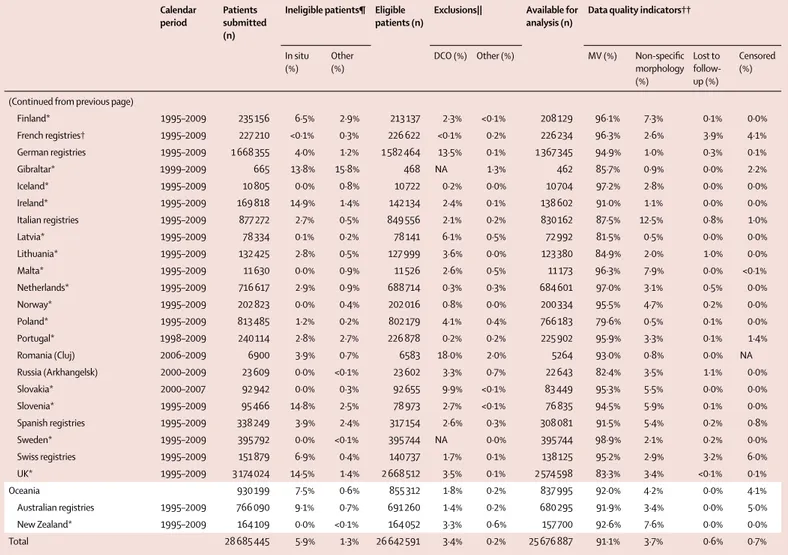
Calendar period
Patients submitted (n)
Ineligible patients¶ Eligible patients (n)
Exclusions|| Available for analysis (n)
Data quality indicators††
In situ (%)
Other (%)
DCO (%) Other (%) MV (%) Non-specifi c morphology (%) Lost to follow-up (%) Censored (%) Africa 23 325 0·2% 39·5% 14 048 1·4% 9·6% 12 509 85·5% 17·0% 10·2% 28·8% Algerian registries 1995–2009 6919 <0·1% 5·8% 6515 0·3% 17·4% 5358 93·8% 12·3% 0·0% 21·5% Lesotho (childhood)† 1995–2009 22 0·0% 0·0% 22 0·0% 0·0% 22 100·0% 0·0% 0·0% 11·8% Libya (Benghazi) 2003–2005 1698 0·0% 0·4% 1692 8·9% 0·5% 1533 84·4% 16·5% 0·0% 32·4% Mali (Bamako) 1995–2009 1007 0·0% 78·3% 219 5·0% 2·3% 203 58·6% 41·4% 83·7% 6·4% Mauritius* 2005–2005 855 0·0% 0·6% 850 0·0% 0·9% 842 100·0% 24·1% 0·0% NA Nigeria (Ibadan) 1998–2007 2192 2·1% 60·1% 830 0·6% 3·6% 795 70·8% 0·0% 8·9% 65·1% South Africa (Eastern Cape) 1998–2007 2404 0·0% 2·9% 2335 0·1% 4·4% 2230 70·5% 32·8% 45·7% 25·1%
The Gambia* 1995–1997 387 0·0% 10·1% 348 0·9% 10·3% 309 15·2% 58·9% 3·2% 14·2%
Tunisia (Central) 1995–2007 7841 0·1% 84·1% 1237 NA 1·6% 1217 99·1% 1·0% 0·7% 51·2% America (Central and South) 467 456 3·0% 8·0% 416 140 13·7% 0·7% 356 173 87·4% 7·7% 0·1% 2·9% Argentinian registries 1995–2009 40 482 5·0% 7·6% 35 377 11·1% 0·5% 31 244 97·9% 3·7% <0·1% 14·6% Brazilian registries 1995–2009 119 423 5·4% 20·0% 89 067 9·5% 0·5% 80 113 92·8% 7·1% 0·2% 1·7% Chilean registries 1998–2008 8920 8·2% 0·7% 8121 10·7% 0·5% 7213 90·3% 4·1% 0·5% 0·0% Colombian registries 1995–2009 36 140 1·5% 5·7% 33 550 5·7% 0·8% 31 365 88·5% 12·0% <0·1% 19·5% Cuba* 1998–2006 120 748 0·3% 2·1% 117 883 23·7% 0·3% 89 576 70·6% 11·7% 0·0% 0·0% Ecuadorian registries 1995–2009 35 395 1·3% 5·7% 32 924 9·7% 4·3% 28 314 92·0% 3·7% 0·0% <0·1% Puerto Rico* 2000–2009 81 886 3·9% 4·5% 74 937 6·7% 0·3% 69 745 97·2% 1·4% 0·0% 0·0% Uruguay* 2002–2009 24 462 0·4% 0·3% 24 281 23·4% 0·0% 18 603 80·6% 20·9% 0·0% 0·0% America (North) 12 233 257 6·0% 1·3% 11 340 569 1·8% 0·2% 11 109 332 94·8% 1·3% 0·8% <0·1% Canada* 1995–2009 1 392 677 4·3% 0·6% 1 324 227 1·8% 0·5% 1 294 159 88·7% 1·5% 0·0% <0·1% US registries 1995–2009 10 840 580 6·2% 1·4% 10 016 342 1·8% 0·2% 9 815 173 95·6% 1·3% 0·9% <0·1% Asia 3 581 339 3·3% 0·9% 3 432 472 4·4% 0·2% 3 274 733 83·1% 11·4% 0·7% 2·6% Chinese registries 1995–2009 241 044 0·1% 1·3% 237 656 1·6% <0·1% 233 736 66·4% 38·7% 3·5% 0·1% Cyprus* 2004–2009 9986 2·8% 2·7% 9437 8·6% 0·2% 8609 98·7% 2·1% 0·0% 0·1% Hong Kong* 1997–2006 6184 0·0% 0·0% 6184 0·0% 0·2% 6169 99·6% <0·1% 9·0% 8·5% Indian registries 1995–2009 11 732 0·0% 1·5% 11 551 2·7% 0·1% 11 235 81·8% 9·7% 22·9% 9·9% Indonesia (Jakarta) 2005–2007 3830 0·0% 18·1% 3138 1·3% 0·2% 3091 75·4% 23·0% 0·0% NA Israel* 1995–2009 202 745 6·1% 2·0% 186 266 3·2% 0·2% 179 921 94·2% 6·4% 0·0% 0·0% Japanese registries 1995–2009 1 065 707 3·7% 1·0% 1 015 315 13·3% <0·1% 879 341 86·4% 9·9% 0·0% 3·6% Jordan* 2000–2009 19 191 0·0% 0·6% 19 081 <0·1% 0·9% 18 896 99·3% 1·5% 54·9% 0·0% Korea*‡ 1995–2009 1 191 749 0·0% 0·8% 1 182 442 <0·1% 0·1% 1 180 925 82·5% 8·9% 0·0% 0·0% Malaysia (Penang) 1995–2009 15 842 0·0% 2·5% 15 447 2·4% 1·8% 14 800 92·0% 9·8% 0·0% <0·1% Mongolia* 2005–2009 13 415 1·8% 0·6% 13 096 <0·1% 4·5% 12 510 35·7% 1·2% 16·9% NA Qatar* 2002–2009 780 0·8% 0·1% 773 2·7% 0·4% 749 90·0% 6·4% 0·0% 5·1% Saudi Arabia* 1995–2008 24 216 1·4% 0·1% 23 876 2·6% 10·1% 20 860 95·2% 1·6% 0·0% 61·3% Taiwan* 1995–2009 662 906 9·2% <0·1% 601 480 0·0% 0·1% 600 934 83·1% 9·6% 0·0% 0·0% Thai registries 1995–2009 47 263 1·4% 0·7% 46 279 4·0% 0·1% 44 406 58·5% 38·4% 0·1% 23·4% Turkey (Izmir) 1995–2009 64 749 3·3% 3·4% 60 451 3·0% 0·2% 58 551 92·9% 2·1% <0·1% 30·7% Europe 11 449 869 6·5% 1·0% 10 584 050 4·5% 0·2% 10 086 145 89·7% 3·5% 0·3% 0·4% Austria * 1995–2009 353 194 6·9% 0·6% 326 730 0·1% 0·9% 323 432 97·6% 2·5% 0·0% 0·0% Belarus (childhood)† 1995–2009 726 0·0% 0·0% 726 0·0% 0·0% 726 99·9% 0·0% 2·8% 0·0% Belgium* 2004–2009 256 073 8·7% 0·6% 232 152 <0·1% 0·2% 231 734 98·7% 1·5% 1·1% 0·0% Bulgaria* 1995–2009 255 768 <0·1% 0·2% 255 158 11·2% <0·1% 226 566 81·4% 1·3% 0·1% 0·0% Croatia* 1998–2009 148 131 0·0% 0·1% 148 031 6·0% <0·1% 139 147 84·9% 0·4% 0·0% 0·0% Czech Republic* 1995–2009 469 330 6·4% 1·3% 433 523 7·9% 0·9% 395 462 90·8% 1·9% 0·0% 0·0% Denmark* 1995–2009 251 533 0·0% 0·2% 250 931 0·4% 0·0% 249 943 93·2% 8·0% 0·1% 0·0% Estonia* 1995–2008 51 544 1·4% 1·1% 50 283 3·8% 0·4% 48 193 89·0% 3·5% 0·4% 0·0%
Morphological confi rmation for each cancer varied
widely between continents and countries. Overall, 48·2%
of liver cancers had morphological data available
compared with 84·4% of lung cancers, at least 90% of
other solid tumours and adult leukaemia, and 99%
of childhood acute lymphoblastic leukaemia (appendix
pp 3–63). Morphological confi rmation was available for
100% of acute lymphoblastic leukaemias in all the
specialist childhood cancer registries, including the
national registries in Lesotho and Belarus.
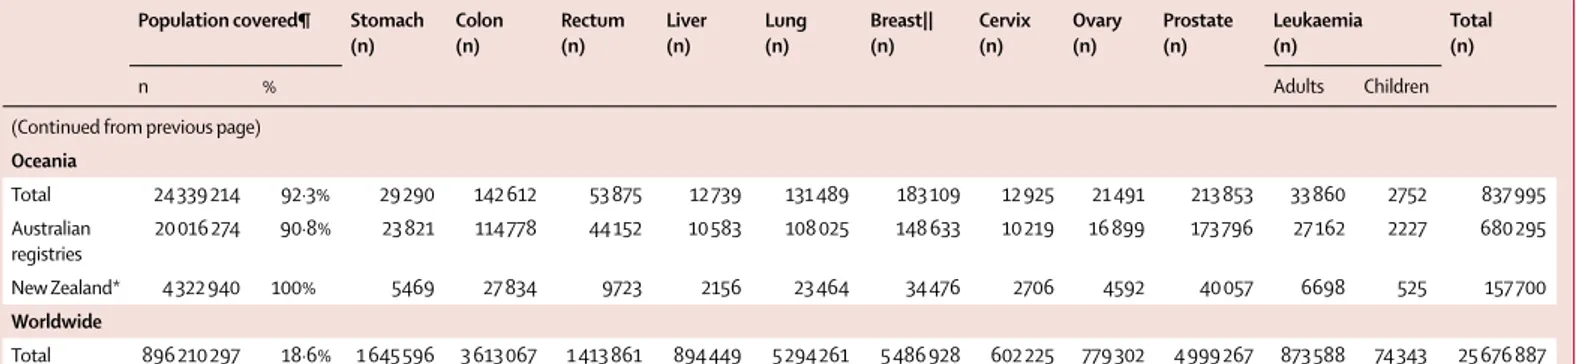
The 279 participating cancer registries represented
an estimated total population of about 896 210 000 people
in 2009, or 18·6% of the combined national
popula-tions of the 67 countries (4·8 billion total population;
table 3); details by registry are provided in the appendix
(pp 64–80).
100% coverage of the national population
was provided by 40 countries. Population coverage in
Australia was 91%, and in the USA it was 83%. In the
remaining 25 countries, population coverage ranged
from 0·5% to 47%. In China, 21 participating registries
covered 37·7 million people (2·8% of 1·35 billion total
population), whereas the four registries in India covered
5·9 million people (0·5% of 1·19 billion total population).
China and India apart, data from 254 registries covered
37% of the combined population of 2·3 billion people in
65 countries.
Life expectancy at birth in 2009 varied widely between
the 279 registry populations: for females, the range was
46–87 years and for males it was 45–81 years (appendix,
p 175). Life expectancy rose slightly from 1995 to 2009
Calendarperiod
Patients submitted (n)
Ineligible patients¶ Eligible patients (n)
Exclusions|| Available for analysis (n)
Data quality indicators††
In situ (%)
Other (%)
DCO (%) Other (%) MV (%) Non-specifi c morphology (%) Lost to follow-up (%) Censored (%)
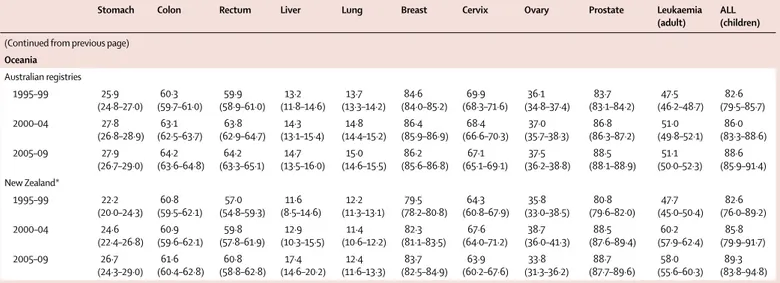
(Continued from previous page)
Finland* 1995–2009 235 156 6·5% 2·9% 213 137 2·3% <0·1% 208 129 96·1% 7·3% 0·1% 0·0% French registries† 1995–2009 227 210 <0·1% 0·3% 226 622 <0·1% 0·2% 226 234 96·3% 2·6% 3·9% 4·1% German registries 1995–2009 1 668 355 4·0% 1·2% 1 582 464 13·5% 0·1% 1 367 345 94·9% 1·0% 0·3% 0·1% Gibraltar* 1999–2009 665 13·8% 15·8% 468 NA 1·3% 462 85·7% 0·9% 0·0% 2·2% Iceland* 1995–2009 10 805 0·0% 0·8% 10 722 0·2% 0·0% 10 704 97·2% 2·8% 0·0% 0·0% Ireland* 1995–2009 169 818 14·9% 1·4% 142 134 2·4% 0·1% 138 602 91·0% 1·1% 0·0% 0·0% Italian registries 1995–2009 877 272 2·7% 0·5% 849 556 2·1% 0·2% 830 162 87·5% 12·5% 0·8% 1·0% Latvia* 1995–2009 78 334 0·1% 0·2% 78 141 6·1% 0·5% 72 992 81·5% 0·5% 0·0% 0·0% Lithuania* 1995–2009 132 425 2·8% 0·5% 127 999 3·6% 0·0% 123 380 84·9% 2·0% 1·0% 0·0% Malta* 1995–2009 11 630 0·0% 0·9% 11 526 2·6% 0·5% 11 173 96·3% 7·9% 0·0% <0·1% Netherlands* 1995–2009 716 617 2·9% 0·9% 688 714 0·3% 0·3% 684 601 97·0% 3·1% 0·5% 0·0% Norway* 1995–2009 202 823 0·0% 0·4% 202 016 0·8% 0·0% 200 334 95·5% 4·7% 0·2% 0·0% Poland* 1995–2009 813 485 1·2% 0·2% 802 179 4·1% 0·4% 766 183 79·6% 0·5% 0·1% 0·0% Portugal* 1998–2009 240 114 2·8% 2·7% 226 878 0·2% 0·2% 225 902 95·9% 3·3% 0·1% 1·4% Romania (Cluj) 2006–2009 6900 3·9% 0·7% 6583 18·0% 2·0% 5264 93·0% 0·8% 0·0% NA Russia (Arkhangelsk) 2000–2009 23 609 0·0% <0·1% 23 602 3·3% 0·7% 22 643 82·4% 3·5% 1·1% 0·0% Slovakia* 2000–2007 92 942 0·0% 0·3% 92 655 9·9% <0·1% 83 449 95·3% 5·5% 0·0% 0·0% Slovenia* 1995–2009 95 466 14·8% 2·5% 78 973 2·7% <0·1% 76 835 94·5% 5·9% 0·1% 0·0% Spanish registries 1995–2009 338 249 3·9% 2·4% 317 154 2·6% 0·3% 308 081 91·5% 5·4% 0·2% 0·8% Sweden* 1995–2009 395 792 0·0% <0·1% 395 744 NA 0·0% 395 744 98·9% 2·1% 0·2% 0·0% Swiss registries 1995–2009 151 879 6·9% 0·4% 140 737 1·7% 0·1% 138 125 95·2% 2·9% 3·2% 6·0% UK* 1995–2009 3 174 024 14·5% 1·4% 2 668 512 3·5% 0·1% 2 574 598 83·3% 3·4% <0·1% 0·1% Oceania 930 199 7·5% 0·6% 855 312 1·8% 0·2% 837 995 92·0% 4·2% 0·0% 4·1% Australian registries 1995–2009 766 090 9·1% 0·7% 691 260 1·4% 0·2% 680 295 91·9% 3·4% 0·0% 5·0% New Zealand* 1995–2009 164 109 0·0% <0·1% 164 052 3·3% 0·6% 157 700 92·6% 7·6% 0·0% 0·0% Total 28 685 445 5·9% 1·3% 26 642 591 3·4% 0·2% 25 676 887 91·1% 3·7% 0·6% 0·7%
NA=not available. *100% coverage of the national population. †100% coverage of the national population for childhood leukaemia only. ‡South Korea. ¶In situ malignant disease (ICD-O-3 behaviour code 2): some registries do not register in situ cancers, other registries did not submit them. Other: records with incomplete data; or tumours that are benign (behaviour code 0), of uncertain behaviour (1), metastatic from another organ (6), or unknown if primary or metastatic (9); or patients falling outside the age range 0–14 years (children) or 15–99 years (adults); or other conditions. ||DCO=tumours registered from a death certifi cate only or detected solely at autopsy. Other: vital status or sex unknown; or invalid sequence of dates; or inconsistency of sex-site, site-morphology, age-site, age-morphology, or
age-site-morphology. †† MV=microscopically verifi ed. Non-specifi c morphology (solid tumours only): ICD-O-3 morphology code in the range 8000–8005. Censored: patients diagnosed during 1995–2004, with last known vital status “alive” but less than 5 years of follow-up.
Population covered¶ Stomach (n) Colon (n) Rectum (n) Liver (n) Lung (n) Breast|| (n) Cervix (n) Ovary (n) Prostate (n) Leukaemia (n) Total (n) n % Adults Children Africa Total 15 983 791 5·8% 830 958 756 445 1833 3202 2357 346 1 085 592 105 12 509 Algerian registries 2 099 478 5·8% 551 406 343 177 908 1582 514 153 364 327 33 5358 Lesotho (childhood)† 756 000 100·0% ·· ·· ·· ·· ·· ·· ·· ·· ·· ·· 22 22 Libya (Benghazi) 1 582 160 26·5% 87 225 105 61 317 352 57 68 153 93 15 1533 Mali (Bamako) 902 723 13·4% ·· ·· ·· ·· ·· 203 ·· ·· ·· ·· ·· 203 Mauritius* 1 226 840 100·0% 65 81 65 23 84 290 93 52 58 31 ·· 842 Nigeria (Ibadan) 1 853 300 1·2% ·· 70 108 ·· ·· ·· 315 ·· 263 39 ·· 795 South Africa (Eastern Cape) 1 094 303 2·2% 54 40 38 98 216 372 1168 46 198 ·· ·· 2230 The Gambia* 1 628 330 100·0% 21 ·· ·· 85 21 33 149 ·· ·· ·· ·· 309 Tunisia (central) 4 840 657 46·1% 52 136 97 1 287 370 61 27 49 102 35 1217
America (Central and South)
Total 43 562 690 13·2% 24 610 43 552 10 405 4076 51 054 111 382 26 389 10 022 64 579 4960 5144 356 173 Argentinian registries† 5 123 973 12·8% 1742 4172 1308 14 2463 9886 2189 1076 4883 15 3496 31 244 Brazilian registries 11 012 413 5·7% 3689 3457 1681 672 4192 52 198 3209 1203 8292 1117 403 80 113 Chilean registries 931 477 5·5% 1333 614 270 181 878 1174 562 229 1653 257 62 7 213 Colombian registries 3 139 671 6·9% 4773 2439 ·· 741 3135 8346 3795 1352 6177 170 437 31 365 Cuba* 11 288 830 100·0% 5026 11 393 ·· ·· 25 654 18 757 10 726 3551 14 372 97 .. 89 576 Ecuadorian registries 4 987 086 33·8% 4821 1880 907 815 1698 5627 3957 1207 5333 1484 585 28 314 Puerto Rico* 3 718 810 100·0% 3226 11 930 3115 1653 5222 15 394 1951 1404 23 869 1820 161 69 745 Uruguay* 3 360 430 100·0% ·· 7667 3124 ·· 7812 ·· ·· ·· ·· ·· ·· 18 603 America (North) Total 291 101 829 84·8% 289 269 1 533 456 428 293 201 342 2 532 324 2 493 295 175 743 302 513 2 689 226 432 639 31 232 11 109 332 Canada* 33 628 600 100·0% 43 996 194 803 49 333 21 124 305 723 286 173 20 651 25 874 289 868 53 175 3439 1 294 159 US registries 257 473 229 83·2% 245 273 1 338 653 378 960 180 218 2 226 601 2 207 122 155 092 276 639 2 399 358 379 464 27 793 9 815 173 Asia Total 219 911 285 6·9% 680 012 405 348 229 351 465 575 594 333 414 619 139 621 71 388 194 319 70 615 9552 3 274 733 Chinese registries 37 688 165 2·8% 47 580 17 894 15 261 37 555 65 320 27 667 5251 5316 5597 6025 270 233 736 Cyprus* 819 100 100·0% 407 1330 375 104 1150 2482 150 265 1936 376 34 8609 Hong Kong* 3 707 500 100·0% ·· ·· ·· ·· ·· ·· 3792 2377 ·· ·· ·· 6169 Indian registries 5 877 408 0·5% 1942 147 138 242 1746 2691 2960 631 128 426 184 11 235 Indonesia (Jakarta) 9 607 787 4·0% 67 229 142 301 406 1004 459 235 137 97 14 3091 Israel* 7 273 800 100·0% 10 161 34 810 9595 2291 23 739 49 458 2887 5928 30 921 9339 792 179 921 Japanese registries 37 172 726 29·2% 230 800 139 071 63 269 81 085 154 292 97 409 17 249 17 221 65 114 12 784 1047 879 341 Jordan* 6 181 310 100·0% 1217 2653 1069 303 2 518 6674 373 691 1457 1451 490 18 896 Korea*‡ 48 164 970 100·0% 324 913 118 155 87 349 183 659 197 382 118 602 61 815 20 394 42 921 21 970 3 765 1 180 925 (Table 3 continues on next page)
Population covered¶ Stomach (n) Colon (n) Rectum (n) Liver (n) Lung (n) Breast|| (n) Cervix (n) Ovary (n) Prostate (n) Leukaemia (n) Total (n) n % Adults Children
(Continued from previous page) Malaysia (Penang) 1 458 900 5·3% 1125 1931 1011 877 2784 3803 1227 719 740 424 159 14 800 Mongolia* 2 672 220 100·0% 2532 354 60 6358 1196 392 1178 264 39 113 24 12 510 Qatar* 1 564 080 100·0% 41 109 39 65 90 248 31 31 56 39 ·· 749 Saudi Arabia * 26 796 380 100·0% 1707 2515 1238 3165 2094 5179 734 954 1473 1801 ·· 20 860 Taiwan* 23 119 772 100·0% 51 506 78 146 45 212 133 440 111 317 82 264 35 308 13 036 36 455 12 239 2011 600 934 Thai registries 3 938 859 5·9% 1337 3198 1827 14 840 8382 5770 4722 1607 1120 1275 328 44 406 Turkey (Izmir) 3 868 308 5·4% 4677 4806 2766 1290 21 917 10 976 1485 1719 6225 2256 434 58 551 Europe Total 301 311 488 46·5% 621 585 1 487 141 691 181 210 272 1 983 228 2 281 321 245 190 373 542 1 836 205 330 922 25 558 10 086 145 Austria* 8 371 710 100·0% 21 262 45 039 23 989 9368 51 467 70 149 7140 12 357 71 407 10 570 684 323 432 Belarus (childhood)† 1 387 671 100·0% ·· ·· ·· ·· ·· ·· ·· ·· ·· ·· 726 726 Belgium* 10 862 440 100·0% 8180 33 007 14 454 3050 43 212 57 203 3851 5783 55 141 7447 406 231 734 Bulgaria* 7 446 200 100·0% 21 072 31 599 20 332 5164 45 999 49 420 15 317 11 643 18 612 6859 549 226 566 Croatia* 4 349 930 100·0% 12 341 19 816 12 240 4063 33 037 26 912 4389 5885 14 885 5227 352 139 147 Czech Republic* 10 486 430 100·0% 24 175 73 556 31 175 8062 80 304 77 632 15 605 17 702 54 772 12 479 ·· 395 462 Denmark* 5 524 430 100·0% 8014 36 668 19 769 4035 56 379 59 135 6104 9328 41 162 8806 543 249 943 Estonia* 1 302 970 100·0% 6093 6159 3097 876 9975 8201 2317 2296 7060 2038 81 48 193 Finland* 5 343 930 100·0% 10 911 22 300 11 548 4129 30 317 54 675 2353 7714 57 012 6576 594 208 129 French registries† 11 563 608 18·4% 10 890 36 315 14 723 8996 30 470 52 334 3549 5835 47 893 9508 5721 226 234 German registries 36 511 217 43·9% 83 205 204 411 107 477 27 951 232 433 323 100 31 607 44 569 265 955 44 460 2177 1 367 345 Gibraltar* 29 253 100·0% 32 73 17 5 61 176 11 13 63 11 ·· 462 Iceland* 313 800 100·0% 532 1333 509 130 2053 2371 223 366 2813 346 28 10 704 Ireland* 4 410 420 100·0% 6952 20 706 8813 1564 25 042 31 160 3232 4933 30 060 5669 471 138 602 Italian registries 23 238 302 38·6% 67 401 139 202 40 810 42 965 153 997 181 654 10 400 23 787 135 881 32 057 2008 830 162 Latvia* 2 112 340 100·0% 9476 8380 5236 1376 15 713 13 617 3016 4533 8994 2555 96 72 992 Lithuania* 3 101 970 100·0% 14 672 11 677 8578 1944 22 425 19 047 7179 6392 26 047 5120 299 123 380 Malta* 422 870 100·0% 687 1693 722 141 1866 3238 160 549 1662 399 56 11 173 Netherlands* 16 561 280 100·0% 31 142 109 467 41 810 4788 144 869 176 885 10 292 21 021 120 745 22 549 1033 684 601 Norway* 4 835 630 100·0% 8765 33 809 15 840 1789 32 745 38 651 4573 7660 50 016 5962 524 200 334 Poland* 38 193 590 100·0% 60 115 93 762 60 178 15 018 225 554 151 046 39 367 39 430 79 083 2630 ·· 766 183 Portugal* 10 776 872 100·0% 25 315 39 016 18 641 3647 27 423 47 868 6861 4977 46 210 5530 414 225 902 Romania (Cluj) 677 942 3·1% 535 618 275 161 1028 1073 458 213 655 240 8 5264 Russia (Arkhangelsk) 1 246 204 0·9% 5006 2927 1840 225 5220 3654 1005 1078 1331 357 ·· 22 643 Slovakia* 5 425 040 100·0% 6767 16 002 7521 1295 15 545 15 859 4349 3564 8914 3407 226 83 449 Slovenia* 2 044 250 100·0% 6864 11 173 6409 1658 15 976 15 240 2827 2837 11 025 2673 153 76 835 Spanish registries 10 002 689 21·9% 22 326 54 275 18 868 12 105 58 048 57 242 5316 8948 58 421 11 541 991 308 081 Sweden* 9 310 300 100·0% 15 320 50 722 29 449 7543 46 744 90 168 6780 12 999 121 681 13 451 887 395 744 Swiss registries† 3 666 300 47·4% 5901 18 300 7457 4072 23 183 33 550 1924 4579 32 976 5514 669 138 125 UK* 61 791 900 100·0% 127 634 365 136 159 404 34 152 552 143 620 061 44 985 102 551 465 729 96 941 5862 2 574 598 (Table 3 continues on next page)
in most populations, but in some countries it changed
substantially between the earliest and latest years for
which data were available, from a decline of 6–9 years
in South Africa and Lesotho (attributable largely to
HIV/AIDS),
45to an increase of 6 years or more in
Estonia, Latvia (for males), and South Korea, and in
some regions of Brazil (males), China, and Germany
(males; data not shown).
Whenever possible, fi
ndings are presented for
patients diagnosed during 1995–99, 2000–04, and
2005–09, by continent, country, and registry (fi gures 2
to 4; appendix pp 3–173). When data were available for
more than one registry in a given country, survival
estimates were derived by pooling data for that country,
excluding data from registries for which estimates were
judged less reliable (fi gures 2 and 3).
Survival estimates
were fl agged as less reliable if a higher than usual
proportion of patients was excluded from analyses
because their cancer was registered from the death
certifi cate only, or had an unknown date for last vital
status, or because not all deaths were ascertained. Less
reliable estimates are not always outliers in the global
distribution, but when they are, they have been omitted
from this discussion. Less reliable estimates are also
excluded from the distribution of survival among
registries in each continent (fi gure 4).
Data for stomach cancer are available for
1
645
596 patients. 191 registries in 48 countries
contributed data for 1995–99, 241 registries in
56 countries provided data for 2000–04, and
241 registries in 59 countries provided data for 2005–09
(table 3; appendix pp 64–80). For patients diagnosed
during 2005–09, age-standardised 5-year net survival
for stomach cancer was very high in South Korea
(58%), Japan (54%), and Mauritius (41%; table 4;
appendix p 142). 5-year survival from stomach cancer
was 30–39% in Austria, Belgium, China, Germany,
Iceland, Italy, Portugal, Switzerland, and Taiwan.
5-year survival in Denmark, Malta, Poland, and the UK
was lower than in most other European countries
(18–19%). Survival was less than 10% in Gibraltar and
Libya, but those two estimates are based on fewer than
100 cases (table 4; appendix pp 64–80).
In most
countries, survival from stomach cancer remained in
the narrow range of 25–30% from 1995–99 to 2005–09.
Very large increases were seen in South Korea (from
33% to 58%) and China (from 15% to 31%), but survival
rose by less than 10% in some countries on all
continents (appendix p 153). Survival from stomach
cancer fell by 6–17% in Brazil, Cyprus, Malaysia,
Thailand, and Turkey, declines that were not seen for
most other cancers in these registries. We could not
assess survival trends for stomach cancer in African
countries. The range of 5-year survival estimates for
stomach cancer in 2005–09 varied widely between
registries in Africa, Asia, and Central and South
America (appendix p 164).
Data for colon cancer are available for 3 613 067 patients
(table 3). 191 registries in 48 countries contributed data
for 1995–99, 244 registries in 58 countries provided
data for 2000–04, and 242 registries in 61 countries
had data for 2005–09 (appendix pp 64–80). For patients
diagnosed with colon cancer during 2005–09,
age-standardised 5-year net survival was 50–59% in
many countries, although it did surpass 60% in
North America, Oceania, 12 European countries, and a
few countries in Central and South America and Asia
(table 4; appendix p 143). 5-year net survival from colon
cancer was 40–49% in Argentina, Bulgaria, Chile,
Colombia, Latvia, and Russia, and it was less than 40%
in India, Indonesia, and Mongolia. In most countries,
5-year survival from colon cancer increased from
1995–99 to 2005–09, but it fell in Argentina and Cyprus
(table 4; appendix p 154). Pooled 5-year survival estimates
for Canada and the USA were already high (57% and 61%,
respectively) for patients diagnosed with colon cancer in
1995–99, but they increased to 63% and 65%,
respectively, for individuals diagnosed during 2005–09.
Data were generally available from the same registries
throughout the period 1995–2009 in North America and
Population covered¶ Stomach(n) Colon (n) Rectum (n) Liver (n) Lung (n) Breast|| (n) Cervix (n) Ovary (n) Prostate (n) Leukaemia (n) Total (n) n % Adults Children
(Continued from previous page) Oceania Total 24 339 214 92·3% 29 290 142 612 53 875 12 739 131 489 183 109 12 925 21 491 213 853 33 860 2752 837 995 Australian registries 20 016 274 90·8% 23 821 114 778 44 152 10 583 108 025 148 633 10 219 16 899 173 796 27 162 2227 680 295 New Zealand* 4 322 940 100% 5469 27 834 9723 2156 23 464 34 476 2706 4592 40 057 6698 525 157 700 Worldwide Total 896 210 297 18·6% 1 645 596 3 613 067 1 413 861 894 449 5 294 261 5 486 928 602 225 779 302 4 999 267 873 588 74 343 25 676 887
*100% coverage of the national population. †100% coverage of the national population for childhood leukaemia only. ‡South Korea. ¶Data are from the UN Population Division for 2009,40 national authorities
in Canada, Portugal, and the UK, or the cancer registry. ||In female patients.
Oceania, where survival from colon cancer was either
stable or improving, and the range of estimates was
narrow (appendix p 165). High outlier values for
2005–09 are for Yukon (Canada; 78%, a merged estimate
based on 109 cases) and Australian Capital Territory
(Australia; 74%, based on 247 cases; appendix pp 64–111).
Data for rectal cancer are available for 1 413 861 patients
(table 3). 188 registries in 46 countries provided data for
1995–99, 240 registries in 57 countries had data available
for 2000–04, and 238 registries in 60 countries
contributed data for 2005–09 (appendix pp 64–80).
For patients diagnosed with cancer of the rectum
during 2005–09, age-standardised 5-year net survival
was in the range 50–59% in many countries. Survival
was very high (70% or more) in Cyprus, Iceland, and
Qatar, and high (60–69%) in South Korea,
North America, Oceania, and nine European countries
(table 4; appendix p 144). Survival from rectal cancer
was very low in India (29%). During 1995–2009, survival
from rectal cancer increased in most countries, but it
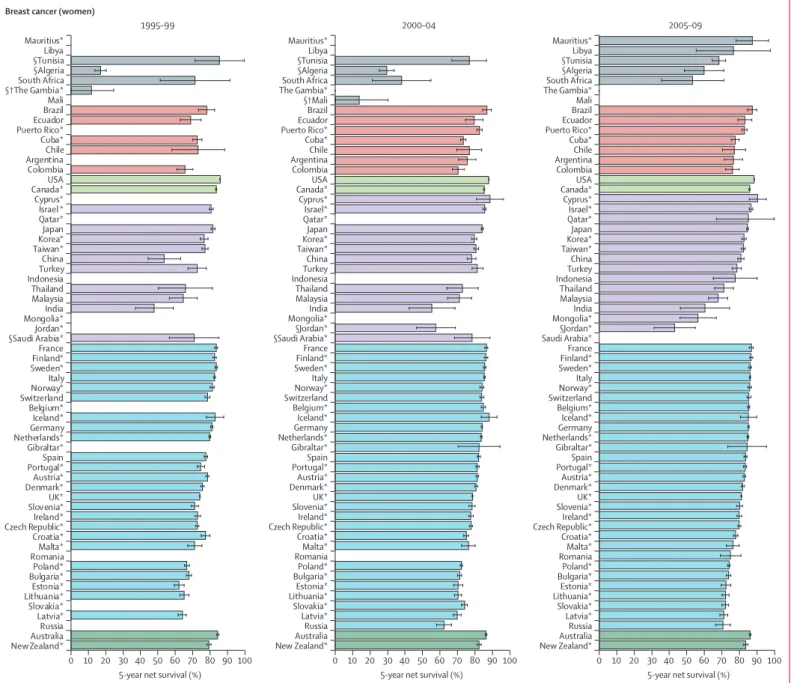
0 10 20 30 40 50 60 70 80 90 100 1995–99
Breast cancer (women)
5-year net survival (%)
0 10 20 30 40 50 60 70 80 90 100 2000–04
5-year net survival (%) New Zealand* Australia Russia Latvia* Slovakia* Lithuania* Estonia* Bulgaria* Poland* Romania Malta* Croatia* Czech Republic* Ireland* Slovenia*UK* Denmark* Austria* Portugal* Spain Gibraltar* Netherlands* Germany Iceland* Belgium* Switzerland Norway* Italy Sweden* Finland* France §Saudi Arabia* §Jordan* Mongolia* India Malaysia Thailand Indonesia Turkey China Taiwan* Korea* Japan Qatar* Israel* Cyprus* Canada* USA Colombia Argentina Chile Cuba* Puerto Rico* Ecuador Brazil §†Mali The Gambia* South Africa §Algeria §Tunisia Libya Mauritius* 0 10 20 30 40 50 60 70 80 90 100 2005–09
5-year net survival (%) New Zealand* Australia Russia Latvia* Slovakia* Lithuania* Estonia* Bulgaria* Poland* Romania Malta* Croatia* Czech Republic* Ireland* Slovenia*UK* Denmark* Austria* Portugal* Spain Gibraltar* Netherlands* Germany Iceland* Belgium* Switzerland Norway* Italy Sweden* Finland* France Saudi Arabia* §Jordan* Mongolia* India Malaysia Thailand Indonesia Turkey China Taiwan* Korea* Japan Qatar* Israel* Cyprus* Canada* USA Colombia Argentina Chile Cuba* Puerto Rico* Ecuador Brazil Mali The Gambia* South Africa §Algeria §Tunisia Libya Mauritius* New Zealand* Australia Russia Latvia* Slovakia* Lithuania* Estonia* Bulgaria* Poland* Romania Malta* Croatia* Czech Republic*Ireland* Slovenia* UK* Denmark* Austria* Portugal* Spain Gibraltar* Netherlands* Germany Iceland* Belgium* Switzerland Norway* Italy Sweden*Finland* France §Saudi Arabia* Jordan* Mongolia* India Malaysia Thailand Indonesia Turkey China Taiwan* Korea* Japan Qatar* Israel * Cyprus* Canada*USA Colombia Argentina Chile Cuba* Puerto Rico* Ecuador Brazil Mali §†The Gambia* South Africa §Algeria §Tunisia Libya Mauritius*
Figure 2: Global distribution of age-standardised 5-year net survival for women diagnosed with breast cancer during 1995–99, 2000–04, and 2005–09, by continent and country Age-standardised 5-year net survival estimates for other cancers are presented in the appendix (pp 141–51). Survival estimates for every country are ranked from highest to lowest within every continent; for ease of reference, the ranking for 2005–09 is used for 1995–99 and 2000–04. Error bars represent 95% CIs. Grey bars represent African countries; red bars represent America (Central and South); light green bars represent America (North); purple bars represent Asian countries; blue bars represent European countries; and dark green bars represent Oceania. *100% coverage of the national population. †National estimate not age-standardised. §National estimate fl agged as less reliable because the only estimate or estimates available are from a registry or registries in this category.
was stable or even falling in Argentina, Brazil, Chile,
India (Karunagappally), Malaysia, and Uruguay
(appendix p 155).
Data for liver cancer are available for 894 449 patients
(table 3). 189 registries in 46 countries contributed data for
1995–99, 236 registries in 54 countries provided data for
2000–04, and 236 registries in 57 countries had data
available for 2005–09 (appendix pp 64–80). However,
international comparisons are more limited for liver
cancer than for other malignant diseases because
estimates from 20 countries were fl agged as less reliable,
mainly because of a high proportion of cancer registrations
from a death certifi cate only (appendix pp 24–28).
Age-standardised 5-year net survival from liver cancer was
generally low (10–20%) in most countries, both in the
developed and developing world, throughout the period
1995–2009 (table 4; appendix p 145). Survival only reached
20% or more for patients diagnosed during 2005–09 in
some east Asian countries (Japan, South Korea, and
Taiwan), where a steady rise in survival from liver cancer
has been seen since 1995–99. Even for 2005–09, survival
was still very low (less than 10%) in Colombia, Denmark,
Estonia, Finland, India, Malta, Mongolia, Norway, Russia,
Slovenia, Thailand, and the UK. Estimates judged less
reliable were mostly very similar to those that were robust.
5-year survival from liver cancer increased between
1995–99 and 2005–09
in the two countries in North
America, four countries in Asia, and 13 European
countries. Survival declined in Thailand from 16% to 8%
(based on 14 800 cases). The high survival estimate for
Mauritius (53%) is a national fi gure, but it is based on only
23 cases and is not age-standardised.
Data for lung cancer are available for 5 294 261 patients
(table 3). 190 registries in 48 countries provided data for
1995–99, 240 registries in 57 countries contributed data
for 2000–04, and 240 registries in 60 countries had data
available for 2005–09 (appendix pp 64–80).
Age-standardised 5-year net survival from lung cancer
was typically low, in the range 10–20% for most
geographical areas, both in the developed and developing
world (table 4, appendix pp 146 and 168). The general
pattern is very similar to that of liver cancer. International
variation in survival is less striking than for cancers with
good prognosis, but diff erences are still noticeable.
Figure 3: Trends in age-standardised 5-year net survival for women diagnosed with breast cancer during 1995–99, 2000–04, and 2005–09, by continent or region and countryTrends in age-standardised 5-year net survival for other cancers are presented in the appendix (pp 152–62). Countries have been grouped into 12 geographical regions. ARG=Argentina. AUS=Australia. AUT=Austria. BEL=Belgium. BGR=Bulgaria. BRA=Brazil. CAN=Canada. CHE=Switzerland. CHL=Chile. CHN=China. COL=Colombia. CUB=Cuba. CYP=Cyprus. CZE=Czech Republic. DEU=Germany. DNK=Denmark. DZA=Algeria. ECU=Ecuador. ESP=Spain. EST=Estonia. FIN=Finland. FRA=France. GBR=United Kingdom. GIB=Gibraltar. GMB=The Gambia. HRV=Croatia. IDN=Indonesia. IND=India. IRL=Ireland. ISL=Iceland. ISR=Israel. ITA=Italy. JOR=Jordan. JPN=Japan. KOR=South Korea. LBY=Libya. LTU=Lithuania. LVA=Latvia. MLI=Mali. MLT=Malta. MNG=Mongolia. MUS=Mauritius. MYS=Malaysia. NLD=Netherlands. NOR=Norway. NZL=New Zealand. POL=Poland. PRI=Puerto Rico. PRT=Portugal. QAT=Qatar. ROU=Romania. RUS=Russia. SAU=Saudi Arabia. SVK=Slovakia. SVN=Slovenia. SWE=Sweden. TWN=Taiwan. THA=Thailand. TUN=Tunisia. TUR=Turkey. USA=United States of America. ZAF=South Africa. §Continent or region with one or more national estimates fl agged as less reliable.
0 20 40 60 80 100
5-year net survival (%) MLI
MUS GMB 0 20 40 60 80 100
5-year net survival (%)
1995–99 2000–04 2005–09 0 20 40 60 80 100
5-year net survival (%)
1995–99 2000–04 2005–09 1995–99 2000–04 2005–09 1995–99 2000–04 2005–09
§ Africa (north) Breast cancer (women)
§ Africa (south, east, and west) America (Central and South) America (North)
§ Asia (west) Asia (south) Asia (east) Europe (north)
Europe (west) Europe (south) Europe (east) Oceania
DZA LBY TUN ZAF ARG BRA CHL CUB COL ECU
PRI CANUSA
IND IDN MYS THA AUT BEL FRA DEU NLD CHE BGR CZE POL ROU RUS SVK NZL AUS CHN JPN MNG TWN KOR CYP ISR JOR QAT TUR SAU PRT ESP GIB ITA MLT HRV SVN NOR DNK SWE FIN IRL LVA LTU GBR ISL EST