ALMA MATER STUDIORUM - UNIVERSITÀ DI
BOLOGNA
FACOLTA’ DI INGEGNERIA
CORSO DI LAUREA IN CIVIL ENGINEERING
DICAM
TESI DI LAUREA
in
Earthquake Engineering
Earthquake and Wind Response of Plan-Asymmetric Buildings
CANDIDATO
RELATORE:
Sara Bernardini
Chiar.mo Prof. Marco Savoia
CORRELATORE/CORRELATORI
Chiar.mo Prof. Rene B. Testa
Anno Accademico 2010/11
Sessione I
I
Index
Introduction ... 1!
1.! Literature ... 2!
1.1.! Earthquake Response ... 2!
1.1.1.! Governing parameters in the earthquake response of asymmetric single-story buildings ... 4!
1.1.2.! Comparison of static and dynamic seismic code analysis of multi-story asymmetric buildings and influence of the choice of the center of resistance ... 10!
1.1.2.1.! Equivalent static lateral load analysis of the NBCC ... 12!
1.1.2.2.! Dynamic modal response spectrum analysis with complete quadratic combination (CQC) of modal responses ... 13!
1.1.2.3.! Results ... 14!
1.2.! Wind Response ... 18!
1.2.1.! Influence of planar shape on wind pressure distribution ... 19!
1.2.1.! Computational fluid dynamic simulations and wind tunnel test comparisons for different bluff-body shapes ... 23!
1.2.2.! Pressure distribution on regular planar shape, low-rise buildings ... 27!
1.2.1.! Across-wind and torsional motion coupling for different along-wind eccentricities ... 29!
1.2.2.! Influence of planar shape on wind response ... 35!
2.! Dynamic response of asymmetric coupled buildings ... 38!
2.1.! Hypothesis ... 38!
2.3.! Governing parameters ... 41!
3.! SAP Model – Structures analyzed ... 46!
4.! Analysis methods ... 48! 4.1.! Static analysis ... 48! 4.1.1.! Wind Load ... 48! 4.1.2.! Seismic Load ... 49! 5.! Analysis Results ... 52! 5.1.! Wind Response ... 52! 5.2.! Seismic Response ... 56!
5.3.! Wind and Earthquake Analysis comparison ... 60!
6.! Conclusions ... 68!
1
Introduction
In seismic or windy areas, the regularity of a building is very important, because it influences the structure’s behavior and it increases the cost to make it acceptable if the level of regularity is low. By irregularity is meant structural eccentricity, that is non-coincidence of the center of mass with the center of stiffness, induces torsion in the structure, increasing the demand on the flexible side.
In the first part of this work, the influencing parameters on wind and earthquake response are assessed, analyzing previous researches on elastic static and dynamic analysis of single and multi-story asymmetric buildings.
The second part of this researches intended to assess and verify the correlation between seismic and wind static response of plan-asymmetric building. In particular, the influence of the height of the structure has been considered. The top drifts due to code based static analysis for wind and seismic action have been compared for buildings with different values of structural eccentricity and with increasing number of stories.
1. Literature
1.1. Earthquake Response
Under earthquake loads, plan-asymmetric buildings with irregular distributions of mass or stiffness undergo torsional responses coupled with the translational vibrations. These types of structures are likely to suffer more severe displacement demands at the corner elements under earthquake ground motions. Indeed, the displacements of the flexible side are higher than those of the stiff side [1]. Illustrative examples, have clearly demonstrated the unfavorable influence of torsion in asymmetric structures. The results indicate that, in general, larger displacements and larger ductility are required in an asymmetric structure in order to develop the same strength as in the symmetric structure, especially at the flexible and/or weak side of the building [5]. A parametric study [2] of the coupled lateral and torsional response of a one-way symmetric single story building model subjected to both steady state and earthquake base loadings pointed out that the shear forces and edge displacement in vertical resisting elements located on the periphery of the structure may be significantly increased in comparison with the corresponding values for a symmetric building. For particular ranges of the key parameters defining the structural system, typical of the properties of many actual buildings, torsional coupling induces a significant amplification of earthquake forces which should be accounted for in their design. For example, for large values of eccentricity, the increase in corner displacement may exceed 50%. It has been found that the coupling of torsional and translational vibrations is one of the key factors that have caused many buildings to collapse in recent earthquakes around the world [3].
For an asymmetric MDOF, the roof translation and base shear are accompanied by roof rotation and base torque, respectively. Obviously, the rotational response is essential to the assessment of building corner response. Therefore, not only roof translation versus base shear but also roof rotation versus base torque relationships are proposed to compute the detailed responses of the asymmetric MDOF system.
The study of the coupled lateral and torsional response of partially symmetric buildings subjected to steady state and earthquake response shows that the maximum translational and torsional response are not qualitatively affected by the nature of the load [2].
In order to obtain reliable results, a wide range of values of the uncoupled period Tv should be considered because of the influence of the eccentricity and the ratio of
torsional and translational natural frequencies of the equivalent uncoupled building (λT)
on earthquake response [2].
The most general case for plane-asymmetric buildings under horizontal earthquake loads is a two-way asymmetric structure subject to bi-directional seismic ground motions. However, the behavior of these buildings is complex to analyze, since the coupling occurs between one rotational and two translational inelastic vibrations. Nevertheless, it has been shown by many researchers that the response of one-story system with one plane of asymmetry under bi-directional earthquake is more severe in terms of the level of damage to which the flexible-side elements are exposed and in terms of elastic or inelastic torsional behavior compared to the response under uni-directional excitation [3].
The mean value of the normalized displacement evaluated with the linear analysis is always higher than the nonlinear one, therefore inelastic displacement amplifications at the edges of the plan can be conservatively approximated by the elastic ones [13]. In
general, inelastic torsional response is qualitatively similar to elastic torsional response. Quantitatively, the torsional effect on the flexible side, expressed as an increase of displacements due to torsion, decreases slightly with increasing plastic deformation, unless the plastic deformations are small. Reduction of displacements due to torsion, typical for elastic torsionally stiff structures, usually decreases with increasing plastic deformations. As an additional effect of large plastic deformations, a flattening of the displacement envelopes in the horizontal plane usually occurs, indicating that torsional effects in the inelastic range are generally smaller than in the elastic range [9]. Therefore, for the purpose of this research, only linear elastic range is analyzed.
Moreover, the response of a mass-eccentric system and of a strength- and stiffness-eccentric system, in which strength and stiffness are linearly related, is similar. The differences between displacements at the same distances from the CM are, on average, small [9].
A study on the interaction among axial force and bi-directional horizontal forces in vertical resisting elements, which usually is neglected in standard analysis, shows that models not accounting for interaction phenomena generally overestimate torsional response [14]; therefore neglecting this effect is on the conservative side.
1.1.1.
Governing parameters in the earthquake response of
asymmetric single-story buildings
Chandler and Hutchinson [2] analyzed an idealized model with two independent DOF, since it has been shown to be sufficient to identify the more significant trends in the earthquake response of torsionally coupled systems. In particular, this paper tries to assess parametrically the influence of torsional coupling on the elastic earthquake response of buildings subject to transient earthquake records. An analysis of the responses to steady
state harmonic base loading is also made, in order to examine maximum response trends and to develop response functions for transient analysis by frequency domain methods. Consistency has been shown among parametric trends of torsional coupling in steady state and earthquake response.
The model is an infinitely rigid circular disc with axially inextensible and massless vertical elements (Figure 1.1); the stiffness is idealized by elastic and viscously damped springs. The lateral stiffness is symmetrically distributed such that the center of resistance coincides with the center of the disc; the mass eccentricity e is due to the different densities (0<e<4r/3π). Rotational displacements of the disc take place about the center of resistance. The unidirectional ground excitation is assumed to be applied as a harmonic, rigid-base displacement vg (!! " exp '()*+) in the x-direction. The equations of motion
for each degree of freedom are: ,!-"
. ,/0- . 1##!2 . 1#$02 . 3#! " 0 (1.1)
,/!-"
. 5$0- . 1$#!2 . 1$$02 . 3#0 " 0 (1.2)
Figure 1.1: Model idealization.
where vt is the total translational displacement of the floor mass in the x-direction (i.e. vt
= vg + v); θ is the rotational displacement of the floor mass about the z-axis; Kv and Kθ e
viscous damping coefficients; Jθ is the mass polar moment of inertia about the center of
resistance; and e is the static eccentricity.
The response is a function of the eccentricity ratio (er=e/r), the ratio of torsional
and translational natural frequencies of the equivalent uncoupled building (λT=ωθ /ωv),
damping ratio (ξ) and the excitation frequency ratio (f=ω/ω1), Therefore, in order to
obtain reliable results, a wide range of values of the uncoupled period Tv should be
considered because of the influence of er and λT on earthquake response.
The controlling parameters are also function of the natural frequencies of the building:
• ω
θ=(Kθ /Jθ)^½;
• ωv=(Kv /m)^½;
• ω1=fundamental coupled natural frequency of the building.
The main results of this research are:
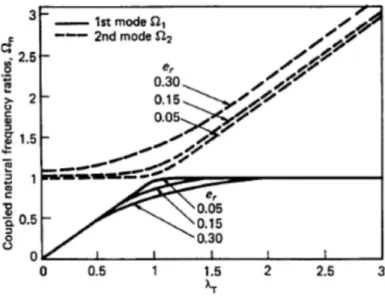
◦ For !! ! " and e small, the modal natural frequencies of the system ω1 and ω2 are
close to the translational natural frequency ωv of the uncoupled (SDOF) system
(see Figure 1.2) → strong modal coupling may occur.
◦ For !! # " and/or e large, the modal frequencies are well separated (see Figure
1.2) → coupling effects are expected to be less evident.
◦ The presence of close uncoupled torsional and translational natural frequencies (!! ! ") is, in itself, not a sufficient condition for significant torsional coupling to
occur since the actual, coupled natural frequencies are widely separated at large eccentricities, even at !! $ ".
◦ For !! % ", the first resonant amplitude of the translational displacement (ω1, f
=1) is smaller than the second resonant amplitude (ω2, f = ω2/ω1), because the first
vibration mode of the system is mainly torsional.
◦ For !! & ", the first resonance of v is more severe when compared with the
second one.
◦ The combined translational and torsional response amplitude (#" $# ' ##) is
important in assessing the influence of torsional coupling in the chosen building model; it has a peak value significantly higher than the individual translational and torsional peaks; moreover, it is strongly influenced by the value of λT, with vi,max occurring at the fundamental resonant frequency and !! ( ".
A direct comparison between torsional coupling effects in steady state and earthquake response is achieved by plotting
v
max, vϑ,max and vi,maxagainstλ
T:◦ For !! ! " there is a reduction in the max value of v (
v
max) and a corresponding◦ For 6% ≅ 1 a significant increase of vϑ,max is noticed, even for very small values
of eccentricity → increase of base torque;
◦ For 6% 9 2 torsional coupling effects are negligible;
◦ For 6% 9 1 the greatest values of
v
i is reached; the response is 25-30% greaterthan that obtained for the equivalent uncoupled system;
◦ For 6% ; 0.8, !& is smaller than that one of the uncoupled system; since usually
buildings have 0.5 ; 6% ; 1.5, the design based on lateral shear force is
conservative;
◦ For 0.8 ; 6% ; 1.2, the choice of the appropriate design provision will largely
depend on the magnitude of the relative eccentricity er.
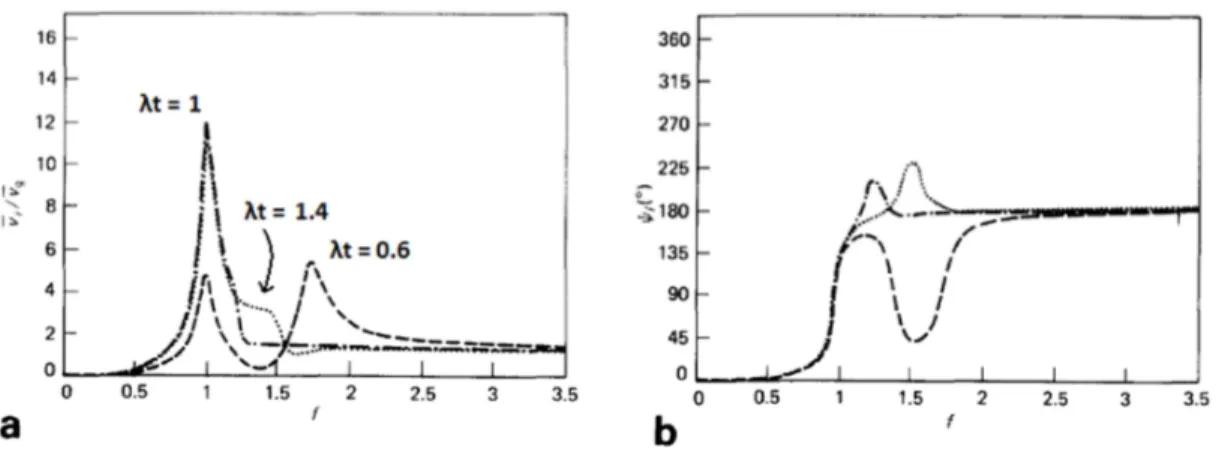
Figure1.3: Translational displacement v of floor disc for various values of λt (er=0.15). Dashed: λt =
Figure 1.4: Torsional displacement vθ of floor disc for various values of λt (er=0.15). Dashed: λt = 0.6,
Dots: λt = 1.4, Dashed-dots: λt = 1. a) Amplitude; b) Phase angle.
Figure 1.5: combined displacement vi of element i at edge of floor disc for various values of λt
(er=0.15). Dashed: λt = 0.6, Dots: λt = 1.4, Dashed-dots: λt = 1. a) Amplitude; b) Phase angle.
As a conclusion, when dynamic effects are accounted for, the parameters influencing the structure response are not only the value of the eccentricity, but also the ratio of torsional and translational natural frequencies of the equivalent uncoupled building λT. In particular, even for small values of structural eccentricity, if λT is close to
1.1.2.
Comparison of static and dynamic seismic code analysis of
multi-story asymmetric buildings and influence of the choice of the
center of resistance
The main analysis methods available in most seismic codes are the static procedure, which applies primarily to regular buildings, since it assumes single mode response of the structure, and the dynamic procedure (modal analysis), which applies especially to tall structures or to buildings with significant irregularities either in plan or elevation.
The static procedures, in most building codes, require that the design base shear
be computed from: Vb = Cs W, where W is the total seismic dead load, consisting of the
total dead load and applicable portions of other loads, and Cs is the seismic coefficient
which depends on factors such as the fundamental vibration period of the building, expected seismic activity at the building site, building importance, soil type and capacity of the building to safely undergo inelastic deformation. The distribution of lateral forces over the height of the building is then determined from the base shear in accordance with a specified formula for the lateral force at the j-th floor. For asymmetric-plan buildings, the lateral force at each floor level is applied at a distance equal to the design eccentricity, from a reference center, at that floor. The design eccentricity at level j, is usually defined as the sum (or difference) of the structural and accidental eccentricities.
The accidental eccentricity is specified as a fraction of the plan dimension perpendicular to the direction of ground motion; it accounts for such effects as differences between computed and actual values of stiffness, yield strengths, dead-load masses and unforeseeable detrimental live-load distributions. The structural eccentricity accounts for the coupled lateral-torsional effect due to the lack of symmetry in plan and is defined as the distance between the floor center of mass (CM) and the reference center. One of the
major obstacles to implementing the static procedure for multi-story, asymmetric-plan buildings is that there is no unanimously accepted definition or name for the reference center; it could be:
a) ‘All floor CR’: the center of rigidity (CR) as the set of points located on the
building floors through which the application of lateral forces would cause no rotation of any of the floors;
b) ‘Single floor CR’: centers of resistance at any floor, defined as the point on the
floor such that application of a lateral load passing through that point does not cause any rotation of that particular floor, while the other floors may rotate; it can be easily shown that single floor CR is the same as the center of twist at that level computed by applying a static torsional moment at that floor level only; therefore, the center of resistance is denoted as Single-floor Center of Twist (SCT) in this
paper;
c) ‘Centers of Twist’: CT of the floors of a building, defined as the points on the
floor diaphragms which remain stationary when the building is subjected to any set of static horizontal torsional moments, applied at the floor levels, i.e. the floor diaphragms undergo pure twist about these points;
d) ‘All story SC’: when lateral load profile is applied through CR, the shear center
of a story is defined as the point of application of the resultant of all lateral loads acting above and including the story under consideration;
e) ‘Single story SC’: SC of a particular story can be defined as a point such that a
shearing force passing through it does not cause any relative rotation of the adjacent floors.
Therefore, there is a need to determine the most appropriate choice for the reference centers for implementing the static torsional provisions of seismic codes.
Results for shear center as the reference center are not included because it has been demonstrated that the floor forces applied at the CRs and the story shears applied at the shear centers lead to identical member forces.
The dynamic analysis procedures specified in seismic codes utilize one of the two well-established procedures for linear dynamic analysis: the response spectrum analysis and the time-history analysis. The response spectrum analysis may utilize the code-specific design spectrum or the site-code-specific spectrum. The time history analysis may use ground motion histories from past earthquakes at the same site (or similar site), or artificially developed acceleration histories to be compatible with the motions expected at the building site.
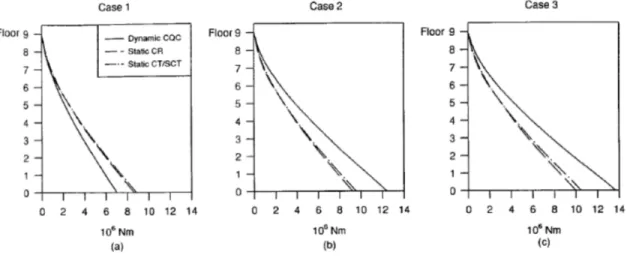
The purpose of the analysis conducted by Harasimowicz and Goel [6] is to observe how the results using various reference centers differ and which of these centers would lead to results that are in agreement with those of dynamic analysis. Three different buildings were analyzed, representing a torsionally stiff building (case 1), a torsionally flexible building (case 3) and an intermediate case. The dimensions are the same for the three cases, but the position of the resisting elements is different; the eccentricity is only in one way. The selected buildings were assumed to be located in the most seismic zone in Canada and subjected to lateral loading in the Y-direction. The stiffnesses at the top three floors of all elements are reduced to two-thirds that at the base, so that the framing is non-proportional.
1.1.2.1. Equivalent static lateral load analysis of the NBCC
The first step is the computation of the fundamental period T from the NBCC provisions; then, it is possible to calculate the base shear and the distribution of the lateral forces on the different floors. Since the reference centers position is function of the load applied, the CR (center of rigidity) is computed with the lateral force distribution, the CT
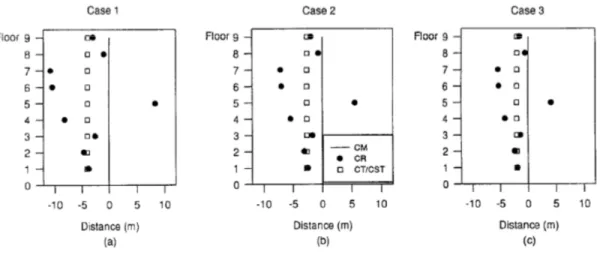
(center of twist) and SCT (single-floor center of twist) are computed with equal torsional moments (it has been shown that torsion distribution is not influent on CTs location for the buildings under consideration). It can be observed that SCT and CT are almost coincident (see Figure 1.6) and are vertically aligned, while CR is some cases is outside the building plane and is on opposite sides of CM (the design eccentricity has different signs); moreover cases 2 and 3 have CT and CR closer to CM.
Figure 1.6: Location of centers of rigidity and twist.
1.1.2.2. Dynamic modal response spectrum analysis with complete
quadratic combination (CQC) of modal responses
The frequencies ω, the periods T, and the participation factors Γ are computed for the first 6 modes (on 18 total), corresponding to the Y and θ degrees of freedom, since coupling occurs among Y and θ motions. We can observe that the case 1 represents a stiff building because the first mode is mainly translational and the second is torsional, moreover Γ1 >> Γ2; case 3, instead, is flexible because the first mode is torsional, while
the second is translational (Γ1 << Γ2); case 2 is intermediate (Γ1 ≈ Γ2). It is also important
to underline that the fundamental period computed with the static procedure is higher than that one computed with the dynamic procedure, with consequent underestimation of the
design load (non-conservative design as regard to the static analysis). Then, the accidental eccentricity has been considered applying static torsional moments at each level equal to the lateral force times the accidental eccentricity (2 meters from code).
1.1.2.3. Results
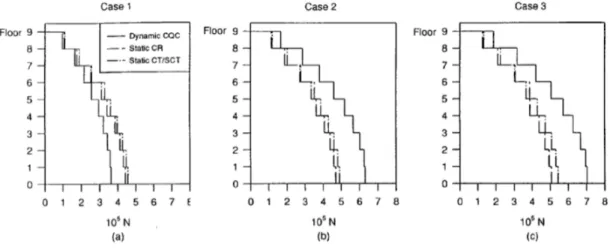
The main results (moment and shear envelopes for the different cases) are summarized in the followings figures. The dynamic forces are normalized with respect to the ratio of the static to dynamic base shear.
Figure 1.7: Shear envelopes for stiff wall, cases 1-3.
Figure 1.9: Moment envelopes for stiff wall, cases 1-3.
Figure 1.10: Moment envelopes for flexible wall, cases 1-3.
Comparing the results of static and dynamic analysis, it is possible to notice that: - For a torsionally stiff building (case 1):
◦ On the stiff side static analysis is conservative both for shear and bending moment;
◦ On the flexible side static analysis leads to a slight underestimation of forces. - For the intermediate case, with significant coupling (case 2):
◦ On the stiff side static analysis is conservative both for shear and bending moment;
◦ On the flexible side static analysis leads to a slight underestimation of forces. - For a torsionally flexible building (case 3):
◦ On the stiff side static analysis is non-conservative (with an underestimation of 23%);
◦ On the flexible side static analysis gives good results compared to the dynamic analysis.
The comparison between stiff and flexible side results, considering only the dynamic analysis, leads to the following conclusions:
- For the torsionally stiff building (case 1):
◦ The shear on the stiff side is similar to the shear on the flexible side;
◦ The bending moment on the stiff side is similar to the bending moment on the flexible side.
- For the intermediate case, with significant coupling (case 2):
◦ The shear on stiff side is greater than the shear on flexible side;
◦ The bending moment on stiff side is also greater than the bending moment on flexible side (the base overturning moment on stiff side is almost twice the moment on flexible side).
- For a torsionally flexible building (case 3):
◦ The shear on stiff side is much greater than the shear on flexible side (in particular it is more than double at the base);
◦ The bending moment on stiff side is also much greater than the bending moment on flexible side (more than double at the base).
It is also interesting to notice the differences between stiff and flexible buildings:
- On stiff side the shear and moment envelopes reach the highest values on the flexible building (case 3) and the lowest values on the stiff building (case 1); for the intermediate building (case 2), intermediate values are obtained.
- On flexible side both shear and moment envelopes are almost equal for all the kind of buildings.
From a comparison of static response using different reference centers, the followings are the main observations:
- Small differences between CR and CT/SCT results for shear and especially for bending moment;
- Due to the drastic change of the CR’s position at the fifth floor, from the fifth floor and up the forces (both shear and bending moment) computed with CR are higher than those one computed with CT/SCT;
- At the base, forces computed using CR are slightly lower than forces computed with CT/SCT;
- Since the differences in member forces are not so large, it is suggested to use the CR as reference center because it has not to be explicitly calculated, unlike CT/SCT.
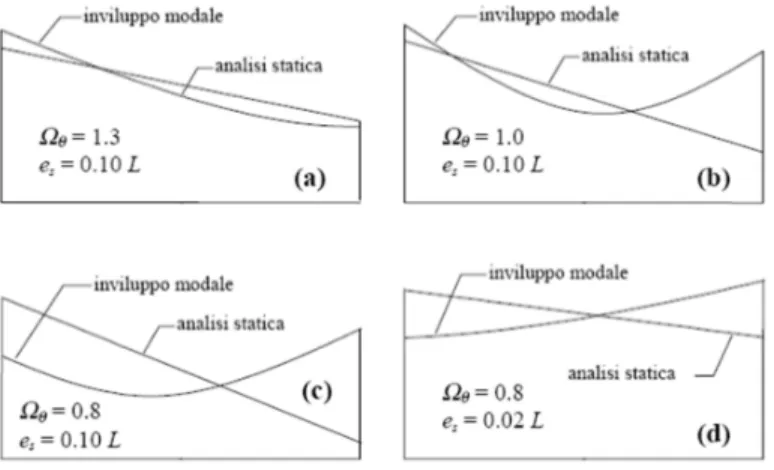
Similar results are obtained by Ghersi [11], whose research pointed out that the behavior of a plan-asymmetric building is not well represented by a static analysis. It is governed by few parameters: inertia radius of the stiffnesses (ρk) and masses (ρm),
eccentricity between center of mass and stiffness, and ratio of uncoupled vibration frequencies Ωθ.
- for torsionally rigid systems (Ωθ > 1) the static analysis overestimates the
displacements on the stiff side but it underestimates on the flexible side (a); - for Ωθ = 1 also on the stiff side the displacements are underestimated with static
analysis (b);
- for torsionally flexible systems (Ωθ< 1) the error on the rigid side is relevant (c);
- for low values of eccentricity the results of static analysis are opposite to the one of modal analysis (d).
Figure 1.11: Influence of Ωθ and e on the static and modal deformed shapes (decoupled period T=1 s).
1.2. Wind Response
The wind response of torsionally coupled buildings is more difficult to assess because of the several effects that are involved: aerodynamic effects, dynamic interaction of the structure with wind load, effect of building shape on wind pressure distribution, gust factor, vortices and across-wind effects.
Wind analysis in tall buildings can be approached in different ways: the most simple approach involves the use of an equivalent static wind pressure, to represent the maximum peak pressure the structure would experience and they do not take into account
dynamic effects due to vortex shedding that can effectively change and increase wind pressure in crosswind direction; scale-model wind tunnel tests provide direct measurement of time series for base moments and shear resulting from instantaneous overall wind loads; finally, CFD analysis can be applied to have a better cognition of what are the real forces acting on a building when this is far from the simple shape commonly considered in National codes; furthermore it can be combined with wind tunnel tests to better address the research on some particular aspects.
An important aspect that influences the wind response of asymmetric buildings is their planar shape [23], [26], since the pressure distribution is different from the corresponding symmetric (or geometrically-symmetric) building. With CFD analysis or wind tunnel tests it is possible to determine the fluid velocities and pressures in a finite volume around the building under consideration. In particular, in accordance with Ceccarini's research [26], it has been observed that the presence of rounded corners determines a significant reduction of both draft and lift coefficients due to a lower presence of vortex shedding. Moreover, also the wind incident angle affects the pressure distribution around the body
Wind pressure can also change due to adjacent buildings and/or obstacles, leading to non-symmetric distributions around the building. Studies on the wind pressure distribution causing maximum quasi-static load effects at the base (across and along-wind base shear and torsional base moment) are made [25].
1.2.1.
Influence of planar shape on wind pressure distribution
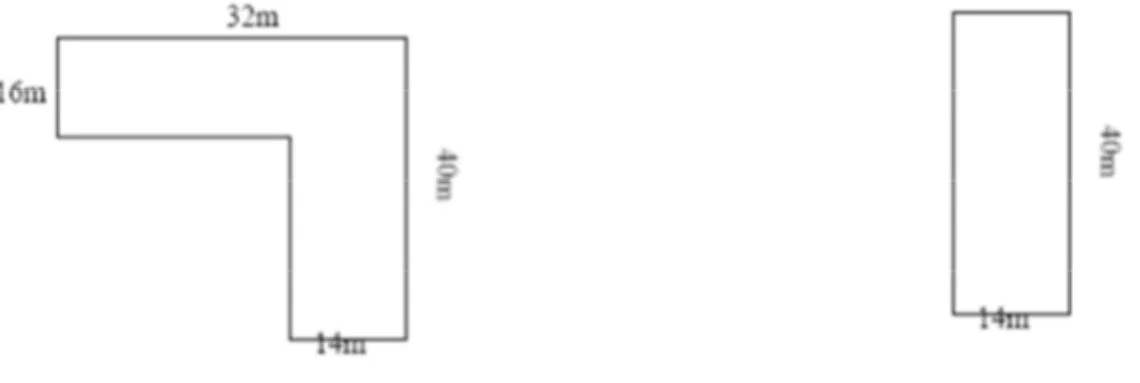
D. Xiang and H. Xiang [23] adopted the CFD method to simulate the distribution of the wind field around the asymmetrical building and the influence of the building shape to the wind distribution. The pressure field and the velocity filed around the
asymmetrical filed are computed whit the finite volume method, and the computed results are contrasted with that of the symmetrical building. The simulated results shows that the distribution of the pressure filed and the velocity filed have different characteristic with that of the symmetrical building. The differential pressure exists between the static pressure of the wind side and the suction pressure of the back side. In the back side of the building there is suction pressure and a big turbulent flow area. The amenity standard is satisfied when the wind velocity is less than 6m/s at pedestrian-level.
Figure 1.12: Geometry of the symmetrical and asymmetrical buildings analyzed.
The inlet velocity of the wind is approximately the average wind speed provided by the meteorological bureau, which is 4m/s. In the outlet, the pressure boundary condition is assumed, which expresses as δp/δx = 0. At the top of the building, the free slipping boundary condition is assumed, which expresses as: v = 0, δu/δy = 0. In the ground and the surface of the building, no slipping boundary is assumed, which is: u = v=0.
Figure 1.13: Velocity vector distribution around the asymmetrical building.
Figure 1.14: Velocity vector distribution around the symmetrical building.
Figure 1.13 is the distribution of the velocity around the asymmetrical building at the pedestrian-level which has a height of 1.5m, which proves that the air splits at the building side when blocked by the windward side of the building, and the maximum velocity exists at the fore corner of along the longitudinal side because of the asymmetric of the building. At the back side of the building, eddy flow is formed when the two split air flow meets, which is closer to the shorter side of the building because of the asymmetric of the building.
The contrast of the two figures proves that the asymmetry of the building can cause turbulent flow at the back side of the building.
Figure 1.15: Pressure distribution around the asymmetrical building.
Figure 1.16: Pressure distribution around the symmetrical building.
Figure 1.15 is the contour of the pressure around the asymmetrical building, which proves that windward side of the building is acted by positive pressure, which is higher in the area near the building and lower in the area far from the building. The maximum value of the wind pressure appears at the front edge of the windward, where the area with lowest wind speed is also appears. The maximum negative pressure of the wind pressure appears at the front edge of the ledge part of the longitudinal side, where the area with highest wind speed appears. The negative wind pressure at the two side of the building proves that wind speed increase at the area, which justifies the wind velocity distribution described in Figure 1.13. Negative pressure also exists in back side of the building where big turbulent flow exists. Figure 1.16 is the contour of the pressure around the
symmetrical building, which has the same characteristic as the asymmetrical one. However, negative wind pressure equals in the two sides of the building because of the symmetry of the building. Negative wind pressure area also appears at the back side of the building, but the pressure value is much less than that of the asymmetrical building because there is no turbulent flow area in the back side of the symmetrical building.
1.2.1.
Computational fluid dynamic simulations and wind tunnel
test comparisons for different bluff-body shapes
Ceccarini [26] analyzed different bluff-body shapes with the aim of verifying the accuracy of the results obtained from numerical simulation (by using commercial CFD code). The numerical results are compared with experimental wind tunnel test data. Different calculation grids and turbulence closure models have been used in order to analyze error sources. The results obtained provide a preliminary evaluation of the possibility of integrating CFD models as an essential step in the design process.
The governing equations for a fluid can be solved with a finite-volume method. The Navier-Stokes equations for the conservation of mass and the conservation of momentum are respectively:
!"
!#! " #$" &'( $ % (1.3) "! &'!# !" # $ & )# "( &' $ &"* ! "+̅ ! " #
-!" (1.4)
These equations along with the conservation of energy equation form a set of coupled, nonlinear partial differential equations. It is not possible to solve these equations analytically for most engineering problems. However, it is possible to obtain approximate computer-based solutions to the governing equations for a variety of engineering problems replacing the continuous problem domain with a discrete domain using a grid.
Flow over a cylinder is a fundamental fluid mechanics problem of practical importance. The flow field over the cylinder is symmetric at low values of Reynolds number. As the Reynolds number increases, flow begins to separate behind the cylinder causing vortex shedding which is an unsteady phenomenon. In this studies an unsteady (time dependent) solver has been applied to capture these effects, as appropriate. Comparing different combinations of cylinders shapes while maintaining a constant Reynolds number shows how drag forces acting on the walls of the cylinders are highly dependent upon the section shape. The effects of viscosity and the different configurations of flow separation upon pressure distribution can be observed. The basic idea of the three shapes choice (see Figure 1.17, Figure 1.18 and Figure 1.19) is to observe how the vortex shedding varies depending upon slight modification of the bluff body shape.
Figure 1.17: Square shape (SQ).
Figure 1.19: NB Shape.
Figure 1.20: Contours of static pressures.
Figure 1.21: Contours of vorticity magnitude.
Comparing the simulation results for different shapes, it can be observed that the presence of rounded corners determines a significant reduction of both drag and lift coefficients for same inlet flow conditions and wind incident angle. The shape of the body also affects histograms of both drag and lift coefficients due to the reduction of the
intensity of vortex shedding. More complex shape of the body produces a spreading of the frequency of vortex shedding. Also the wind incident angle affects significantly the pressure distribution around the body. As a consequence the drag and lift coefficients values was changing considerably. The simulation results indicate the need to perform the analysis for different wind incident angles. These findings can be justified by the analysis of the velocity, pressure and vorticity fields around the body. In fact, the velocity magnitude, strongly linked to the vorticity magnitude, is also highly influenced from the different shapes. The sharp angle of figure SQ causes an increasing dimension of the vortex behind the body, and its dynamic action on the square’s sides perpendicular to the wind flow direction is more relevant. It was also observed how the use of round corners brings a lower presence of vorticity along the RC body and therefore a lower value of lift coefficient appeared. On the contrary a more asymmetric behavior instead is noticed in the vortex shedding in the case of square section. Consequently, this behavior leads to an increased value of lift coefficient.
Some general considerations can be drawn for the experience obtained using the CFD in wind engineering applications. Some important difficulties are found in reproducing a realistic configuration of the flow field around different bluff bodies. These are mainly due to the high frequency components of the wind velocity and pressure in the flow field. The commercial CFD codes are not able to reproduce this high variability and to reproduce with sufficient accuracy the dynamic effects due to pressure variation. Furthermore generally CFD codes lack a high precision in reproducing the atmospheric boundary layer. This leads to difficulties in recreate the realistic turbulent flow where the bluff body is immersed. Not all the details of the complex motion are, however, in good agreement with the experimental observations. This is not very surprising in view of the presence of larger scale 3D fluctuations which lead to a low-frequency modulation of the
shedding. These fluctuations cannot be accounted for in a 2D calculation approach, but only in a much more expensive 3D large eddy simulation. Good agreements in the general qualitative trend are found for the different shapes. An overestimation of both the mean drag and the fluctuating lift and underestimation of the strength of the shedding motion are also noticed. This is mainly caused by the excessive production of turbulent kinetic energy in the stagnation region in front of the cylinders.
1.2.2.
Pressure distribution on regular planar shape, low-rise
buildings
Even for plan-symmetric buildings, the wind pressure distribution can be asymmetric, inducing torsion in the structure. Tamura, Kikuchi, Hibi [25] analysed and superimposed instantaneous extreme pressure patterns in order to obtain the maximum load effects at the base (maximum shear and torque). The ensemble averaged extreme pressure patterns causing the maximum along-wind base shear FDmax and torsional base
moment MTmax have a similar asymmetric pressure pattern.
Figure 1.22: Comparison of actual wind load Cp causing maximum along-wind base shear FDmax and
quasi-steady wind load GCp. a) Square model. b) Rectangular model.
The above figure compares the ensemble averaged instantaneous pressure distributions Cp causing the maximum along-wind base shear FDmax and the mean
pressure distributions Cp. Here, the mean pressure distributions Cp were multiplied by the
gust effect factor G (=FDmax/FDmean) equal to 2.92, averaged over 154 samples.
The large and unevenly distributed positive pressure on the windward wall, the small negative pressure on the leeward wall, and the large local suction near the leading edge of a side wall are the special features of the actual wind load Cp causing maximum
along-wind base shear FDmax. As the actual wind load Cp is not as symmetrical as the
quasi-steady wind load GCp; it is important that some across-wind and torsional
components can act on the low-rise building model even at the moment when the maximum along-wind base shear was recorded.
Figure 1.23: Ensemble averaged extreme wind pressure distributions for various base conditions. a) Maximum roof beam bending moment at windward end. b) maximum roof beam shear force at
windward end.
Figure 1.23 shows examples that demonstrate the extreme pressure patterns varying due to the load effects and the supporting conditions. The conditionally averaged extreme pressure patterns for the maximum bending moment at the windward roof end vary especially on the windward wall due to the column base conditions, as shown in Figure 1.23 (a). However, there is no significant difference in those for the shear force, as shown in Figure 1.23 (b). As Kasperski [8] pointed out, positive side roof pressures
should also be taken into account in structural design considering combinations with dead load or snow load.
The ensemble averaged actual extreme pressure distributions Cp causing the
maximum load effects of negative and positive sides of the roof pressure will be compared with the LRC results.
The actual extreme wind pressure distributions Cp causing the maximum
quasi-static load effects on low-rise building models are conditionally sampled and examined on the basis of multi-channel wind tunnel pressure data. The total load effects of the six wind load components for low-rise building models result in a 30% increase on average of the peak normal stress in column members compared with the case only applying the along-wind load. The actual wind loads Cp show the limitation of the quasi-steady design
wind load GCp.
1.2.1.
Across-wind and torsional motion coupling for different
along-wind eccentricities
Using a simplified procedure based on the Rayleigh-Ritz method, the effect of various structural properties has been studied by Islam, Ellingwood, Corotis [22]. A comprehensive three-dimensional dynamic analysis of structurally asymmetric high-rise buildings subjected to stochastic wind forces has shown that there is a significant transfer of energy between the across-wind and torsional motion for along-wind eccentricities of the center of rigidity.
Random vibration theory is used to obtain the response statistics that are important for checking the serviceability of the building. Surface pressures measured in wind-tunnel tests are analyzed to determine the spectra and cross spectra among the force components. The effects on building response of eccentricities in centers of rigidity and/or mass and of
the correlation among the force components are examined. The formulation relies on features characteristic of many tall buildings, i.e., the centers of mass of all floors lie on one vertical axis, and all stories have the same radius of gyration and the same ratios of translational and torsional stiffness.
The effect of various structural properties on building acceleration was studied using a high-rise building having dimensions 30 X 30 x 180 m (98 x 98 x 591 ft) and an average mass density of 190 kg/m3. Figure 1.24 shows that there is a significant transfer of energy between the across-wind and torsional motion for along-wind eccentricities of center of rigidity.
Figure 1.24: RMS Acceleration for Correlated Forces – Eccentric Rigidity.
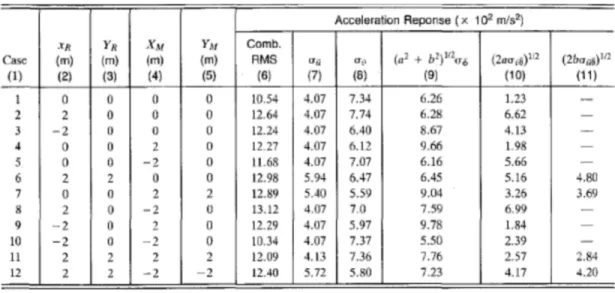
Contrary to general belief, the combined acceleration can be higher for uncorrelated than for correlated forces. As pointed out by Islam, the across-wind and torsional acceleration are significantly correlated for nonzero offsets, whereas the correlation is negligible for symmetric buildings. Moreover, for across-wind offsets in the center of rigidity (see case 6 in Table 1.1), the building response is similar to the case with only along-wind offset (case 2) and the correlations between the along-wind and torsional accelerations are negligible.
Table 1.1: Effect of eccentricities on RMS Acceleration (UH=28 m/s, a=b=15 m).
Table 1.1 shows the relative contributions of the individual terms of (12) to the total RMS acceleration for individual as well as combined offsets to centers of rigidity and mass. The rapid increase in the total acceleration for positive xR is almost entirely due
to the increase in the covariance term, σvθ. For negative offsets, the increase in the
combined acceleration is less; that increase, however, is partly due to the sharp increase in the torsional acceleration and partly due to the increase in the covariance term. The significant increase in the torsional acceleration for windward offsets of the center of rigidity is also evident. Besides contributing to the total acceleration, the torsional acceleration also may cause building occupants to perceive a rotating horizon, which enhances their awareness of the motion. Thus, an increase in torsional acceleration, even if it is associated with a decrease in the across-wind acceleration, may be critical as far as serviceability of the building is concerned.
Figure 1.25: RMS Acceleration for Correlated Forces – Eccentric Mass.
Considering eccentricities in the center of mass (the eccentricities in the center of rigidity were set equal to zero in this case), it can be noticed that both torsional and total accelerations are more sensitive to positive than negative offsets of the along-wind coordinate of center of mass (xM). As before, the across-wind acceleration, although large,
is no longer as dominant as it was for mechanically uncoupled buildings (Tallin and Ellingwood 1985). In fact, in some cases the covariance term is as large as the across-wind component itself and the torsional component may be even larger (Islam 1988). For negative offsets, the increment in the total acceleration is due to the sharp increase in the covariance term, whereas for positive offsets the increment is mainly due to the increase in the term involving the torsional acceleration. For offsets in the across-wind coordinate of the center of mass, there was only a modest increase in response (Islam 1988). Table 1.1 shows that when both centers of mass and rigidity are offset to the same location, the total RMS acceleration is less than that calculated for individual eccentricities. This is
attributed to the fact that the building becomes mechanically uncoupled for coincident centers of mass and rigidity. Individual offsets in centers of mass or rigidity tend to result in larger rms accelerations.
The effect of building aspect ratio on RMS acceleration was also examined. Three different buildings having height-to-width ratios of 4:1, 6:1, and 8:1 were used for this purpose.
Figure 1.26 and Figure 1.27 show the increase in the total RMS acceleration at the corner of the building as a function of along-wind eccentricities in the center of rigidity and mass, respectively. The effect of mechanical coupling appears more significant for slender buildings, particularly for offsets in the center of rigidity. This increase is mainly attributed to the increase in correlation between the response components for slender buildings. The correlation between the across-wind and torsional accelerations and along-wind and torsional acceleration as a function of along-along-wind offsets of the center of rigidity and mass appears to be different for buildings having different aspect ratios. In general, the acceleration components appear to be more highly correlated for slender buildings.
Figure 1.27: Effect of aspect ratio on combined acceleration – Eccentric Mass.
Statistical correlation between the across-wind and torsional motions plays a significant role in determining the response of structurally asymmetric tall buildings. Along-wind eccentricities in centers of mass and rigidity may result in an increase in the building accelerations, particularly near the perimeter of the building. Unlike structurally symmetric buildings, where the across-wind component is the major contributor, all components may contribute to the accelerations of an asymmetric building. Increases in torsional acceleration are particularly significant because torsional motion is known to increase an occupant's awareness of motion, and torsional effects are not addressed in modern codes of practice.
Summarizing the results obtained, the corner RMS acceleration is affected by the eccentricities of the center of rigidity and of mass as follows:
◦ For ?'9 0 (CR offset downwind), the total acceleration increases (↑ A%(%);
◦ For ?' ; 0 (CR offset upwind) the increase in the total acceleration is lower
(↑ A%(% due to covariance term ↑ B#)*) and with significant increase of torsional
acceleration ↑ B*));
◦ For ?+ 9 0 (CM offset downwind) both the total acceleration A%(% and the
rotational acceleration A*) increase;
Therefore, the acceleration response is more sensitive to downwind offsets of the center of mass or rigidity than to upwind offsets. Moreover, even if across-wind acceleration is still large, it is not dominant as for uncoupled buildings. Across-wind offsets of the center of mass or rigidity lead to smaller increase of the total acceleration $!$!. Individual
offsets in centers of rigidity or mass tend to result in larger rms accelerations. The effect of the nature of the eccentricity is small, but higher values of the total acceleration are noticed for offsets in the center of rigidity. Statistical correlation between the across-wind and torsional motions plays a significant role in determining the response of structurally asymmetric buildings.
1.2.2.
Influence of planar shape on wind response
Liang, Li, Liu, Zhang, Gu [21] investigated wind-induced dynamic torque on cylinders with rectangular planar shape with various side ratios through a series of model tests in a boundary layer wind tunnel. Based on the experimental investigation, this paper presents empirical formulae of torque spectra, RMS torque coefficients and Strouhal number, as well as coherence functions of torque. An analytical model of wind-induced dynamic torque on rectangular tall buildings is established accordingly. Comparisons of the results from the proposed model and the wind tunnel measurements verify the reliability and applicability of the developed model for evaluation of torsional dynamic wind loads on rectangular tall buildings. A calculation method is presented based on the proposed model to estimate wind-induced torsional responses of rectangular tall buildings in the frequency domain.
Wind induced torsional vibration of tall buildings can enlarge the displacement and acceleration near the peripheries of their cross-section; especially when the side faces of a rectangular tall building are wider, and/or it is asymmetric, and/or its lowest torsional
natural frequency approaches either of its lowest translational natural frequencies, wind-induced torsional responses may become the main part of the total responses for the peripheral points of such a building. Meanwhile, habitants in a tall building are more sensitive to torsional motion than translational motion. Therefore, wind-induced torsional responses should be taken into account in the design of tall buildings. The mechanism of torsional wind loads on a rectangular building is very complex.
Apparently, wind turbulence (including along-wind turbulence and across-wind turbulence) and wake excitation (including vortex shedding and reattachment) are two main mechanisms which induce dynamic torque. Therefore, it is important to measure the time histories of resultant dynamic torque on the four side faces of a rectangular building model by wind tunnel tests to include the combined effect of the above-mentioned two mechanisms.
On the basis of the extensive experimental data obtained from a series of model tests in a boundary wind tunnel, a mathematical model for evaluation of torsional dynamic wind loads on rectangular tall buildings is presented in this paper. Comparisons of the results between the proposed model and the wind tunnel measurements verify the reliability and applicability of the developed model. The main conclusions obtained in this study are as follows:
- The RMS (Root Mean Square) torque coefficient increases as the side ratio of rectangular tall building increases. The Strouhal number of rectangular tall building is almost identical when D/B<1/ 2, and when 1/2 <D/B<4, the Strouhal number decreases as the side ratio increases.
- When 1<D/B<4, the torque spectrum has a fairly broad bandwidth. There are two peaks on the spectrum curves which are induced by vortex shedding and reattachment of separated flow, respectively. The power division between the two
peaks and the location of the two peaks are strongly correlated to the side ratios, aspect ratios of rectangular tall buildings and the turbulence intensity of incident wind flow.
- When ¼<D/B< 1, there are two peaks on the torque spectrum curves. The first peak on the spectrum is induced by the along-wind turbulence on the windward side, and the second one is due to the vortex shedding effect on the leeward side. The bandwidths of torque spectra are rather narrow and are distributed mainly at low frequency range.
- The average relative errors between the results determined by the proposed formulae of the wind induced torque spectra, RMS torque coefficients and coherence function and the experimental data obtained by the wind tunnel test are less than 10%; hence the established model for evaluation of torsional dynamic loads are reliable and applicable to the design of isolated rectangular tall buildings.
2. Dynamic response of asymmetric coupled buildings
2.1. Hypothesis
In order to analyze an N-story building, some assumptions have to be made, in order to idealize the structure, as follows:
- rigid floor decks;
- mass-less axially inextensible columns and walls that support the floors; - the centers of mass %% of the floors lie on one vertical axis;
- the centers of resistance %&" do not necessarily lie on the same vertical axis;
- the center of resistance of the i-th story (single story CR or %&") is the point such
that if an horizontal force is applied to it, the i-th floor deforms in translation without torsion (equal to SCT as previously observed);
- the two orthogonal principal axes of resistance of the i-th story pass through the center of resistance %&"; if a force is applied along one of them, the floor
displacement will be in the same direction;
- the torsion, if any, takes place around the center of resistance;
- the principal axes of resistance of all the stories are identically oriented;
- each floor has three degrees of freedom: the displacements of CM , relative to the
ground, in the x and y directions, and the rotation about a vertical axis; therefore the degrees of freedom of the i-th story are &'", &(" and &#" respectively;
- ground accelerations u&&gx
( )
t and u&&gy( )
t are assumed to be the same at all points of2.2. Equations of motion
The equations of motion for the undamped idealized system described in §2.1, subjected to ground accelerations u&&gx
( )
t andu&&gy( )
t , are:'() ' *( $ + (2.1) ) , - . . . - . . . -/ 0 ()) (1)* ()+ 2 ' 0 *)) *), . *), - * ,, *+, -. *+, *++ 2 ,( ) (1* (+ / $ * 0-3() .) . -3().+ 2 (2.2) where: ()$4 &/' &0' + &1' 5 , (1*$4 6/&/# 60&0# + 61&1# 5 , (+ $4 &/( &0( + &1( 5 (2.3) - $ 4 7/ -- 70 -- -- - . -- 71 5 (2.4) where:
6" $6"!2!3% is the mass radius of gyration of the i-th floor deck about a vertical axis
through the center of mass CM, 7" is the lumped mass at floor i.
The stiffness sub-matrices are:
*)) $ 8 9 9 9 9 :;<'/'<'0= *<'0 *<'0 ;<'0'<'4= *<'4 *<'4 . . . . *<'1 *<'1 <'1 > ? ? ? ? @ (2.5)
*++ $ 8 9 9 9 9 :A<(/'<(0B *<(0 *<(0 A<(0'<(4B *<(4 *<(4 . . . . *<(1 *<(1 <(1 > ? ? ? ? @ (2.6) !!!! " # # # # # # # # # # $%" &" ' # ()$"#)$#* $ " &"&# )$# $ " &"&# )$# % " &# ' # ()$##)$%* $ " &#&% )$% $ " &#&% )$% % % % % $ " &&'"&&
)$&
$ " &&'"&&
)$& % " && ' # )$& , -. (2.7) .#$ $ / 0 0 0 0 0 0 0 0 0 1' 2%
34&%5'%!4&(5'(6 &
' 2( 4&(5'( & ' 2% 4&(5'( ' 2(
34&(5'(!4&)5')6 &
' 2) 4&)5') &' 2( 4&)5') ( ( ( ( & ' 2* 4&*5'* & ' 2*+% 4&*5'* ' 2* 4&*5'* 7 8 8 8 8 8 8 8 8 8 9 (2.8) .,$ $ / 0 0 0 0 0 0 0 0 0 1' 2%
34'%5&%!4'(5&(6 &
' 2( 4'(5&( & ' 2% 4'(5&( ' 2(
34'(5&(!4')5&)6 &
' 2) 4')5&) &' 2( 4')5&) ( ( ( ( & ' 2* 4'*5&* & ' 2*+% 4'*5&* ' 2* 4'*5&* 7 8 8 8 8 8 8 8 8 8 9 (2.9) where:
C'" and C(" are the static eccentricities for story i,
<'", <(" and <#" are the stiffnesses of story i in x and y-direction and in torsion,
2.3. Governing parameters
Figure 2.1: Plan view of a generic asymmetric structure.
Considering a generic asymmetric building (see Figure 2.1) we can define the following parameters:
◦ C,- and C.- are the translational stiffnesses of the j-th resisting element (column
or wall) of the i-th story along the principal axes of resistance x and y respectively; ◦ 3,&" ∑ C- ,- and 3.&" ∑ C- .- translational stiffnesses of the i-th story;
◦ considering as origin the center of mass E+, the location of the j-th resisting
element is defined as F?-, H-I;
<#"$D E'5F5!3& 0 5 'D E(5G5!3& 0 5 (2.10)
◦ the location of the center of resistance of the i-th story is given by the static eccentricities (between %% and %6"), C'" and C(";
◦ for a story with discrete resisting elements, we have
C'" $ ∑ E5 (5G5 <(" (2.11) C("$ ∑ E5 '5F5 <'" (2.12) Since the analyzed structures have the same location and stiffness of the resisting elements along the height of the building, that is the story plan does not change (i.e. <'" $<' IJ6 K $ ", / , L, <("$<( IJ6 K $ ", / , L and <#" $<# IJ6 K $
", / ,L) we have: C'" $C' $ ∑ E5 (5G5 <( (2.13) C(" $ C($ ∑ E5 '5F5 <' (2.14)
Figure 2.2: One-way symmetric plan.
Assuming a one-way symmetric system (/, J 0, /." 0) and considering a
rectangular floor plan with K/ bays in the x direction and K0 bays in the y
direction (see Figure 2.2), with columns at the bays’ corners and one wall with different locations (?1) according to the different cases, we have that:
3.& " 3." L C. -" C.,1344. L C.,564789 (2.15) where: C.,1344 " 12 M N,,1344 O: (2.16) C.,%(%,564789;" 'K/. 1+'K0. 1+ 12 M N,,564789 O: (2.17)
Since we consider that the system has a symmetric disposition of the columns, the reference system is centered in the center of mass and the Young Modulus is the same for all the elements, (1.18) reduces to:
C' $
"0 M'!89:: G89::
"0 M'!89::';N/' "=;N0' "= "0 M'!;<:=2>
(2.18) ◦ We introduce also the relative eccentricity as the ratio between the eccentricity
and the building dimension in the same direction: O $ C?@: $
C'
P (2.19)
Noticing that the stiffness and mass inertia radii can be both expressed with respect to the center of mass and stiffness, so that the Polar Moment of Inertia of masses and stiffnesses, the parameters defining a generic i-th story of the structure are (for sake of simplicity and since all the stories have the same characteristics the subscript i will be omitted):
- Mass of i-th story:
7 $AQA@?2 'Q9;;B R P
S (2.20)
- Polar Moment of Inertia of masses with respect to CM: M2!3%$M2$T ;G 0 'F0= U7 2 $7 62!3% 0 (2.21) )M2!3%$ V!$! "0 S WRP ;P 0 'R0=X (2.22)
- Mass radius of gyration referred to the center of mass: 62!3%$Y M
2
7 (2.23)
It has to be noticed that for an N-story structure with equal stories both the mass and M2 of the system are just multiplied by the number of the stories N, so that the
mass radius of gyration of the system 62!3%!!$! is equal to the story one 62!3%
- Polar Moment of Inertia of masses with respect to %6": M2!36
62!3& $Y M 2!3& 7 $ " 62 Z62 0 'C' 0 (2.24) - Polar Moment of Inertia of Stiffnesses with respect to %&":
MB!3& $MB $<# $D E'5F5!3& 0 5 'D E(5G5!3& 0 5 (2.25) - Stiffness radius of gyration with respect to the center of stiffness:
6B!3&$6B $Y M B < ( $Y < # < ( (2.26) - Polar Moment of Inertia of Stiffnesses with respect to CM:
MB!3%$D E'5F5!3% 0 5 'D E(5G5!3% 0 5 (2.27) - Stiffness radius of gyration referred to the center of mass:
6B!3% $Y
M B!3%
< (
(2.28) Dynamic properties:
◦ Uncoupled translational frequency:
:-$;
5./!&
<010
(2.29)
◦ Uncoupled torsional frequency:
:2!34$;
=5!34
=6!34
(2.30)
◦ Uncoupled frequency ratio:
>0$?34$
:2!34
:- (2.31)
◦ Physical parameter of the structure:
)2$?37$
25
3. SAP Model – Structures analyzed
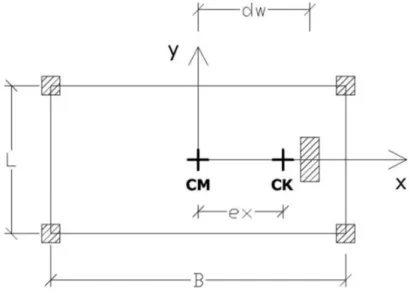
The model analyzed is a simple structure (see Figure 3.1), which has four corner columns and a wall at a distance dw from the center of mass (CM), which is located in the
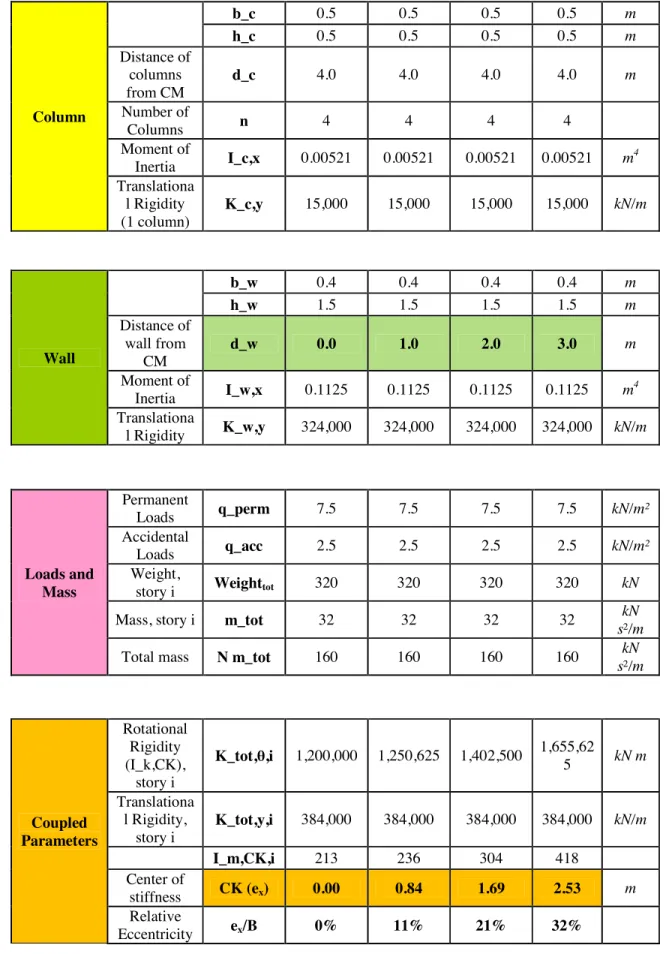
center of the plan (the mass of the structure, given by the dead and live loads, is supposed to be uniformly distributed on the slab). The plan is the same along the height of the structure. Four different values of the one-way eccentricity have been chosen, shifting the wall from the center of mass (zero eccentricity) to one side of the building. The parameters and eccentricity calculations are summarized in Table 3.1. Structures from one to eight story were analyzed, each of them with the four values of eccentricity.
Figure 3.1: Analyzed Structure, Plan View.
Structure Parameters Height of the building H 5 5 5 5 m Width in the x direction B 8 8 8 8 m Width in the y direction L 4 4 4 4 m Young Modulus E 30000000 30000000 30000000 30000000 kN/m²
Column b_c 0.5 0.5 0.5 0.5 m h_c 0.5 0.5 0.5 0.5 m Distance of columns from CM d_c 4.0 4.0 4.0 4.0 m Number of Columns n 4 4 4 4 Moment of Inertia I_c,x 0.00521 0.00521 0.00521 0.00521 m 4 Translationa l Rigidity (1 column) K_c,y 15,000 15,000 15,000 15,000 kN/m Wall b_w 0.4 0.4 0.4 0.4 m h_w 1.5 1.5 1.5 1.5 m Distance of wall from CM d_w 0.0 1.0 2.0 3.0 m Moment of Inertia I_w,x 0.1125 0.1125 0.1125 0.1125 m 4 Translationa l Rigidity K_w,y 324,000 324,000 324,000 324,000 kN/m Loads and Mass Permanent Loads q_perm 7.5 7.5 7.5 7.5 kN/m² Accidental Loads q_acc 2.5 2.5 2.5 2.5 kN/m² Weight,
story i Weighttot 320 320 320 320 kN
Mass, story i m_tot 32 32 32 32 kN
s²/m
Total mass N m_tot 160 160 160 160 kN
s²/m Coupled Parameters Rotational Rigidity (I_k,CK), story i K_tot,θ,i 1,200,000 1,250,625 1,402,500 1,655,62 5 kN m Translationa l Rigidity, story i K_tot,y,i 384,000 384,000 384,000 384,000 kN/m I_m,CK,i 213 236 304 418 Center of stiffness CK (ex) 0.00 0.84 1.69 2.53 m Relative Eccentricity ex/B 0% 11% 21% 32%
4. Analysis methods
4.1. Static analysis
In the second part of this research, in order to assess the differences between wind and seismic response of plan asymmetric structures, and to assess the influence of the structural eccentricity on the response, a linear static analysis has been done. Wind and Seismic Equivalent Static Forces were computed, with reference to the ASCE 7 – 05.
Choosing a high seismic area in California and a windy area in Florida, the worst case scenario was considered for both the loads.
4.1.1.
Wind Load
As to ASCE 7-05, the static wind pressure has been computed, using the parameters summarized in the chart below.
Exposure
category B
Urban and suburban areas
Basic Wind
Speed V= 180 (Florida) mph
Figure 26.5-1B (Occupancy category III and IV)
Gust Factor G= 0.85 Stiff Buildings: I & " [\ 1] % " 2345 !"#$%& ' ( '") "!#$ " # %# ($$#&# ' ( '") $% "! * Flexible buildings: I % " [\ § 26.9.5 Pressure Coefficient Cp= 1 Velocity Pressure q= 0.00256 Kz Kzt Kd V 2 I psf Importance Factor I= 1.15 3% probability of exceedance in 50 years
Exposure Coefficient Kz= 2.01 (z/zg) 2/α =2.01 (z/1200)2/7 Topographical Factor Kzt= 1 § 26.8.2 Wind Directionality Factor Kd= 0.85 Table 26.6-1 (for Buildings) Wind Pressure p= q G Cp psf
Table 4.1: Wind Pressure Computation, ASCE 7 - 05.
Once the pressure distributions are computed for different heights of the stories, the point load is applied to the each floor diaphragm (considering the respective influence areas). The load values are summarized in Table 4.2.
Force applied
at story:
Wind Loads
8-Story 7-Story 6-Story 5-Story 4-Story 3-Story 2-Story 1-Story
1st 112 110 101 101 101 101 101 101 2nd 137 134 123 123 123 123 123 3rd 154 150 138 138 138 138 4th 167 163 150 150 150 5th 178 174 160 160 6th 187 183 169 7th 196 192 8th 203
Table 4.2: Wind Loads.
4.1.2.
Seismic Load
The equivalent Base Shear is given by:
& $ @8A (4.1) where: @8$B98 :! ; (4.2) @8* B9% C DE=. F + GH2 C * C -(4.3)