THE DETERMINANTS OF GROWTH FOR SMALL AND MEDIUM SIZED FIRMS. THE ROLE
OF THE AVAILABILITY OF EXTERNAL FINANCE by
Leonardo Becchetti and Giovanni Trovato
1. Introduction
Since 1931, when it was first formulated, Gibrat's law has been a useful theoretic al benchmark for theoretical and empirical research on the determinants of firm growth. Its two main points may be summarised as follows: i) the rate of growth of a firm is independent from its size at the beginning of the period; ii) the probability of a given rate of growth during a specific time interval is the same for any firm within the same industry. It is worth noting that the second point is more general than the first and implies that, after controlling for industry characteristics, expected rates of growth should not be affected by any other variable.
Most empirical analyses reject the hypothesis of independence of growth from size and age. Firm growth is significantly and negatively related to size and age when only surviving firms are considered and, to a lesser extent, when survivorship bias is taken into account. The paucity of available data prevented investigation in other directions of interest. More detailed empirical analysis on the determinants of growth going beyond the traditional size-age-growth relationship should be of great relevance both for economists and policymakers. To consider an example, the relationship among firm size, availability of external finance, access to foreign markets and ownership structure has been largely neglected even though it may provide significant policy insights on the optimal corporate governance and regulation of financial institutions in support of
industrial and economic growth. This paper aims to fill this gap by considering a large set of potential determinants of firm growth. The paper is divided into five sections (including introduction and conclusions). In the second section we briefly describe theoretical and empirical findings showing that a significant impact of size and age on firm growth has been found for different countries and estimation periods. In the third section we present some descriptive findings on the determinants of growth for a sample of around 4000 Italian firms between 1989 and 1997. In the fourth section we present our econometric results which control for heteroskedasticity, serial correlation and survivorship bias. These results show that size and age are not the only determinants of growth and that financial constraints and access to foreign markets have a significant impact on growth for small and medium sized firms.
2. The theoretical and empirical literature on Gibrat's law: the state of art
Theoretical contributions to the determinants of firm size may be divided into stochastic and deterministic approaches. The stochastic approach argues that in a world with no differences ex ante in profits, size and market power across firms, all changes in size are due to chance. The deterministic approach assumes, on the contrary, that differences in the rates of growth across firms depend on a set of observable industry and firm specific characteristics.
According to Mansfield (1962) Gibrat's law may be tested in three different versions. It may in fact hold: i) for all firms within a given industry in the considered time interval including also firms which did not survive; ii) only for surviving firms in the considered period; iii) only for firms large enough to reach the minimum efficient scale (MES).
Empirical tests of Gibrat's law usually follow three directions: i) a regression of the log of current size on the log of
the beginning of period size in which the null hypothesis of a slope equal to one is tested; ii) a regression of the rate of growth on the beginning of period size (and eventually on other variables); iii) a regression of the type i) in subgroups divided according to size, age or other variables which may be thought to affect growth.
All of these approaches have to overcome three fundamental problems. First, (survivorship bias) if the investigation is based only on surviving firms it is highly likely that the selection of the sample is significantly correlated with the same variables which may potentially affect firm growth. A typical example is that small firms may be more likely to fail and may not be more likely to grow than larger firms. If this is true Gibrat's law will be rejected when tested only on surviving and not rejected when tested on surviving and non surviving firms. Second, if Gibrat's law is rejected and small firms grow more than large firms, the variance of growth should decrease with firm size generating heteroskedasticity problems.1 Third, ordinary least squares give inconsistent estimates if growth is serially correlated. When testing for the determinants of firm size it is necessary - if we intend to test the first version of Gibrat's law - to correct for heteroskedasticity and serial correlation by adopting an estimation approach which weights results in the surviving firm sample for the effects of various regressors on the probability of survival at the beginning of the estimation period.
The last thirty years witnessed a large number of empirical papers which only partially took into account these problems and tested Gibrat's law in the United States2, in England,3 in Portugal,4 in West Germany5, in Italy6 and in
1 This problem should lead to wider confidence intervals for small firm observations leading to an underestimation of the probability of rejection of Gibrat’s law.
2
Hall, 1987; Dunne et al., 1988; Evans, 1987; Audretsch, 1991,1995; Audretsch and Mahmood, 1995.
3
Kumar, 1985; Dunne and Hughes, 1994. 4
Canada.7 More specifically, while Dunne and Hughes (1984) and Mata (1994) correct for all of the three factors, Wagner does not correct for heterskedasticity, Evans (1987) and Hall (1987) for autocorrelation and Kumar (1985) for both heteroskedasticity and survivorship bias.
Contrary to Kumar (1985) and Wagner (1994), most of the above mentioned studies find a significant role of size on firm growth (Mata, 1994; Hall, 1987; Tschoegl, 1996; Audretsch et al., 1987; Weiss, 1988; Dunne et al., 1988) and some of them also for age (Dunne et al., 1988). This last finding is consistent with the idea that firms gradually learn their relative efficiency in the market after entry and need to grow at a higher rate if they want to survive (Jovanovic, 1982; Audretsch, 1995; Geroski, 1995; Baldwin and Rafiquzzaman, 1995).
Harhoff, Stahl and Woywode (1998) is, to our knowledge, the only paper which shows that variables different from size and age may significantly affect the rate of growth. In particular the authors find that limited liability firms experience significantly more rapid growth than unlimited liability firms. The likely explanations for this result are that higher personal wealth at risk in unlimited liability firms reduces incentives to invest in risky opportunities which may foster firm growth (Saint Paul, 1992; Zhang, 1998). Needless to say, this result has much wider normative implications than that on the age-size growth relationship
Moving in this direction our paper will identify in the next sections other relevant determinants of growth by investigating among variables such as access to foreign markets, financial constraints and ownership concentration.
5 Wagner, 1994. 6
Audretsch et al., 1987; Lotti et al., 1999. 7
3. The determinants of firm growth: descriptive findings
The Mediocredito database is a survey in three waves (1989-92, 1992-94 and 1995-97) on a sample of more than 5,000 firms drawn from Italian manufacturing.8 The sample is stratified and randomly selected (it reflects sector’s geographical and dimensional distributio n of Italian firms) for firms with 11 to 500 employees. It is by census for firms with more than 500 employees.9 In all of the three samples both qualitative and quantitative data (balance sheets for the 1995-1997 period) are collected. Qualitative data provide, among other things, information on ownership structure, availability of external finance, entitlement to state subsidies, and successful introduction of products and processes.10
8 All balance sheet data in the Mediocredito database are accurately checked. Balance sheet data come from CERVED which has the official information from the Italian Chambers of Commerce and is currently the most authoritative and reliable source of information on Italian companies.
Qualitative data from questionnaire are based on responses from a representative appointed by the firm collecting information from the relevant firm division. The questionnaire has a system of controls based on “long inconsistencies”, namely inconsistencies between answers to questions placed at a certain distance in the questionnaire (i. e. responses use of government subsidies (export subsidies) are matched with responses on the exact composition of the flow of funds available for investment - internal finance, debt finance, grants, soft loans. – (on the share of exported net sales).
In case of inconsistent information the firm is subject to a second phone interview. Firms which do not provide reliable information after being recontacted are excluded from the sample. A supplementary list of 8000 firms is built for each of the three year surveys in order to avoid that exclusions, generated by nonresponses or inaccuracies in questionnaire responses, alter the sample design. Substitutions follow the criteria of consistency between the sample size and the population of the Universe. An English version of the questionnaire which collects qualitative information is also available from the authors upon request.
9
The Universe of Italian firms with more than 500 employees is included in the sample.
10
The following selection bias of the Mediocredito dataset must be taken into account. More than 90 percent of observed small firms (below 50 employees)
Descriptive features of the sample (Table 1) show that more than 60 percent of surveyed firms have less than 50 employees. Ownership structure is highly concentrated as the average share of the first shareholder and of the control group are respectively around 50 percent and higher than 80 percent. 60 percent of firms are family owned. In this respect the sample reflects a typical feature of many industrialised economies in which family ownership has a relevant role.11 The inspection of the quantitative variables which are relevant for our analysis shows other interesting features of the sample (Table 2). More than 60 percent of firms have less than 50 employees and do not invest in R&D. Return on investment is negative for 20 percent of firms and not higher than 2 percent for more than 60 percent of them. More than 40 percent of firms have only one controlling shareholder.
To check whether our findings are robust to the survivorship bias effect we consider the last two waves of the Survey (1992-94 and 1995-97). We include in the sample only those firms participating in both surveys plus those participating in the first but not in the second. We therefore test the effect of 1994 variables on the 1995-1997 rate of growth.
Descriptive findings on average three-year rates of growth in the last wave (1995-1997) for different subgroups of firms show that the overall sample three-year rate of growth is around 4 percent for surviving firms and 2 percent when we also
are "società di capitali" (entrepreneurs have limited liability) while in the universe of Italian small firms this share is much lower and unlimited liability is widespread. When interpreting empirical results we must therefore consider that we are analysing the subset of Italian small and medium sized firms with the most advanced form of corporate governance.
11
La Porta et al. (1999) have recently emphasized the importance of family ownership on corporate structure in the world. They find that, in 1995, for firms with a market capitalisation of at least 500 million dollars, family owned firms represent 60 to 80 percent of the sample in Italy, up to 40 percent in the UK and 20 percent in the US. Countries like Israel, Honk Kong, Mexico, Argentina and Sweden all have in 1995 a share of family owned firms higher than 50 percent.
consider firms which did not survive (Tables 3 and 4). Age and size do matter. Size accounts for a significant part of dispersion around this average as the 30 percent of smallest firms in the sample that survived have a 7 percent rate of growth against a 2 percent of the 30 percent of largest firms (a negative rate of growth of 2 percent when we correct for firms which did not survive). Using the same percentiles of the distribution we compare the three-year rates of growth of young and old firms and of firms with high and low levels of leverage and financial pressure. When we just consider surviving firms the rate of growth for young firms is eight times as high as that of old firms (8 percent against 1 percent). When we consider also financial variables we find that differences in relative rates of growth among subgroups go beyond the well established stylised facts on size and age, already found in other countries and in different periods. Firms with higher availability of external finance (high leverage firms) grow much more than low leverage firms with the difference being more than double for firms below 50 employees. Firms which were credit constrained in 1994 have negative rates of growth (well below sample averages) even when not correcting for survivorship bias. Firms whose budget constraint is softened by state subsidies exhibit a relatively higher growth rate (6 percent against the 4 percent sample average, 4 percent against the 3 percent sample average when non surviving firms are included). On the contrary, firms with higher financial pressure grow significantly less when survivorship bias is taken into account (no growth against a 2 percent sample average).
A last strong difference is determined, as expected, by market power, with high market rent firms growing at a rate which is four times higher than the complementary subgroup.
4 The determinants of firm growth: econometric findings from multivariate analysis
A traditional method used in the literature to test Gibrat’s law consists of three steps (Chesher, 1979; Almus-Nerlinger, 1999) : i) the division of the sample in subgroups (i. e. small versus large, old versus young firms); ii) the estimation of an equation in which the deviation of individual firm size from subgroup average is regressed on its one and two period lagged values and iii) the test in each subgroup of the null hypothesis of size being a random walk after correcting for residual autocorrelation. This approach has serious shortcomings: i) it uses arbitrary cut-off values to generate subgroups and therefore it does not evaluate the marginal effect of a change in the regressors on growth; ii) it incurs in severe multicollinearity problems which alter values of regressors coefficients and give unreliable results in terms of different rates of growth among subgroups; iii) it does not consider the impact of a single regressor net of the effects that other variables may have on firm growth. For instance, it is impossible to verify with this test if size still has an effect after age has been considered and so on. To this purpose we present in the Appendix a correlation matrix for the variables which we think may have significant effects on firm growth (tab. A1). This matrix confirms the existence of some significant correlations among potential regressors. Without considering relationships among industry dummies we find in fact several correlation coefficients above .10: the positive ones between age and size, size and electrical equipment, access to foreign markets and mechanical equipment, size and access to foreign markets and the negative ones between leverage and age and leverage and size. This suggests, for instance, that the higher rate of growth of more leveraged firms found in tables 3 and 4 may be spurious as these firms grow more just because they are younger and smaller. Therefore a more reliable method appears that of estimating a multivariate model in which the dependent variable is changes in
size and each regressor represents a different factor which is expected to affect firm growth. We follow this approach by regressing the 1995-1997 rate of growth on a series of potential determinants. A part from the traditional regressors of age and size, we include controls for the availability of external finance, market rents and access to foreign markets. We in fact consider that, in a world of asymmetric information, the matching between profitable ideas and savings needed to finance them is imperfect. Reduced access to external finance may therefore limit growth and the market may "fail" if financially constrained firms have projects which are equally profitable as those of non constrained financed firms. The test on variables measuring the availability of external finance is of particular relevance in all countries having a financial structure similar to Italy.
In spite of the recent regulatory reforms which started affecting the system only in the years following those of our investigation (the December 1997 reform of corporate governance and the introduction of the dual income tax which provides tax allowances for equity financing), the Italian economy remains “bank-centred” compared with those of the main OECD countries and is still a good example of a “credit view economy” (Kashyap-Lamont-Stein, 1994).12 Given all these considerations we assume that leverage, provision of state subsidies and credit rationing may significantly affect firm growth in this environment. Furthermore, results from Harhoff, Stahl and
12
Bank lending remains the dominant source of external finance for small and medium sized firms. Stock market capitalisation to GDP remains abnormally low with respect to other industrial countries (45% against 65% in France and Spain and 140% in the US at the end of 1998) and the role of institutional investors is still insignificant (assets of domestic pension funds were 3 per cent of GDP at the end of 1996 against more than 50 per cent in the UK and US) (OECD, 1998). In spite of the recent structural reforms, both supply side (scarce propensity to dilute ownership) and demand side factors (relatively poor shareholder protection, insufficient repression of insider trading and poorer quality of financial information compared to the US) negatively affect the development of equity financing and make Italy quite similar to the “German financial system” archetype described by Allen-Gale (1995).
Woywode (1998) and theoretical findings on the relatively lower propensity to take risky venture of closely held firms (Saint Paul, 1992; Zhang, 1998) lead us to test the impact of ownership structure on growth. Access to foreign markets is equally important for firm growth since it represents a learning process that improves firm productivity (Delgado-Farinas, 1999). Market rents are an important control as differences in the rate of growth may simply depend on ex ante differences in market rents which proxy for firm competitive advantages or other types of entry barriers and may be maintained over time.
Our cross-sectional estimate for the determinants of growth has therefore the following specification:
i i i i i i i i i il n l l ik p k k ij m j j i nts Export Lev Ration Subsidy Qtnosep Birth Size Macroarea Pavitt Ind GROWTH ε β β β β β β β β γ δ α α + + + + + + + + + + + + + + =
∑
∑
∑
− = − = − = Re 8 7 6 5 4 3 2 1 1 1 1 1 1 1 0where GROWTH is the 1995-1997 rate of growth in the number of employees for the i-th firm, IND are m-1 industry dummies based on the ATECO9113 classification (m=1,..,20), PAVITT are
p-1 macrosector dummies (p=1,..,4) for firms belonging to Scale,
Specialised, Traditional and High-Tech industries,14
13
ATECO91 classification represents an improvement (with respect to ATECO81) of the Italian Statistical Institute (ISTAT) in the process of harmonisation with the European and American classification. The 2-digit Italian classification corresponds to ISIC, while the 4-digit classification to NACE.
14
These are three of the four Pavitt dummies (Scale, Specialised, High-Tech and Traditional sectors). We adopt both the Pavitt and the 21-sector extended classification since firms within the same sector often belong to different Pavitt macrosectors. Therefore the inclusion of both set of dummies does not generate too high correlation among regressors as shown in tab. A1 in the Appendix. Estimates without Pavitt dummies have also been performed and their results do not vary substantially from those presented in the paper. They are available from the authors upon request.
MACROAREA are n-1 macroarea dummies (n=1,..,4) for firms
located respectively in North-East, North West, Centre and South areas, SIZE are firm’s employees in 1994, BIRTH is the firm’s year of establishment. Theoretical (Short, 1984) and empirical (Mc Connel-Servaes, 1990) papers find that ownership structure is a relevant factor in determining performance. For this reason we introduce QTNOSEP which measures the total amount of ownership held by shareholders controlling the firm in 1994. Since government subsidies are another important determinant of firm performance (Gale, 1991; Schwarts-Clements, 1999) we add as a dummy SUBSIDY , indicating if the firm received soft loans or grants in the 1992-94 period. Financial constraints have been proven to be a serious barrier for growth perspectives of small and medium sized firms suffering from asymmetric information (Fazzari-Hubbard-Petersen 1988, Devereux-Schiantarelli 1990, Becchetti 1995, Schiantarelli-Georgoutsos, 1992). We therefore use RATION as a dummy indicating type I or type II credit rationing (the firm declares she asked and did not received credit (additional credit) at the prevailing rate in the 1992-94 period) and LEV (the 1994 ratio of total debt versus banks to total assets) as a proxy of firm creditworthiness.15 Since theoretical and empirical literature find a two-way causal relationship between efficiency and export status (Aw-Hwang, 1995; Clerides-Lach-Tybout, 1998) we introduce as an additional explanatory variable of growth EXPORT, a dummy for firms which exported in the 1992-1994 period. Finally, RENTS is a variable measuring firm
15 In balance sheet data the following debt items are registered: i) debt versus banks; ii) debt versus partners; iii) debt versus group; iv) debt versus suppliers - customers anticipated payments; v) bonds. Items ii) and iii) should be considered as equity more than debt, because non individual firms are often participated with a share higher than 50%. Item iv) is commercial debt more linked to operating expenses than to investment financing. We use total assets and not equity capital as a scale variable because all firms are small-medium sized, not listed in the stock exchange and most of them family owned. As a consequence, equity capital is often a symbolic balance sheet item, extremely volatile and not representative of firm’s stock of total assets.
market rents in 1994. Rents are calculated following Nickell (1996) and Nickell-Nicolitsas-Dryden (1997) as ((profits before tax+depreciation+interest payments-cost of capital*capital stock)/value added). We introduce this variable as a control to measure the impact of regressors on growth net of the effect of ex ante market power, consistently with the theoretical framework of Gibrat's law.
By adopting the above described specification we argue that: i) the "strong version" of the “growth independence” hypothesis holds if the null hypothesis under which none of the regressors coefficients (excluding the intercept) is significantly different from zero holds; ii) the "weak version" of the “growth independence” hypothesis holds if none of the regressors coefficients (excluding the intercept, the market rent and the industry and geographic al dummy coefficients) is significantly different from zero holds. We finally argue that external finance does not matter if the null hypothesis of the joint insignificance of the three following variables (LEV, RATION and SUBSIDY) holds.
We estimate the model for the overall sample and for the subgroups of firms with more than 100 (large firms) and less than 50 employees (small firms) to account for nonlinearities in the relationship between regressors and the dependent variable as far as size classes change. To avoid heteroskedasticity we adopt robust variance estimators,16 while, by using changes in size as the dependent variable, we avoid problems of serial correlation among size levels in subsequent years.
Our results show that several factors significantly affect growth when survivorship bias is not taken into account. In addition, the inclusion of variables measuring the availability of external finance (subsidy, leverage and financial constraints) significantly affects firm growth and the finding is robust to the inclusion in the sample of firms which went bankrupt (Tables 5 and 6). This
16
For the definition of robust variance estimators see Huber (1967) and White (1992).
result supports theories and empirical papers finding that availability of external finance is a constraint to small firm investment and growth and its evidence on an Italian sample is consistent with the institutional feature of the bank-centered financial system described above.17
When we consider surviving firms we find that firms which were younger and smaller in 1994 have higher rates of growth in the following three years. Both effects look stronger in the small firm sample. The nice result is that financial constraints also seem a serious concern as growth is significantly lower for
firms which declare they were rationed in 1994,18 and
significantly higher for firms receiving grants or soft loans. This last effect is not significant in the large firm sample. Access to export markets and market rents are positive and significant only,
17
Several empirical contributions support the hypothesis of a link between small firm growth and availability of external finance. Direct evidence is provided by Chittenden et al. (1996) who find on a large sample of small UK firms that over-reliance on internal funds and importance of
most relevant
collateral are major constraints on economic growth of small firms. In the same direction Westhead and Storey, (1997) find that lack of financial resources may be the problem faced by small and medium firms in the early-development phase. Indirect evidence shows that small firms’ sales decline relative to large firms’ sales when monetary policy is tight and bank loans are scarce (Gertler-Gilchrist, 1994). Other empirical papers find that small firms’ investment demand is financially constrained in the US Gilchrist- Himmelberg (1995), in the UK Devereux-Schiantarelli (1990) and in Italy Bagella-Becchetti and Caggese (2001).18
In this paper we do not estimate financial constraints as a result of an excess sensitivity of investment demand to cash flow. This is because, while this approach is widely acknowledged in the literature Chirinko (1993), Schiantarelli (1996) and Hubbard, (1998), it has been recently subject to criticism (Kaplan-Zingales, 2000). Therefore this is not the only way to measure financial constraints nor it is accepted by everyone.
Given these problems we prefer to use qualitative information from the Survey. In Bagella-Becchetti-Caggese (2001) this information is shown to be highly reliable by testing with success the consistency of the declaration of financial constraints (the qualitative variable used also in this paper) with: i) the traditional cash flow-investment relationship and ii) firm characteristics usually considered as related to financial constraints.
respectively, in the large and in the small firm sample. On the other hand, ownership structure per se has no significant impact on firm growth differently from what found by Harhoff, Stahl and Woywode (1998) on their German sample.
The inclusion of firms which did not survived in the sample partially changes our findings. The effect of size is now much weaker and significant only in the small firm sample (below 50 employees), age is no more significant in the all firm sample. The effect of credit rationing is much weaker and this might illustrate that banks rationally select applicants among borrowers and that optimistic entrepreneurs, when are not credit rationed, may make poorly considered investments and be more likely to fail (De Meza-Southey, 1996). Access to export markets is no more significant, while market rents are but only in the small firm sample. These findings lead to a rejection of the strong and weak version of “growth independence” also when survivorship bias is taken into account in the overall and in the small firm sample.
Results from our sample must be applied to the universe of Italian firms with some caveats. In fact we can eliminate the survivorship bias but we cannot entirely correct for the selection bias. As we already evidenced the sample includes the most qualified part of small and medium Italian firms as the proportion of limited liability firms is 90 percent against a proportion in the universe of around 40-50 percent. Furthermore, part of firms which were in the 1992-94 panel wave refuse to participate to the 1995-97 wave and bad performance is likely to be correlated with this refusal. We are then likely to overestimate the aggregate rate of growth of the universe of Italian firms and, if the refusal rate is unevenly distributed across variables which are relevant in our analysis, this may distort our results. Nonetheless these problems are common to all empirical analyses on sample data and therefore the possibility of extending the analysis of the determinants of firm growth to unexplored factors such as financing constraints remains the relevant feature of this paper.
5. Conclusions
Gibrat's law says that, with no differences ex ante in industry characteristics, size and market power across firms, all changes in size are due to chance. Empirical tests of the law have three main shortcomings: i) they only consider size and age as potential variables which may significantly affect firm growth; ii) they do not adjust their results for ex ante market rents and industry effects, iii) they test the effect of a variable at a time neglecting cross-correlation among potential explanatory variables which may make their results spurious.
The marginal contribution of this paper is in providing a test which avoids these shortcomings and in showing that, for a representative sample of small and medium sized Italian firms, the rent adjusted rate of growth is not due to chance and is not just affected by size and age. We find in fact that “growth independence” does not hold both in its weak and strong version (after correcting for market power and industry characteristics) and that finance is not neutral in the small firm and in the overall sample also when survivorship bias is taken into account. On the contrary, in the sample of firms with more than 100 employees corrected for the survivorship bias finance is neutral and both the strong and the weak version of “growth independence” hold confirming that the choice of the sample has crucial effects on the significance of the test.
Our empirical findings therefore seem to show that small surviving firms have higher than average growth potential. This potential may be limited, though, by the scarce availability of external finance and lack of access to foreign markets. These results are broadly consistent with the hypothesis that the availability of external finance and internationalisation are crucial determinants for economic development. Further empirical testing on different samples and in different countries may reveal if the bank centered financial structure of Italy has a crucial role in generating the significant effects of these factors on firm growth.
References
Allen, F., and Gale, D., 1995, A welfare comparison of intermediaries and financial markets in Germany and the US,
European Economic Review, 39 (2), pp. 179-209.
Almus, M. and Nerlinger, E.A., 1999, Testing Gibrat's Law for young firms - empirical results for West Germany, ZEW Working Paper.
Audretsch, D. B. and Mahmood, T., 1995, The Post-entry Performance of New Firms in van Witteloostuijn, A., (ed.)
Market evolution: Competition and cooperation. Studies in Industrial Organization, vol. 20. Dordrecht and Boston: Kluwer
Academic, pp. 245-55 .
Audretsch, D., Santarelli, E. and Vivarelli, 1999, Start-Up Size And Industrial Dinamics: Some Evidence From Italian Manufacturing, International Journal of Industrial Organization , 17 (7), pp 965-983.
Aw, B.Y. and A.Hwang, A., 1995, Productivity and export marker: a firm level analysis, Journal of Development Economics, 47, 209-231.
Baldwin, J. R. and Rafiquzzaman, M., 1995, Selection versus Evolutionary Adaptation: Learning and Post-entry Performance,
International Journal of Industrial Organization; 13(4), pages
501-22.
Bagella, M., Becchetti, L. and Caggese, C., 2001, Finance , Investment and Innovation : a Three Pillars Approach based on a priori identification, direct revelation an econometric estimation,
Research in Economics, 55 (2), pp. 219-254
Becchetti L., 1995, Finance, Investment and Innovation: a Theoretical and Empirical Comparative Analysis, Empirica, 22 (3), pp. 167-84.
Chittenden F., Hall G., and Hutchinson, P., 1996, Small Firm Growth, Access to Capital Markets and Financial Structure:
Review of Issues and an Empirical Investigation, Small Business
Economics, 8 (1), pp. 59-67
Clerides, S.K., Lach, S. and Tybout, J.R., 1998, Is learning-by-exporting important? Micro-dynamic evidence from Colombia, Mexico and Morocco, Quarterly Journal of Economics, 113, pp. 903-947
Devereaux, M. and Schiantarelli, F., 1989, Investment, Financial Factors, and Cash Flow: evidence from UK Panel Data, NBER
Working Paper 3116.
Dunne, P. and Hughes, A., 1994, Age, Size, Growth and Survival: UK Companies in the 1980s, Journal of Industrial Economics; 42(2), pp. 115-40.
Evans, D.S. 1987, "Tests Of Alternative Theories Of Firm Growth", Journal Of Political Economy, 95 (4), pp.657-674. Fazzari S.M., Hubbard G.R. and B.C. Petersen, 1988, Financing Constraints and Corporate Investment, Brooking Papers on
Economic Activity, 0(1), 141-195.
Gale, W.G., (1991), Economic Effects of Federal Credit Programs, American Economic Revie w, pp. 133-152.
Geroski, P. A.,1995, What Do We Know About Entry?,
International Journal of Industrial Organization; 13(4), pp.
421-40.
Gertler M. and Gilchrist M., 1994, Monetary Policy, Business Cycles, and the Behaviour of Small Manufacturing Firms,
Quarterly Journal of Economics 109 (2), pp. 309-340.
Gibrat, 1931, Les Inegalites Economique,, Paris, Librairie Du Recueil Sirey.
Gilchrist S. and Himmelberg, C.P., 1995, Evidence on the Role of Cash Flow for Investment, Journal of Monetary Economics, 36, pp. 541-572.
Hall, 1987, "The Relationship Between Firm Size And Firm Grow In The Us Manufacturing Sectors", Journal Of Industrial
Hart and Prais, 1956, The Analysis Of Business Concentration: A Statistical Approach", Journal Of The Royal Statistical Society, 119 series A, pp.150-191.
Harhoff, D., Stahl, K. and Woywode, M., 1998, Legal Form, Growth and Exit of West German Firms--Empirical Results for Manufacturing, Construction, Trade and Service Industries,
Journal of Industrial Economics; 46(4), pp. 453-88.
Huber, P.J., 1967, The behavior of maximum likelihood estimates under non standard conditions. In Proceedings of the Fifth Berkeley Symposium in Mathematical Statistics and Probability. Berkeley, Ca: University of California Press, pp. 221-233.
Jovanovic, B., 1982, "Selection And Evolution Of Industry",
Econometrica 50 (3), pp.649-70.
Kaplan, S. N. and Zingales, L., 2000, Investment-Cash flow sensitivities are not valid measures of financial constraints,
Quarterly Journal of Economics, May 2000, 115 (2), pp. 707-12.
Kashyap A.K., Lamont O.A. and Stein, J. C., 1994, Credit conditions and the cyclical behaviour of inventories, Quarterly
Journal of Economics, 109 (3), pp. 565-92.
Kumar, M. S., 1985, Growth, Acquisition Activity and Firm Size: Evidence from the United Kingdom, Journal of Industrial
Economics; 33(3) , pages 327-38.
La Porta, R.; Lopez de Silanes, F. and Shleifer, A., 1999, Corporate Ownership around the World, Journal of Finance; 54(2), 471-517.
Lotti, F., Santarelli, E. and Vivarelli, M., 1999, "Does Gibrat's Law Hold In The Case Of Young, Small Firm?", mimeo
Mansfield, R., 1962, " Entry, Gibrat's Law, Innovation, And The Growth Of Firms", American Economic Review, 52 (5), pp.1023-1051.
Mata, J., 1994, "Firm Growth During Infancy", Small Business Economics, 6 (1), pp.27-40.
McConnel, J.J., and Servaes, H., 1990, Additional evidence on equity ownership and corporate value, Journal of Financial
OECD, (1998), Financial Market trends, n. 71.
Nickell, S., 1996, Competition and Corporate Performance,
Journal of Political Economy, 104(4), pp. 724-46.
Nickell, S; Nicolitsas, D. and Dryden, N., 1997, What Makes Firms Perform Well?, European Economic Review; 41(3-5), pp. 783-96.
Saint-Paul, G., (1992), "Technological choice, financial markets and economic development", European Economic Review, 36, pp. 763-781.
Schiantarelli, F. and Georgoutsos, D., 1990, Monopolistic Competition and the Q Theory of Investment, European
Economic Review, 34, pp. 1061-1078.
Short E, 1994, Ownership, control, financial structure and the performance of firms, Journal of Economic Surveys, 8, pp. 203-249.
Schwarts, G. and Clements, B., 1999, Government Subsidies,
Journal of Economic Surveys, 13, 2, pp. 119-147.
Sutton, J., 1997, "Gibrat's Legacy", Journal Of Economic
Literature, 35 (1), pp.40-59.
Tschoegl, A. E., 1983, Size, Growth, and Transnationality among the World's Largest Banks, Journal of Business; 56(2), pp. 187-201.
Wagner, J., 1992, Firm Size, Firm Growth, and Persistence of Chance: Testing Gibrat’s Law with Establishment Data from Lower Saxony, 1978-1989, Small Business Economics; 4(2), June 1992, pp. 125-31.
Westhead, P. and Storey, D. J., 1997, Financial Constraints on the Growth of High Technology Small Firms in the United Kingdom,
Applied Financial Economics, 7 (2), pp. 197-201
White, H., 1982, Maximum likelihood estimation of misspecified models, Econometrica, 50 (1), pp. 1-25.
Zhang, G., 1998, Ownership Concentration, Risk Aversion and the Effect of Financial Structure on Investment Decisions,
Tab. 1 Descriptive features of the Mediocredito sample (1995-1997) (percent values except *)
North West
North East
Centre South. Italy
Small ( 11 - 50 empl.) 47.19 38.00 5.78 8.98 64.60
Medium ( 51 - 100 empl..)
43.02 37.35 7.41 12.06 15.30
Large ( more than 100 empl.) 34.71 50.05 7.18 8.05 20.10 High-tech sectors 4.79 4.07 3.6 9.42 4.98 Specialised Sectors 29.06 32.52 16.71 11.52 25.64 Scale sectors 29.53 24.07 25.84 30.89 27.57 Traditional sectors 36.61 39.35 53.86 48.17 41.81 Family owned 62.34 60.24 56.3 57.77 60.14 Avg. number of controlling shareholders* 1.92 2.03 1.78 1.70 1.93
Avg. share of the control group
82.14 86.79 81.75 73.25 83.06
Avg. share of the first shareholder
47.89 50.51 53.30 42.50 48.81
Avg. share of the second shareholder
15.85 16.33 10.55 12.27 15.37
Avg. share of the third shareholder
5.93 6.13 4.34 4.77 5.81
Avg. share of remaining shareholders
3.62 3.87 3.93 4.37 3.82
Part icipating in groups 25.31 26.63 20.05 26.88 24.96
Exporters 76.98 74.72 65.81 53.93 71.5
Subsidised firms 35.96 35.02 34.41 53.89 37.69
Subcontracting firms 25.34 33.04 29.86 18.50 28.08
Avg. share of controlling shareholders 94.15 149.90 136.99 90.10 118.99 Avg. Number of controlling shareholders* 1974 1969 1979 1977 1972
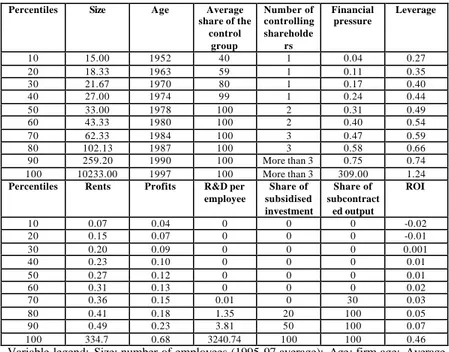
TAB. 2 Distribution of relevant quantitative variables in the sample
Percentiles Size Age Average share of the control group Number of controlling shareholde rs Financial pressure Leverage 10 15.00 1952 40 1 0.04 0.27 20 18.33 1963 59 1 0.11 0.35 30 21.67 1970 80 1 0.17 0.40 40 27.00 1974 99 1 0.24 0.44 50 33.00 1978 100 2 0.31 0.49 60 43.33 1980 100 2 0.40 0.54 70 62.33 1984 100 3 0.47 0.59 80 102.13 1987 100 3 0.58 0.66 90 259.20 1990 100 More than 3 0.75 0.74 100 10233.00 1997 100 More than 3 309.00 1.24
Percentiles Rents Profits R&D per employee Share of subsidised investment Share of subcontract ed output ROI 10 0.07 0.04 0 0 0 -0.02 20 0.15 0.07 0 0 0 -0.01 30 0.20 0.09 0 0 0 0.001 40 0.23 0.10 0 0 0 0.01 50 0.27 0.12 0 0 0 0.01 60 0.31 0.13 0 0 0 0.02 70 0.36 0.15 0.01 0 30 0.03 80 0.41 0.18 1.35 20 100 0.05 90 0.49 0.23 3.81 50 100 0.07 100 334.7 0.68 3240.74 100 100 0.46
Variable legend: Size: number of employees (1995-97 average); Age: firm age; Average share of the control group : cumulative percentage of equity held by controlling shareholders; Financial pressure: interest expenditures /(gross profits + depreciation+ interest expenditures). Leverage: the 1994 ratio of debt versus banks to total assets. Rents: (profits before tax+depreciation+interest payments-cost of capital*capital stock)/value added. Profits, Share of subsidised investment: percentage of investment expenditures covered by soft loans or grants (1995-97 average); Share of subcontracted output: percentage of output sold as subcontractor; ROI: return on investment
Tab. 3 Descriptive findings on small and medium sized firm growth (1995-1997) - surviving firms only
All firms Firms with more than 100 employees
Firms with less than 100 employees
Firms with less than 50 employees
Obs. Mean Obs. Mean Obs. Mean Obs. Mean
All firms 4403 0.04 North-West 1880 0.03 459 0.02 1421 0.03 1140 0.03 North-East 1201 0.06 243 0.05 958 0.06 770 0.06 Centre 759 0.03 103 0.01 656 0.03 571 0.03 South 563 0.06 110 0.09 453 0.05 351 0.05 Firms affiliated to a group 1082 0.04 536 0.03 519 0.04 333 0.04 Subsidised firms 1829 0.06 463 0.06 1366 0.06 1008 0.06 Subcontractors 1686 0.04 336 0.03 1351 0.04 1104 0.05 Exporters 3137 0.04 809 0.04 2328 0.05 1814 0.04 Non exporters 1266 0.04 106 0 1160 0.04 1018 0.04 Firms investing in R&D 1458 0.06 559 0.04 899 0.06 649 0.06
Credit rationed firms 153 -0.01 24 -0.08 129 0 104 -0.01
Investing in information technology 2931 0.05 772 0.05 2159 0.05 1685 0.05 Non investing in information technology 1472 0.03 143 -0.01 1329 0.03 1147 0.03 Small firms* 1333 0.07 Large firms* 1316 0.02 Old firms* 1396 0.01 446 0.02 950 0.01 704 0 Young fir ms* 1340 0.08 187 0.08 1153 0.08 995 0.08 Low leverage* 911 0.02 266 0.03 645 0.02 481 0.02 High leverage* 2258 0.05 227 0.04 2031 0.06 1808 0.05 Low financial pressure* 916 0.05 272 0.04 664 0.05 462 0.05 High financial pressure* 2260 0.04 258 0.02 2002 0.04 1775 0.04 Low rent* 762 0.02 228 0 534 0.03 379 0.02 High rent* 2614 0.05 330 0.07 2284 0.05 2008 0.05
For variable definitions see legend at table 2.
* Thresholds for the subgroups are the 30th and the 70th percentile of the relevant
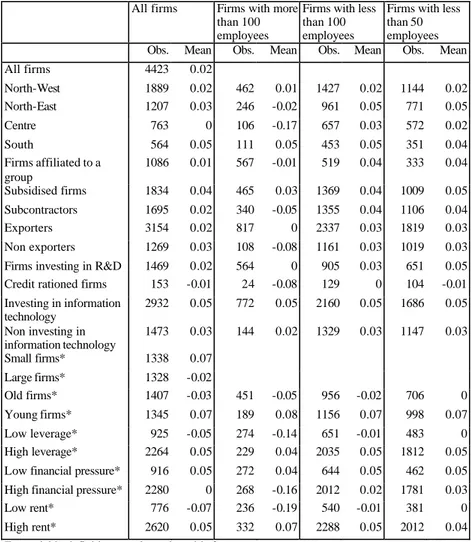
Tab. 4 Descriptive findings on small and medium sized firm growth (1995-1997)
All firms Firms with more
than 100 employees
Firms with less than 100 employees
Firms with less than 50 employees
Obs. Mean Obs. Mean Obs. Mean Obs. Mean
All firms 4423 0.02 North-West 1889 0.02 462 0.01 1427 0.02 1144 0.02 North-East 1207 0.03 246 -0.02 961 0.05 771 0.05 Centre 763 0 106 -0.17 657 0.03 572 0.02 South 564 0.05 111 0.05 453 0.05 351 0.04 Firms affiliated to a group 1086 0.01 567 -0.01 519 0.04 333 0.04 Subsidised firms 1834 0.04 465 0.03 1369 0.04 1009 0.05 Subcontractors 1695 0.02 340 -0.05 1355 0.04 1106 0.04 Exporters 3154 0.02 817 0 2337 0.03 1819 0.03 Non exporters 1269 0.03 108 -0.08 1161 0.03 1019 0.03
Firms investing in R&D 1469 0.02 564 0 905 0.03 651 0.05
Credit rationed firms 153 -0.01 24 -0.08 129 0 104 -0.01
Investing in information technology 2932 0.05 772 0.05 2160 0.05 1686 0.05 Non investing in information technology 1473 0.03 144 0.02 1329 0.03 1147 0.03 Small firms* 1338 0.07 Large firms* 1328 -0.02 Old firms* 1407 -0.03 451 -0.05 956 -0.02 706 0 Young firms* 1345 0.07 189 0.08 1156 0.07 998 0.07 Low leverage* 925 -0.05 274 -0.14 651 -0.01 483 0 High leverage* 2264 0.05 229 0.04 2035 0.05 1812 0.05
Low financial pressure* 916 0.05 272 0.04 644 0.05 462 0.05
High financial pressure* 2280 0 268 -0.16 2012 0.02 1781 0.03
Low rent* 776 -0.07 236 -0.19 540 -0.01 381 0
High rent* 2620 0.05 332 0.07 2288 0.05 2012 0.04
For variable definitions see legend at table 2.
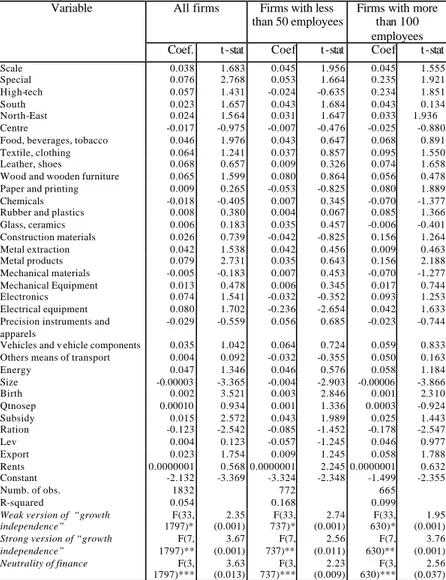
TAB. 5 The determinants of firm growth (1995-1997) - surviving firms only
All firms Firms with less than 50 employees
Firms with more than 100 employees Variable
Coef. t-stat Coef t-stat Coef t-stat
Scale 0.038 1.683 0.045 1.956 0.045 1.555 Special 0.076 2.768 0.053 1.664 0.235 1.921 High-tech 0.057 1.431 -0.024 -0.635 0.234 1.851 South 0.023 1.657 0.043 1.684 0.043 0.134 North-East 0.024 1.5 64 0.031 1.647 0.033 1.936 Centre -0.017 -0.975 -0.007 -0.476 -0.025 -0.880
Food, beverages, tobacco 0.046 1.976 0.043 0.647 0.068 0.891
Textile, clothing 0.064 1.241 0.037 0.857 0.095 1.550
Leather, shoes 0.068 0.657 0.009 0.326 0.074 1.658
Wood and wooden furniture 0.065 1.599 0.080 0.864 0.056 0.478
Paper and printing 0.009 0.265 -0.053 -0.825 0.080 1.889
Chemicals -0.018 -0.405 0.007 0.345 -0.070 -1.377
Rubber and plastics 0.008 0.380 0.004 0.067 0.085 1.366
Glass, ceramics 0.006 0.183 0.035 0.457 -0.006 -0.401 Construction materials 0.026 0.739 -0.042 -0.825 0.156 1.264 Metal extraction 0.042 1.538 0.042 0.456 0.009 0.463 Metal products 0.079 2.731 0.035 0.643 0.156 2.188 Mechanical materials -0.005 -0.183 0.007 0.453 -0.070 -1.277 Mechanical Equipment 0.013 0.478 0.006 0.345 0.017 0.744 Electronics 0.074 1.541 -0.032 -0.352 0.093 1.253 Electrical equipment 0.080 1.702 -0.236 -2.654 0.042 1.633
Precision instruments and apparels
-0.029 -0.559 0.056 0.685 -0.023 -0.744
Vehicles and v ehicle components 0.035 1.042 0.064 0.724 0.059 0.833
Others means of transport 0.004 0.092 -0.032 -0.355 0.050 0.163
Energy 0.047 1.346 0.046 0.576 0.058 1.184 Size -0.00003 -3.365 -0.004 -2.903 -0.00006 -3.866 Birth 0.002 3.521 0.003 2.846 0.001 2.3 10 Qtnosep 0.00010 0.934 0.001 1.336 0.0003 -0.924 Subsidy 0.015 2.572 0.043 1.989 0.025 1.443 Ration -0.123 -2.542 -0.085 -1.452 -0.178 -2.547 Lev 0.004 0.123 -0.057 -1.245 0.046 0.977 Export 0.023 1.754 0.009 1.245 0.058 1.788 Rents 0.0000001 0.568 0.0000001 2.245 0.0000001 0.632 Constant -2.132 -3.369 -3.324 -2.348 -1.499 -2.355 Numb. of obs. 1832 772 665 R-squared 0.054 0.168 0.099
Weak version of “growth independence” F(33, 1797)* 2.35 (0.001) F(33, 737)* 2.74 (0.001) F(33, 630)* 1.95 (0.001) Strong version of “growth
independence” F(7, 1797)** 3.67 (0.001) F(7, 737)** 2.56 (0.011) F(7, 630)** 3.76 (0.001) Neutrality of finance F(3, 1797)*** 3.63 (0.013) F(3, 737)*** 2.23 (0.009) F(3, 630)*** 2.56 (0.037)
Variable legend: GROWTH is the 1995-1997 rate of growth in the number of employees,
IND are n-1 sector dummies based on a one-digit ATECO classification (n=1,..,20), SCALE, SPECIAL, HIG-TECH are dummies for PAVITT macrosectors, SOUTH, NORTH-EAST and CENTRE are dummies for macroareas, SIZE are firm’s employees in 1994, BIRTH is the
firm’s year of establishment. QTNOSEP measures the total amount of ownership held by shareholders controlling the firm, SUBSIDY is a dummy indicating if the firm received soft loans in the 1992-94 period, RATION is a dummy indicating type I or type II credit rationing (the firm declares she asked and did not received credit (additional credit) at the prevailing rate in the considered period), LEV is the 1994 ratio of debt versus banks to total assets, EXPORT is a dummy for firms which exported in the 1992-1994 period and RENTS is a variable measuring firm market rents in 1994. Rents are calculated as (profits before tax+depreciation+interest payments-cost of capital*capital stock)/value added). * F-test of the strong version of “growth independence”. H0: all regressors coefficients with the
exception of the intercept are not significantly different from zero. ** F-test of the weak version of “growth independence”. H0: all regressors coefficients with the exception of the
intercept, market rents, industry and geographical characteristics are not significantly different from zero. *** F-test of the significance of financial variables. H0: all coefficients
of regressors measuring availability of finance (SUBSIDY, LEV and RATION) are not significantly different from zero.
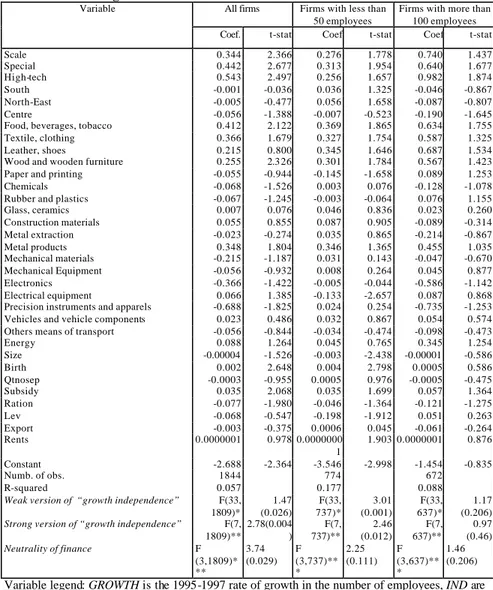
TAB. 6 The determinants of firm growth (1995-1997) - surviving and non surviving firms
All firms Firms with less than 50 employees
Firms with more than 100 employees Variable
Coef. t-stat Coef t-stat Coef t-stat
Scale 0.344 2.366 0.276 1.778 0.740 1.437 Special 0.442 2.677 0.313 1.954 0.640 1.677 High-tech 0.543 2.497 0.256 1.657 0.982 1.874 South -0.001 -0.036 0.036 1.325 -0.046 -0.867 North-East -0.005 -0.477 0.056 1.658 -0.087 -0.807 Centre -0.056 -1.388 -0.007 -0.523 -0.190 -1.645
Food, beverages, tobacco 0.412 2.122 0.369 1.865 0.634 1.755
Textile, clothing 0.366 1.679 0.327 1.754 0.587 1.325
Leather, shoes 0.215 0.800 0.345 1.646 0.687 1.534
Wood and wooden furniture 0.255 2.3 26 0.301 1.784 0.567 1.423
Paper and printing -0.055 -0.944 -0.145 -1.658 0.089 1.253
Chemicals -0.068 -1.526 0.003 0.076 -0.128 -1.078
Rubber and plastics -0.067 -1.245 -0.003 -0.064 0.076 1.155
Glass, ceramics 0.007 0.076 0.046 0.836 0.023 0.260 Construction materials 0.055 0.855 0.087 0.905 -0.089 -0.314 Metal extraction -0.023 -0.274 0.035 0.865 -0.214 -0.867 Metal products 0.348 1.804 0.346 1.365 0.455 1.035 Mechanical materials -0.215 -1.187 0.031 0.143 -0.047 -0.670 Mechanical Equipment -0.0 56 -0.932 0.008 0.264 0.045 0.877 Electronics -0.366 -1.422 -0.005 -0.044 -0.586 -1.142 Electrical equipment 0.066 1.385 -0.133 -2.657 0.087 0.868
Precision instruments and apparels -0.688 -1.825 0.024 0.254 -0.735 -1.253
Vehicles and vehicle components 0.023 0.486 0.032 0.867 0.054 0.574
Others means of transport -0.056 -0.844 -0.034 -0.474 -0.098 -0.473
Energy 0.088 1.264 0.045 0.765 0.345 1.254 Size -0.00004 -1.526 -0.003 -2.438 -0.00001 -0.586 Birth 0.002 2.648 0.004 2.798 0.0005 0.586 Qtnosep -0.0003 -0.955 0.0005 0.976 -0.0005 -0.475 Subsidy 0.035 2.068 0.035 1.699 0.057 1.364 Ration -0.077 -1.980 -0.046 -1.364 -0.121 -1.275 Lev -0.068 -0.547 -0.198 -1.912 0.051 0.263 Export -0.003 -0.375 0.0006 0.045 -0.061 -0.264 Rents 0.0000001 0.978 0.0000000 1 1.903 0.0000001 0.876 Constant -2.688 -2.364 -3.546 -2.998 -1.454 -0.835 Numb. of obs. 1844 774 672 R-squared 0.057 0.177 0.088
Weak version of “growth independence” F(33, 1809)* 1.47 (0.026) F(33, 737)* 3.01 (0.001) F(33, 637)* 1.17 (0.206) Strong version of “growth independence” F(7,
1809)** 2.78(0.004 ) F(7, 737)** 2.46 (0.012) F(7, 637)** 0.97 (0.46) Neutrality of finance F (3,1809)* ** 3.74 (0.029) F (3,737)** * 2.25 (0.111) F (3,637)** * 1.46 (0.206)
Variable legend: GROWTH is the 1995-1997 rate of growth in the number of employees, IND are
n-1 sector dummies based on a one-digit ATECO classification (n=1,..,20), SCALE, SPECIAL, HIG-TECH are dummies for PAVITT macrosectors, SOUTH, NORTH-EAST and CENTRE are
establishment. QTNOSEP measures the total amount of ownership held by shareholders controlling the firm, SUBSIDY is a dummy indicating if the firm received soft loans in the 1992-94 period,
RATION is a dummy indicating type I or type II credit rationing (the firm declares she asked and
did not received credit (additional credit) at the prevailing rate in the considered period), LEV is the 1994 ratio of debt versus banks to total assets, EXPORT is a dummy for firms which exported in the 1992-1994 period and RENTS is a variable measuring firm market rents in 1994. Rents are calculated as (profits before tax+depreciation+interest payments-cost of capital*capital stock)/value added). * F-test of the strong version of “growth independence”. H0: all regressors coefficients
with the exception of the intercept are not significantly different from zero. ** F-test of the weak version of “growth independence”. H0: all regressors coefficients with the exception of the
intercept, market rents, industry and geographical characteristics are not significantly different from zero. *** F-test of the significance of financial variables. H0: all coefficients of regressors
measuring availability of finance (SUBSIDY, LEV and RATION) are not significantly different from zero.
A1. Correlation matrix of the variables used in multivariate regressions (follows) - all sample
Scale Special High-tech South North-east Centre Food, beverage s, tobacco Scale 1.000 Special -0.372 1.000 High-tech -0.137 -0.128 1.000 South -0.006 -0.104 0.067 1.000 North-East -0.032 0.105 -0.039 -0.238 1.000 Centre -0.012 -0.068 -0.007 -0.176 -0.260 1.000 Food, beverages, tobacco -0.221 -0.206 -0.076
0.191 -0.026 -0.041 1.000 Textile, clothing -0.256 -0.239 -0.088 -0.067 -0.115 0.113 -0.142 Leather, shoes -0.116 -0.109 -0.040 -0.012 0.000 0.145 -0.065
Wood and wooden furniture
-0.155 -0.144 -0.053 -0.033 0.118
-0.023 -0.086
Paper and printing 0.402 -0.150 -0.055 -0.027 -0.009 0.085 -0.089 Chemicals 0.028 0.072 0.270 0.006 -0.039 0.002 -0.085
Rubber and plastics -0.063 0.266 0.080 0.049 -0.055 -0.013 -0.089 Glass, ceramics 0.210 -0.055 -0.034 0.002 0.103 -0.008 -0.054 Construction materials 0.181 -0.121 -0.045 0.058 -0.028 0.028 -0.072 Metal extraction 0.322 -0.120 -0.044 -0.004 -0.037 -0.049 -0.071 Metal products -0.018 -0.173 -0.064 0.010 -0.006 -0.071 -0.103 Mechanical materials -0.123 0.320 -0.018 -0.071 0.017 -0.065 -0.068 Mechanical Equipment -0.213 0.573 -0.073 -0.104 0.126 -0.033 -0.118 Electronics 0.033 -0.067 0.376 0.006 -0.005 0.012 -0.056 Electrical equipment 0.181 -0.067 -0.025 -0.046 0.038 -0.016 -0.040
Precision instruments and apparels -0.060 0.024 0.271 0.005 0.0 47 -0.028 -0.033
Vehicles and vehicle components 0.222 -0.039 -0.039 0.021 -0.040 -0.050 -0.064
Others means of transport 0.079 -0.047 0.121 0.032 -0.047 0.037 -0.034
Energy 0.086
-0.043 -0.016 -0.010 -0.013 0.058
-0.025
Others sectors not included 0.067 0.215 -0.059 -0.016 0.028 -0.057 -0.095 Size 0.101 -0.021 0.145 -0.034 -0.026 -0.046 -0.097 Birth 0.020 0.013 -0.008 0.080 0.073 0.110 -0.093 Qtnosep 0.029 -0.006 -0.005 -0.114 -0.020 -0.012 -0.095 Subsidy 0.024 0.010 0.015 0.170 -0.052 0.001 0.022 Ration -0.009 0.021 -0.016 0.099 -0.040 -0.018 0.010 Lev -0.077 0.006 -0.090 -0.154 0.065 0.066 0.065 Export -0.108 0.133 -0.016 -0.182 0.059 -0.050 -0.098 Rents 0.006 -0.033 -0.022 -0.013 0.015 0.017 0.018 Variable legend: SCALE, SPECIAL, HIG -TECH are dummies for PAVITT macrosectors, SOUTH, NORTH -EAST and CENTRE are dummies for macroareas, SIZE are firm’s employees in 1994, BIRTH is the firm’s year of establishment. QTNOSEP measures the total amount of ownership held by shareholders controlling the firm, SUBSIDY is a dummy indicating if the firm received soft loans in the 1992-94 period, RATION is a dummy indicating type I or type II credit rationing (the firm declares she asked and did not received credit (additional credit) at the prevailing rate in the considered period), LEV is the 1994 ratio of debt versus banks to total assets, EXPORT is a dummy for firms which exported in the 1992-1994 period and RENTS is a variable measuring firm market rents in 1994. Rents are calculated as (profits before tax+depreciation+interest payments-cost of capital*capital stock)/value added).
A1. Correlation matrix of the variables used in multivariate regressions - all sample (follows)
Textile, clothing Leather, shoes Wood and wooden furniture Paper and printing Chemica ls Rubber and plastics Glass, ceramics Textile, clothing 1.000 Leather, shoes -0.075 1.000 Wood and wooden
furniture
-0.099 -0.045 1.000
Paper and printing -0.103 -0.047 -0.062 1.000
Chemicals -0.098 -0.045 -0.059 -0.061
1.000
Rubber and plastics -0.103 -0.047 -0.062 -0.064 -0.061 1.000 Glass, ceramics -0.063 -0.029 -0.038 -0.039 -0.037 -0.039 1.000 Construction materials -0.083 -0.038 -0.050 -0.052 -0.050 -0.052 -0.032 Metal extraction -0.082 -0.037 -0.050 -0.052 -0.049 -0.052 -0.031 Metal products -0.119 -0.054 -0.072 -0.075 -0.071 -0.075 -0.045 Mechanical materials -0.079 -0.036 -0.048 -0.050 -0.047 -0.050 -0.030 Mechanical Equipment -0.137 -0.062 -0.083 -0.086 -0.082 -0.086 -0.052 Electronics -0.065 -0.030 -0.039 -0.041 -0.039 -0.041 -0.025 Electrical equipment -0.046 -0.021 -0.028 -0.029 -0.028 -0.029 -0.018 Precision instruments and
apparels
-0.039 -0.018 -0.023 -0.024 -0.023 -0.024 -0.015
Vehicles and vehicle components
-0.074 -0.034 -0.045 -0.046 -0.044 -0.046 -0.028
Others means of transport -0.040 -0.018 -0.024 -0.025 -0.024 -0.025 -0.015
Energy -0.029 -0.013 -0.018 -0.018 -0.018 -0.018 -0.011
Others sectors not included -0.110 -0.050 -0.067 -0.069 -0.066 -0.069 -0.042 Size -0.023 -0.025 -0.037 0.002 0.023 -0.043 0.057 Birth -0.011 0.041 0.027 -0.005 -0.011 0.074 -0.003 Qtnosep 0.028 -0.028 -0.003 0.016 0.059 -0.019 -0.022 Subsidy -0.021 -0.031 -0.077 0.030 -0.043 0.042 0.004 Ration -0.001 -0.005 -0.012 -0.015 -0.023 0.073 0.006 Lev 0.045 0.071 0.035 -0.017 -0.052 -0.035 -0.077 Export 0.054 0.043 0.017 -0.057 -0.002 0.029 0.036 Rents 0.003 0.006 0.015 0.019 0.007 -0.009 0.015
A1. Correlation matrix of the variables used in multivariate regressions - all sample (follows)
Construc tion material s Metal extractio n Metal products Mechani cal material s Mechani cal Equipme nt Electron ics Electrica l equipme nt Construction materials 1.000 Metal extraction -0.042 1.000 Metal products -0.060 -0.060 1.000 Mechanical materials -0.040 -0.040 -0.057 1.000 Mechanical Equipment -0.069 -0.069 -0.099 -0.066 1.000 Electronics -0.033 -0.033 -0.047 -0.031 -0.054 1.000 Electrical equipment -0.023 -0.023 -0.034 -0.022 -0.039 -0.018 1.000 Precision instruments and
apparels
-0.020 -0.019 -0.028 -0.019 -0.032 -0.015 -0.011
Vehicles and vehicle components -0.037 -0.037 -0.053 -0.035 -0.061 -0.029 -0.021 Others means of transport -0.020 -0.020 -0.029 -0.019 -0.033 -0.016 -0.011
Energy -0.015 -0.015 -0.021 -0.014 -0.025 -0.012 -0.008
Others sectors not included -0.0 56 -0.055 -0.080 -0.053 -0.092 -0.044 -0.031
Size -0.051 0.012 -0.052 -0.002 -0.002 0.123 0.114 Birth 0.005 0.005 0.018 -0.034 0.005 0.031 0.019 Qtnosep -0.0 43 0.037 0.064 -0.021 0.023 -0.013 0.016 Subsidy 0.027 -0.017 -0.002 0.007 0.005 0.053 -0.007 Ration 0.014 0.016 0.003 -0.037 0.031 -0.030 -0.022 Lev -0.058 0.036 -0.019 -0.007 0.035 -0.066 0.011 Export -0.235 0.001 -0.033 0.083 0.103 0.010 0.046 Rents 0.010 0.019 0.022 0.017 -0.077 0.014 0.010 Precision instrumen ts and apparels Vehicles and vehicle componen ts Others means of transport Energy Others sectors not included Size Birth
Precision instruments and apparels
1.000
Vehicles and vehicle components -0.017 1.000
Others means of transport -0.009 -0.018 1.000
Energy -0.007 -0.013 -0.007 1.000
Others sectors not included -0.026 -0.049 -0.027 -0.020 1.0 00 Size 0.040 0.076 0.157 0.005 0.021 1.000 Birth 0.006 0.017 -0.004 0.002 -0.024 -0.102 1.000 Qtnosep -0.033 0.014 0.015 0.014 -0.019 0.041 0.036 Subsidy -0.011 0.022 0.044 -0.043 -0.002 0.077 -0.010 Ration -0.018 -0.019 0.009 -0.014 -0.020 -0.020 0.029 Lev -0.006 -0.002 -0.019 -0.002 -0.032 -0.153 0.185 Export 0.009 0.028 -0.001 -0.048 0.005 0.114 -0.078 Rents -0.029 -0.061 -0.003 -0.011 0.011 -0.005 -0.018
Qtnosep Subsidy Ration Lev Export Rents
Qtnosep 1.000 Subsidy -0.035 1.000 Ration 0.031 0.004 1.000 Lev 0.010 -0.094 0.090 1.000 Export 0.036 0.025 -0.007 0.031 1.000 Rents -0.015 0.020 0.012 0.025 -0.028 1.000