Drug compliance, co-payment and health outcomes:
Evidence from a panel of Italian patients
Vincenzo Atella, Franco Peracchi, Domenico Depalo, Claudio Rossetti
CEIS Tor Vergata - Research Paper Series, Vol. 26, No. 76, December 2005
This paper can be downloaded without charge from the Social Science Research Network Electronic Paper Collection:
http://papers.ssrn.com/abstract=871395
CEIS Tor Vergata
R
ESEARCH
P
APER
S
ERIES
Drug compliance, co-payment and health outcomes:
Evidence from a panel of Italian patients
∗
Vincenzo Atella, Franco Peracchi, Domenico Depalo, Claudio Rossetti
University of Rome “Tor Vergata”
October 2005
Keywords: Health outcomes, compliance, health policy reforms, prescription charges, co-payment, natural experiments, panel data.
JEL classification codes: C35, C81, D12, I12.
Abstract
This paper studies the relationship between medical compliance and health outcomes — hospitalization and mortality rates — using a large panel of patients residing in a local health authority in Italy. These data allow us to follow individual patients through all their accesses to public health care services until they either die or leave the local health authority. We adopt a disease specific approach, concentrating on hypertensive patients treated with ACE-inhibitors. Our results show that medical compliance has a clear effect on both hospitalization and mortality rates: health outcomes clearly improve when patients become more compliant to drug therapy. At the same time, we are able to infer valuable information on the role that drug co-payment can have on compliance, and as a consequence on health outcomes, by exploiting the presence of two natural experiments during the period of analysis. Our results show that drug co-payment has a strong effect on compliance, and that this effect is immediate.
∗ Financial support from Pfizer is gratefully acknowledged. We thank Alessandro Chinellato and Giulio Nati
for many valuable comments and ideas regarding the clinical aspects of the research involved. We also thank Anne Beeson Royalty, Jay Bhattacharya, Partha Deb, Alan Garber, David Meltzer and Arthur van Soest for their com-ments, and participants to the conference The Economics of Addiction and of Health Inequality (Barcelona, May 2005), XII Conference on Panel Data, NBER Summer Institute 2005, CHILD Annual Meeting 2005, and European Economic Association Congress 2005. The usual disclaimers apply. Corresponding author: Vincenzo Atella, Faculty of Economics, University of Rome Tor Vergata, via Columbia 2, 00133 Rome, Italy, e-mail: atella@uniroma2.it, phone: +39 06 7259 5635, fax: +39 06 2020 687.
1
Introduction
The increase in the cost of health care services has produced a vast concern among policy makers, who have enforced restrictive measures to contain those trends. This phenomenon has been par-ticularly relevant for drug costs, who have recorded higher increases (in both volumes and prices) compared to other major components of healthcare spending (Jacobzone 2000). Health economists have extensively studied the effects of such restrictive policies on drug expenditure, and a large literature on this subject is available1
Unfortunately, much less is known about the effect of these cost containment measures on drug therapy compliance and, as a consequence, on health outcomes, measured through indicators of hospitalization and mortality. Not complying with medication, possibly because of affordability issues, can have serious consequences for health. Two North American studies provide evidence of a negative impact: Soumerai et al. (1994) showed increases in the use of mental health services, and Tamblyn et al. (2001) linked increased adverse events (e.g. emergency department visits or death) among low-income patients, when cost-sharing was increased. Even interrupting hyperten-sive treatment by just seven days can increase the risk of stroke (Anonymous 2000). Dracup and Meleis (1982) report evidence that 80% compliance to a medication regimen for hypertension low-ers blood pressure to normal, whereas 50% compliance is ineffective. This indicates that reducing dosage below a level that produces a therapeutic effect may have similar implications to not taking a drug at all.
When a co-payment is established, patients have to contribute in some way towards the cost of their medication and health care use. Several empirical studies have found that the demand for prescription drugs is reduced by a direct contribution from the patient but that the overall impact appears to be quite limited, with estimated price elasticity ranging from -0.1 to -0.6. Unfortunately, as pointed out by Freemantle and Bloor (1996), the key concern with drug reimbursement is that, besides reducing the use of non-essential drugs, it may also reduce the use of essential drugs. Although the reduction in “discretionary” (or non-essential) drugs has been shown to be greater than the reduction in uptake of essential prescribed medicines (McManus et al. 1996), the concern remains that essential medication may be affected.
Following this line of research, Atella et al. (2004) have investigated the role that increasing out-of-the-pocket expenditure can have on consumers’ attitudes to adopt strategies to contain the 1 Main studies on the topic include Leibowitz et al. (1985), Soumerai et al. (1987), O’Brien (1989), Harris et al.
cost of medication. Using micro-data from two surveys, conducted in Italy and the UK, they have shown a tendency for both British and Italian patients suffering from hypertension and dyspepsia to use cost reducing strategies which are strongly influenced by income and drug affordability problems. Reduction in compliance (defined as strategies that either induce patients to not obtain their medication at all, or to select fewer prescribed drugs or lower their dosage) is one of the main strategies used. More recently, Piette, Heisler and Wagner (2004) have found similar evidence in the USA, suggesting that cost remains a significant barrier to health care for many adults, especially among the uninsured and the low-income elderly population.
Further evidence has been provided by Case et al. (2004), who explore directly the relationship between income level and medical compliance for hypertensive patients through an ad hoc survey carried out in an urban township of South Africa. They find that the fraction of hypertensive patients who report to be low compliant is about 47% at the top income quintile, but it jumps to 75% at the bottom the income quintile.
Due to the cross-sectional nature of their data, both Atella et al. (2004) and Case et al. (2004) have been unable to study the link between compliance and health outcomes. The goal of this paper is to fill this gap by using a unique longitudinal data set collected for one of the 107 Italian provinces and covering the period from 1997 to 2002. It is important to mention that our analysis is disease specific, as in Atella et al. (2004) and in Case et al. (2004). In fact, by concentrating on the sub-sample of patients receiving ACE-inhibitors, we almost certainly select those suffering from hypertension (although not all hypertensive patients). We are able to obtain some evidence on the relationship between co-payment, compliance and health outcomes by exploiting the presence of two natural experiments in our time period, respectively in January 2001 and March 2002, when the Italian government first abolished and then allowed each single region to reintroduce the co-payment on all drugs provided by the National Health Service (NHS). By using a difference-in-difference approach, we detect statistically significant differences in the behavior of “high compliant” versus “low compliant” patients “before” and “after” the experiments.
The remainder of this paper is organized as follows. Section 2 describes the data. Section 3 describes our drug-specific approach. Section 4 discusses our indicator of compliance. Section 5 looks at the relationship between compliance and health outcomes. Section 6 investigates if and how health policy changes affect compliance. Finally, Section 7 offers some conclusions.
2
The data
The data comes from three administrative registries maintained by the Pharmaceutical Service Department of ULSS 9, the local health agency covering the southern part of the Italian province of Treviso. The first registry is the drug prescription database, which contains records of patient prescriptions, including date of dispensing, amount and Anatomical Terapeutical and Clinical Clas-sification (ATC) code of substance dispensed, unit price and number of packages dispensed. It also includes gender and date of birth of the patient receiving the medications, a unique anonymized patient identifier, a unique anonymized identifier of the practitioner who prescribed the medication, and gender, date of birth and typology—whether general practitioner (GP) or specialist (SP)—of the practitioner. The second is the hospitalization registry, which contains records of each single hos-pitalization, including date of entry and dismissal, primary Diagnosis Related Groups (DRG), and cost of hospitalization. Through the anonymized personal identifiers, we were able to link patient prescription and hospitalization information to the third registry, the death and transfer registry. The resulting dataset allows us to follow individual patients through all their accesses to public health care services until they either die or leave the local health authority. Data are available from 1993 for drug prescriptions and from 1997 for hospitalizations.
Relative to survey data, these administrative data have both advantages and disadvantages. An important advantage is that they do not present problems which are typical of survey data, namely unit and item non-response, measurement errors and bias effects due to interaction with interviewers. Another advantage is that they contain extremely rich information on health care services received by patients. The main disadvantage is that they contain little information on patients’ socio-economic characteristics. In particular, information on income and education is completely absent.
3
A disease-specific approach
Patients may behave differently in terms of compliance depending on the kind of pathology they suffer from or the treatment that they receive. For example, a chronic “asymptomatic” pathology (such as hypertension) leads to patterns of compliance that are different from those involved in case of acute “painful” pathologies (such as headache). Focusing on specific pathologies or on specific drug treatments offers the advantage of exploring consumer decision-making in relation to specific clinical conditions and, subsequently, it allows us to derive more precise conclusions concerning the
determinants of compliance and the role that compliance can have on health outcomes.
In this paper we focus on patients treated with a specific class of active ingredients: the ATC class C09AA, corresponding to the class of the Angiotensin Converting Enzyme inhibitors (ACE-inhibitors).2 There are two reasons for doing this. First, this class of drugs is one of the most important for the Italian NHS in terms of expenditure. In year 2003, ACE inhibitors accounted for about 9% of total public drug expenditure. Second, in the Italian practice, this class of active ingredients is employed in the treatment of hypertension. In fact, according to evidence gathered from a large database collected by Health Search,3 in 2003 about 80% of the prescriptions of ACE inhibitors (associated or not with diuretics) were issued for treating hypertension.4
Hypertension is a chronic asymptomatic pathology that affects a large share of the Italian population and tends to have long-term health implications. About 20% of the Italian adult population suffers of hypertension and its prevalence increases with age (37% at age 55—64, 50% at age 65—7 4 years, and 67% at age 75+). Because hypertension is an asymptomatic condition, patients do not generally feel ill because of high blood pressure. In this case, compliance with anti-hypertensives is often problematic (McInnes 1999).5 Hypertension treatment is generally long-term, and this may have non trivial economic implications as patients receive regular, sometimes multiple, prescriptions, thus incurring regular costs. The large prevalence also affects the public budget. Finally, hypertension is an interesting condition to study from the viewpoint of health outcomes. In fact, left untreated it can lead to serious cardiovascular diseases with potentially observable consequences in terms of mortality and hospitalization rates especially when, as in our 2 ACE-inhibitors block conversion of Angiotensin I into Angiotensin II, that is a very powerful chemical which
causes the muscles surrounding blood vessels to contract and thereby narrows the blood vessels. The narrowing of the vessels increases the pressure within the vessels and can cause high blood pressure (hypertension). Angiotensin II is formed from Angiotensin I by the “angiotensin converting enzyme” (ACE). ACE-inhibitors are medications that slow (inhibit) the activity of such enzyme, which then reduces the production of Angiotensin II. As a result, blood vessels can dilate and blood pressure is reduced. Lower blood pressure makes it easier for the heart to pump blood, thus reducing the probability of heart failure. In addition, the progression of kidney disease due to high blood pressure or diabetes is slowed.
3
Health Search is a network of Italian GPs that records information on drug prescriptions and related pathology. In 2003, the network had 320 member GPs covering 465,200 patients (for a total of 3,826,000 prescriptions).
4
This evidence is in contrast with the experience from other countries. According to OSMED (2005, p. 13), “contrary to what has emerged in the most recent studies of hypertension, especially in the ALLHAT (2002) study, the prescription of amlodipin, doxazosin, ACE inhibitors and angiotensin II inhibitors continues to increase [in Italy]. The prescriptive behavior of Italian clinics seems to be guided mostly by the European guidelines regarding the therapy for arterial hypertension, as opposed to the American behavior whose priority is to obtain a reduction in the pressure values rather than recommend a specific pharmacological choice”.
5There are several reasons for low compliance: 1) not having a prescription filled, 2) taking an incorrect dose, 3)
taking medication at the wrong time, 4) forgetting to take one or more medications, and 5) stopping medication too soon. Miller (1997) reports evidence from two large surveys showing that failure to obtain a medication is especially problematic in patients with asymptomatic conditions. The most commonly cited reason for this is the patients’ belief that they do not really need the medication.
case, it is possible to follow patients across several years.
4
Compliance
In the context of health care, drug compliance may be defined (Di Matteo 2004) as the extent to which the patient’s actual history of drug administration corresponds to the prescribed regimen. Behind this definition is the implicit assumption that medical advice is good for the patient and that rational patients should follow medical advice precisely. Thus, at the individual level, an ideal index of drug compliance would be
c∗ij = Cij Pij ,
where Cij is the amount of substance (active ingredient) j consumed by patient i in a given time period, Pij is the amount of substance j prescribed for the same period to patient i by her physician given her health characteristics, and Cij and Pij are measured in the same suitably defined unit.
Although such an indicator is in principle straightforward, both the numerator and the denom-inator are unavailable in our data. This problem is in fact more general. Regarding the numerator, drug consumption is typically hard to measure. Most datasets only contain information on drug purchased or dispensed, which is a good proxy of consumption only under the assumption that a patient consumes all the drugs purchased or dispensed. Regarding the denominator Pij, the actual drug amount prescribed to a particular patient is typically unavailable. What is generally available are only guidelines that specify the amount of active ingredients recommended for the typical or average treatment of a specific pathology. For example, guidelines for the treatment of hypertension have been published by the WHO (WHO 1999). Therefore, instead of c∗ij, we work with
cij = Dij
¯ Pj
,
where Dij is the amount of substance j dispensed to patient i in a given time period and ¯Pj is the average amount of substance j that should be prescribed to a patient for the same period according to international guidelines or national standards. Of course, patients need not be treated according to international or national standards: physicians may decide to prescribe different dosages for specific patients under specific conditions. Thus, “average dosage” or “international standards” may represent an imperfect measure in the construction of an indicator of compliance.
The relationship between the measured and the ideal index of compliance is therefore cij = c∗ij Dij Cij Pij ¯ Pj .
It is plausible to assume that Dij ≥ Cij, so cij ≥ c∗ij whenever Pij ≥ ¯Pj. The term Pij/ ¯Pj is likely to cause the most serious problems to our analysis, as it represents an important source of unobserved heterogeneity.
With regard to the choice of measurement unit, the WHO adopts the Defined Daily Dose (DDD), which represents the average maintenance dose per day for a substance used in its main indication on adults.6 Being a measurement unit, the DDD is not a recommended dose, and may not represent a real dose. Its main advantage is that the DDD of one drug is assumed to be functionally equivalent to the DDD of any other drug used for a similar purpose. As a result, DDDs can be added and compared across different products.7 In particular, it is possible to add together the DDDs of all drugs in the same broad therapeutic class or all drugs given to one or more patients. As a consequence, compliance across groups of drugs may be compared between patients, practices, health authorities, and regions. This allows us to derive compliance indicators for different active ingredients that are themselves comparable and additive. We can therefore measure the compliance of a single patient without having to distinguish between active ingredients used. For the same reason, we can account for multi-therapies.
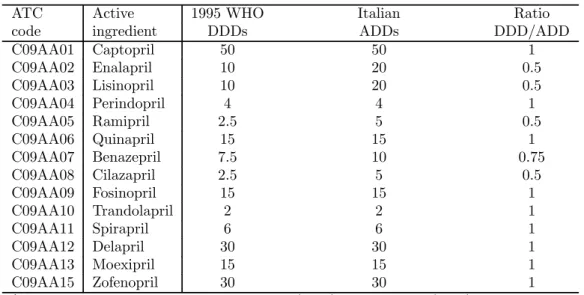
Prescription practices in individual countries can differ significantly from international stan-dards. There are at least two reasons why these differences may occur: one is the existence of different indications for the same drug,8 the other is different prescribing habits of GPs compared to international standards. As an example, Table 1 shows, for each active ingredients in the class of ACE-inhibitors, the differences between the DDDs provided by the WHO—according to the 1995 revision—and the average daily dosages according to the Italian drug prescription practice (for short, ADD). The main differences are for Enalapril, Lisinopril and Ramipril, for which the Italian ADDs are twice the WHO DDDs. Notice that these three substances represent more than half of total dispensing of ACE-inhibitors in Italy.
Taking the Italian ADDs as the measurement unit and the year as the time unit,9 our index of 6The DDD system, developed and maintained by the WHO, attempts to overcome problems with the measurement
of volumes of prescribed drugs in terms of number of items. In fact, a single item (package) can refer to any quantity or to any duration, e.g. 6 months or 1 week and, as such, it is quite an unsatisfactory measure. With the DDD system, each drug is given a value, within its recognized dosage range, that represents the assumed average maintenance dose per day for a drug used on its main indication in adults.
7 We can add up DDDs of different active ingredients prescribed and dispensed to the same individual because
our analysis is based only on plain active ingredients, thus excluding drugs with combinations of active ingredients, such as drugs composed by “diuretics” and “ACE-inhibitors”. For details on the DDD system, see the Web page of the WHO Collaborating Centre for Drug Statistics Methodology at http://www.whocc.no/atcddd.
8 For example, the DDD for quinine is based on the dose used for malaria prophylaxis (1200mg) whereas in
England its main indication is the treatment of leg cramps (300mg).
9
drug compliance for unit i is ¯ cij = PTi t=1Dijt ADDj× Ti = ¯ Dij ADDj ,
where PTit=1Dijt is total amount of doses of substance j dispensed to patient i over the Ti days for which she is observed during a year, and Dij = Ti−1
PTi
t=1Dijt is the average daily dosage of substance j dispensed to patient i during a year. Thus, our index of annual compliance is simply the ratio between the average daily purchase and the Italian average daily dose.
Since a patient may be prescribed more than one active ingredients in the class of ACE-inhibitors, compliance must be computed over all possible active ingredients dispensed during the reference period. Thus, by adding over all J active ingredients in the ACE-inhibitor class, we get our measure of annual compliance for the ith patient
¯ ci= J X j=1 Iij¯cij = PJ j=1IijD¯ij PJ j=1IijADDj ,
where Iij is equal to 1 if substance j is included in patient i’s therapy and is equal to zero otherwise. Problems arise when patients undergo therapy only for certain periods, based on physician advice. Consider for example the case of a patient with recorded prescriptions only for the first six months of the year. Should this patient be considered “fully" compliant or “half" compliant? Similarly, when the therapy is interrupted for a long period of time, we may wonder whether this reflects non-compliance by patients or perfect adherence to medical advices who suggested to stop the therapy. Unfortunately, our panel records patient information only if they interact with the system. We therefore decided to drop from our sample all those patients who present missing values for one year or more over the observation period.
An additional problem is due to the fact that, when patients are hospitalized, drugs are dis-pensed directly by the hospital pharmacy and are not recorded in the pharmaceutical registry. This would lead to underestimate compliance. We correct the doses purchased by hospitalized patients by assuming that they are treated according to the standards of the Italian practice. Specifically, we impute the doses obtained through hospitals, assuming that daily dosage is equal to the ADD. We then add imputed doses to the doses purchased through pharmacies. The importance of this correction is larger for older patients, as hospitalization rates tend to increase with age.
time unit is the month or the quarter, we observe a non-negligible fraction of patients that either make no purchase or purchase large quantities. If the time unit is the year, this problem tends to be less important.
5
Compliance and health outcomes
This section looks at the relationship between compliance and health outcomes. We first ana-lyze the determinants of compliance, and then consider how compliance and other demographic characteristics help predict health outcomes such as hospitalization and mortality rates.
5.1
Sample selection criteria
We start with all patients who were prescribed at least one drug in the ACE-inhibitor class at any time during the period 1993—2002. Because reliable data on hospitalization is only available from 1997, we focus on the 6-year period from 1997 to 2002, which result in an unbalanced panel of 43,148 patients and 170,083 observations. Given the peculiarity of the pathology under scrutiny, we restrict attention to patients born between 1910 and 1960 (2,980 patients and 10,124 observations dropped). We also drop patients with compliance greater than or equal to 2 (273 patients and 884 observations dropped), patients who were hospitalized for renal diseases but not for cardiovascular diseases (1,270 patients and 4,943 observations dropped), and patients with no drug consumption for at least one year during the period considered (17,620 patients and 80,143 observations dropped). Finally, we drop patients with missing values for at least one of the variables used (666 patients and 2,489 observations dropped). Our final sample consists of an unbalanced panel of 20,339 patients and 71,500 observations, with an average of 3.5 annual observations per patient.
We are aware that following this approach we may miss hypertensive patients who are not treated with ACE inhibitors. However, we are highly confident that we avoid selecting non-hypertensive patients. Hence, we can safely state that the patients in our final sample may be identified as hypertensive patients.
Table 2 shows the panel structure of the initial and the final sample. The fact that the number of patients in the sample increases over time is a consequence of the selection criteria used to obtain our sub-sample from the population. In fact, we select patients based on the prescription of a specific active ingredient in the ACE-inhibitors class at any time during the period 1997—2002 and, since entry into the data set, we follow the patient through all her accesses to the NHS. Thus, if a patient is first recorded receiving a prescription in 1997, we track all her accesses to the NHS for 6 years, until 2002. On the other hand, if a patient is first recorded receiving a prescription in 1998, we track her for only 5 years. This implies that the number of patients is higher in 1998 than in 1997 and, therefore, the stock of patients who received at least one prescription with ACE-inhibitor drugs increases over time.
5.2
Descriptive statistics
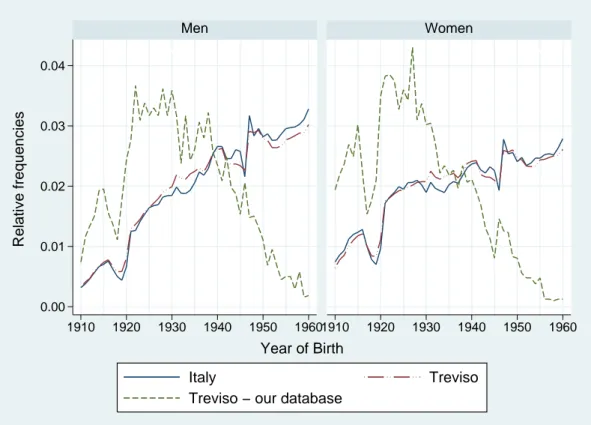
Figure 1 compares the distribution of patients by year of birth and gender in our sample with the statistics provided by the National Statistical Institute (ISTAT) for the province of Treviso and Italy as a whole. While the distribution by year of birth and gender is quite similar for Italy and the province of Treviso, people of older cohorts are over-represented in our sample due to the fact that the prevalence of hypertension increases with age.
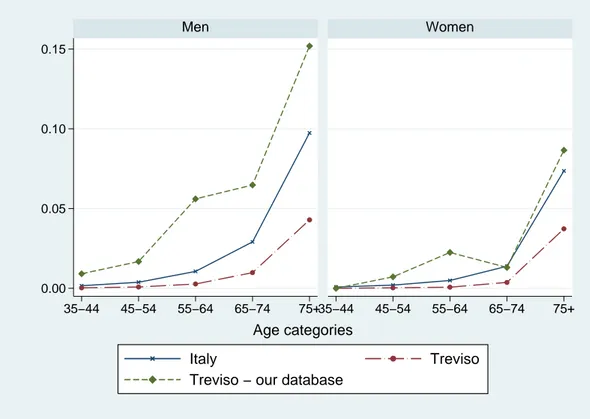
Figure 2 and 3 compare mortality rates by age and gender in our sample with mortality rates for all causes and for cardiac illness in 1999, as released by ISTAT for Italy and the province of Treviso. Mortality rates in our sample are similar to those for Italy as a whole, but are somewhat higher than those reported for the province of Treviso. Compared to mortality rates for cardiac illness, however, mortality rates in our sample are definitely higher. This is mainly due to the fact that, although our sample consists of people who at least once used drugs to treat cardiac diseases, we cannot distinguish mortality caused by such cardiac diseases from other causes.
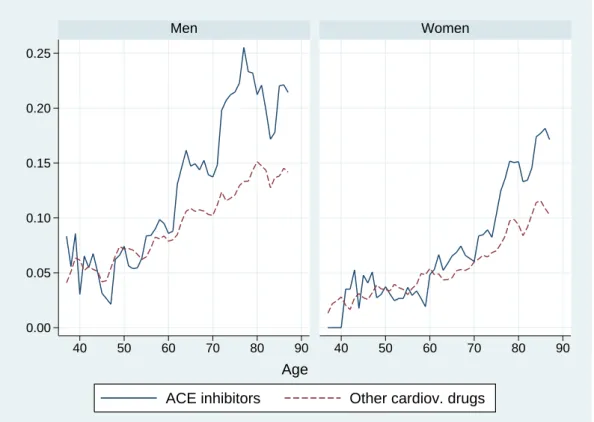
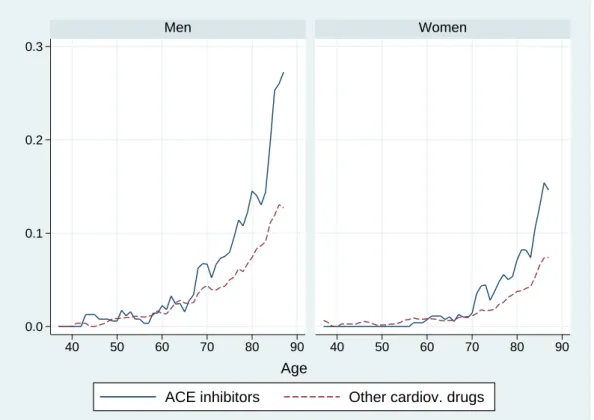
Figures 4 and 5 shows hospitalization and mortality rates by age and gender in our sample. Patients treated with ACE-inhibitors present higher hospitalization rates than those treated with other cardiovascular drugs. In either case, hospitalization rates are higher for men than for women at almost all ages. Mortality rates are very close to zero until about age 55 for men and age 60 for women. It is only after age 55 that men experience higher mortality rates than women. After age 65, patients treated with ACE inhibitors tend to have higher mortality rates than those treated with other cardiovascular drugs.
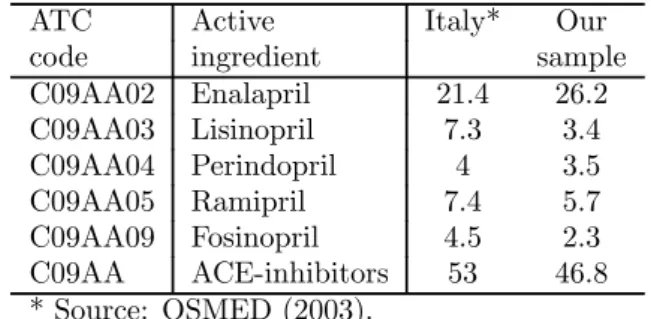
Table 3 compares average consumption of ACE-inhibitors in our sample with available national data taken from OSMED (2003). In the year 2000, average total consumption of ACE-inhibitors was 53.0 DDD per 1,000 inhabitants in Italy, while in our sample we observe a slightly lower consumption of 46.8 DDD per 1,000 inhabitants.10 Looking inside the class of ACE-inhibitors, we observe a larger use of Enalapril in our sample compared to the Italian average (26.2 vs. 21.4 DDDs).
Table 4 reports summary statistics of the variables in our sample by sex. Variables y1997-y2002 are dummy variables for the years from 1997 to 2002. The average age of male patients is about 66 years, while the average age of female patients is about 70 years. This reflects the higher life expectancy of women. The variable large pack size is a dummy variable equal to one for a large 1 0 Since the OSMED data are in terms of WHO DDDs, average consumption in our sample is also measured in
pack size (28-pill package) and equal to zero for a normal pack size (14-pill package). According to our data, about 60% of patients purchase large packages. Average age of prescribing physicians is about 48 years, and the vast majority of them are males. In fact, only 15.5% of male patients and 17.9% of female patients receive a prescription from a female GP. Both hospitalization rate and mortality rate are higher for men than for women. Average compliance of men is slightly higher than average compliance of women. Finally, patients whose prescription were written directly by a specialist, rather than a GP, are just 0.2%. This does not mean that specialists have a marginal role in Italy, but rather than it is uncommon for a specialist to write down directly a prescription. For this reason we decided to omit this variable.
Figure 6 shows the histograms of compliance by active ingredients for our sample. For all active ingredients, histograms peak at values equal to 0.25, 0.50, 0.75, and 1. Figure 7 shows the histogram of annual compliance ¯ci, aggregated over active ingredients, and confirms the peaks observed for each single active ingredient in Figure 6. Notice that the number of patients with compliance values above 1.5 is only 1 percent. Figure 8 shows that the age profile of average compliance has an inverted U shape for both men and women, with no systematic difference by gender.
As a summary of our data, we fit a linear model for the mean of our indicator of compliance, separately by gender, where the covariates include a cubic polynomial in age, a linear term in the physician’s age, and dummy variables for calendar year, pack size, and gender of the physician. The baseline category is a person aged 55, observed in 2000, consuming a small (14-pill) package, whose practitioner is a 50 years old male. Table 5 shows the estimated coefficients of this linear model, fitted separately by gender using OLS. Buying a large (28-pill) package increases a patient’s compliance and is by far the most significant predictor of compliance. Other things being equal, purchasing a large package means cutting by half the time spent meeting the practitioner to get a prescription and visiting a pharmacy to cash the prescription. The physician’s gender is significant only for women, and in this last case a female physicians is associated with lower compliance by a female patient. Older practitioners tend to reduce patient’s compliance. Finally, the coefficient on the year 2001 is large and positive, for reasons discussed in Section 6.
5.3
Modeling the probability of hospitalization and mortality
We now present the results of fitting simple parametric models for the probability of hospitalization and mortality in year t + 1 as functions of compliance in year t, controlling for demographic and other characteristics. To reduce the amount of unobserved heterogeneity in the data, we further
select the sample by dropping patients with recorded compliance below 0.2 (as they may be affected by mild hypertension, that could be treated simply by a healthy diet and by reducing stress factors) or above 1.7 (as they may suffer of specific problems and, in any case, represent less than 0.5% of the sample). This selection process produced an unbalanced panel of 14,342 patients and 50,795 observations, with an average of 3.5 annual observations per patient.
Our basic model for the probability of hospitalization is a logit model whose covariates include compliance in the past year (entering as a quadratic), an indicator for using more than one ACE-inhibitor, an indicator for patients who have also been prescribed other cardiovascular drugs (multi-therapy), a third degree polynomial in age, and a set of time dummies. Patients who received more than one active ingredient may be in worse health conditions, or present side effects or non response to ACE-inhibitors. Thus, including a dummy for multi-therapy is an attempt to control for confounding effects for which we do not have adequate information.11
Table 6 reports the estimated coefficients of the hospitalization model, fitted separately for men and women.12 The model intercept corresponds to the log-odds for the baseline case, namely a person aged 55, observed in 1998, with compliance equal to 1, taking only one kind of ACE-inhibitor and under mono-therapy. For the baseline case, women have a slightly lower probability to be hospitalized than men. Considering the effect of compliance, the coefficients are highly significant for both men and women. The negative coefficient on the linear term and the positive one on the quadratic term imply a U-shaped effect of compliance on hospitalization rates. The coefficient on the indicator for the use of more than one active ingredient in the ACE-inhibitor class and on the indicator of multi-therapy are both positive and highly significant. Notice that these dummy variables may be proxies for a patient’s poor health. Age is significant only for men, while the coefficient on the dummy for the year 2002 is negative and significant for both men and women.
Figure 9 plots the observed and predicted probabilities of hospitalization by gender and com-pliance level, along with their (asymptotic) 2-standard error bands. The predicted values in these graphs have been obtained by allowing only compliance to vary, while keeping all other variables equal to their average values. The graphs indicate a U-shaped relationship between hospitalization and compliance, with a minimum around the value of 1 (the optimal value of compliance). For both men and women, the probability of future hospitalization for cardiovascular problems falls 1 1 Instead of including an indicator for multi-therapy, we also fitted the models separately for patients under
mono-and multi-therapy obtaining very similar results.
1 2 The (asymptotic) standard errors are robust to heteroskedasticity and clustering arising from the panel structure
as current compliance moves toward its optimal value of 1. In particular, for male patients, the probability of future hospitalization falls from about 11% when current compliance is near 0.3 to 7% when current compliance is close to 1. For female patients the reduction is less pronounced, but the lowest hospitalization rate again corresponds to current compliance near 1.
We fitted a similar logit model to the probability of future mortality, including an additional dummy variable for hospitalization for cardiac illness in the current year in order to account for the different health of the patients. As before, the model was fitted separately by gender.
Table 7 reports the estimated coefficients. The intercept corresponds to the log-odds for the baseline case, namely a person aged 55, observed in 1998, with current compliance equal to 1, taking only one kind of ACE-inhibitor, under mono-therapy, and not hospitalized in the current year. The goodness of fit is low (pseudo R2 between 0.13 and 0.14), but higher than for the hospitalization model. For the baseline case, the probability of death is twice as high for men than for women. As for the hospitalization model, the estimated effect of compliance is U-shaped. The coefficient on hospitalization in the current year is large and positive, and is slightly larger for women than for men.
Figure 10 plots observed and predicted mortality rates by gender and compliance level. Focusing on male patients, we estimate that increasing current compliance from 0.3 to 1 reduces future mortality rate by half.
6
Health policy changes and compliance
The results presented in the previous section indicate that compliance helps predict future health outcomes. In this section we investigate the link between health policy changes and compliance. The existence of such link may have important implications for public policy because, if the relationship between compliance and health outcomes may be interpreted as causal, then health policy changes may affect health outcomes by changing the level of compliance.
Studies by Alan et al. (2002, 2003) and Poirier et al. (1998) have analyzed the effect of public prescription drug programs on out-of-pocket household drug expenditure in Canada. For Italy, Atella, Rosati and Rossi (2005) have shown that the drug policy reforms during the 1990s and in 2001 — although effective in controlling public expenditure — caused undesired redistributive effects, by penalizing mostly the frailest groups in the population. The main limit of all these studies is that they only evaluate the impact of policy changes on out-of-pocket expenditure, and do not assess their effects on drug compliance and therefore on health outcomes. Our paper tries to fill this gap
by exploiting the fact that our data span two major policy changes regarding drug co-payment, in 2001 and 2002. These policy changes represent two “natural experiments”, whose effects on medical compliance and health outcomes can be evaluated using a difference-in-difference (DID) specification.
6.1
The natural experiments
Our two natural experiments correspond to the abolition, on January 1, 2001, of the co-payment on drug prescriptions and its later reintroduction in March 2002. Until January 2001, patients were subject to a flat charge of about 1.5 Euros on each prescription received by their physician. This prescription charge, known as the “ticket”, applied equally to all packages, irrespective of pack size, dosage or pharmaceutical form. After its abolition in January 2001, the ticket was reintroduced in March 2002 as a flat charge of 1 Euro per prescription.
The co-payment was expected to reduce both public expenditure (financial concern) and unnec-essary consumption (clinical concern). Patients were exempt from the ticket either because of low income, or because of their old age (65 and older) or because they suffered from specific pathologies diagnosed by specialists. Although hypertension is one of those patologies, Table 8 shows, some-what surprisingly, that in fact the percentage of exempted patients is quite low even at older ages. About 90% of the adult population pays the ticket, the percentage being lower for older people. This percentage falls to zero in 2001, when the ticket was abolished. Because the co-payment was introduced again in March 2002, the data for 2002 refers only to the last three quarters.13
Being a fixed amount, the ticket has an intrinsic regressive structure affecting mostly low income patients suffering from chronic conditions. From an empirical point of view, many studies have confirmed the role of co-payment in reducing the level of drug consumption of low income patients (see among others Freemantle and Bloor 1996, Lundberg et al. 1998, and Atella et al. 2005). In this section, we present a simple framework that allows us to interpret such evidence from an economic point of view. For expositional reasons, assume that patients have to choose between drugs (all products in the ACE-inhibitor class) and all other goods. As ACE-inhibitors are provided by the Italian NHS, the price of such drugs is equal to the ticket. Therefore, a change in the ticket leads to a change in drug consumption, and therefore drug compliance, for each given level of consumption of the other goods.
Figure 11 shows the budget lines and the indifference curves over drugs and other goods for two 1 3 This picture is consistent with the data from the ISTAT 1999 Multiscopo Survey. According to this survey,
types of patients — poor (BC1) and rich (BC2). For simplicity, we assume that drug consumption cannot exceed the recommended level corresponding to full compliance (Y = 1). For positive drug prices, poor patients would reach full compliance in A3, where consumption of all other goods is equal to F0. This point, however, need not be chosen by poor patients. In fact, if the asymptomatic nature of hypertension leads them to underestimate the long-run utility of consuming an adequate level of hypertensive drugs, then the slope of the indifference curve at A3 may be greater than the slope of the budget line. In turn, this would lead poor patients to trade off drugs for higher quantities of other goods, moving down the budget line until reaching points like A2 or even A1. Atella, Rosati and Rossi (2005) and Huttin et al. (2003) present empirical evidence supporting such behavior by poor patients. On the contrary, rich patients are more likely to choose the recommended level of compliance in E. For rich patients, the trade-off between drugs and other goods is less relevant, as their income allows buying the desired level of other goods without sacrificing drug consumption.
In our first natural experiment, the price of ACE-inhibitors was lowered to zero, resulting in the new budget lines BC01 for the poor and BC02 for the rich.14 This enables poor patients to move to a higher level of compliance (from Y = 0.4 to Y = 1.0 in the figure), while rich patients do not change their compliance as they are already full compliants.
6.2
The DID specification
The simple model in the previous section suggests that, after the first policy change (abolition of the ticket), we should observe a higher increase in compliance for patients who were “low compliant” at the beginning of the period relative to those who were “high compliant”. Similarly, after the second policy change (reintroduction of the ticket), we should observe a higher decrease in compliance for patients who were “low compliant” at the beginning of the period relative to those who were “high compliant”. This would indicate a positive relationship between income and compliance.
To verify this, we divide time into three periods (period 0 corresponding to the period before the first policy change, period 1 corresponding to the period between the first and second policy change, and period 2 corresponding to the period after the second policy change) and consider the following model for the level of compliance Yit of individual i in period t
Yit= α1+ α2D1t+ α3D2t+ β1Ci+ β2D1tCi+ β3D2tCi+ Uit, t = 0, 1, 2, 1 4
If we take into account the time costs to obtain the drug prescription from the physician and to go to the pharmacy to get the drugs dispensed, the budget constraint need not be vertical even when the ticket is zero. Accounting for these costs does not change the qualitative conclusions of our analysis.
where D1tis a time dummy equal to 1 for period 1 and to 0 otherwise, D2tis a time dummy equal to 1 for period 2 and to 0 otherwise, Ci is equal to 1 for patients with initial compliance above a certain threshold, and Uit is a regression error with the usual properties. According to this model, average compliance of high compliants is equal to μH0 = α1+β1in period 0, to μ1H = α1+α2+β1+β2 in period 1 and to μH2 = α1 + α3+ β1 + β3 in period 2, whereas average compliance of the low compliants is equal to μL0 = α1 in period 0, to μL1 = α1 + α2 in period 1 and to μL2 = α1+ α3 in period 2. Thus, the average change in compliance after the first policy change is equal to ∆μH01 = μH1 − μH0 = α2+ β2 for the high compliants and to ∆μL01 = μH1 − μH0 = α2 for the low compliants, whereas the average change in compliance after the second policy change is equal to ∆μH12 = μH2 − μH1 = α3− α2+ β3− β2 for the high compliants and to ∆μL12 = μL2 − μL1 = α3− α2 for the low compliants. Finally, β2 = ∆μH01− ∆μL01is the DID parameter for the first policy change (the difference in the average change in compliance between high compliants and low compliants from period 0 to period 1), whereas β3− β2 = ∆μH12− ∆μL12 is the DID parameter for the second policy change (the difference in the average change in compliance between high compliants and low compliants from period 1 to period 2).
The model was estimated by OLS, after dropping patients who entered the panel after January 2001 or left the panel before March 2002. To check the robustness of our results, we considered four modification of the basic model. The first considers two different subsamples, respectively covering the periods 2000—2002 and 1997—2002. The second adds a vector of demographic variables. The third adds a set of individual specific effects and using the fixed-effect (within-group) estimator. The fourth uses different thresholds to classify patients as high compliant.
After fitting the models separately by gender, we found no significant difference in the estimated coefficients. Thus, we simply report the results for the specification that only includes a dummy variable for gender. Table 9 shows, for both sub-samples, the OLS estimates of the model, with patients classified as high compliant if their initial indicator of compliance is greater than or equal to 0.55. All parameters are statistically significant. In particular, both DID parameters are negative and highly statistically significant, but the second is smaller than the first. The negative estimate of β2 means that, after the first policy change, low compliants increased average compliance more than high compliants. On the other hand, the negative estimate of β3− β2 means, after the second policy change, high compliants decreased average compliance more than “low compliants”. This finding is likely to reflect the fact that in September 2001 the maximum number of packages allowed in a single prescription was lowered from 6 to 3, thereby increasing transaction costs. This affected
mainly high compliants, whose average number of packages per prescription was higher than 3 before September 2001 (it was lower than 3 for low compliants).
As shown in Table 10, these results are robust to alternative specifications and estimation procedures. As a further robustness check, we re-estimated the model using different thresholds to classify patients as high compliant. Figure 12 presents the estimated DID parameter for the first policy change under different values of the threshold. The DID estimates are fairly stable at around -24% for thresholds ranging from 0.5 to 0.75. At about 0.80, we observe a noticeable increase of the estimates (in absolute terms). From 0.90 to 1.15, the negative slope becomes even steeper. Our finding that the DID parameter is higher (in absolute terms) the higher the threshold is a simple consequence of the fact that patients who initially are high compliants have little room to further increase their level of compliance after the abolition of the ticket.
Overall, our results provide strong support for the argument that changes in compliance asso-ciated with changes in the prescription charges tend to be greater for low compliant patients than for high compliant patients.
6.3
Speed of adjustment to policy changes
How responsive are changes in compliance to changes in the co-payment structure? To answer this question, we re-parameterize the model in Section 6.2 to capture changes in compliance over time. We estimate the resulting model at quarterly rather than annual frequency.15 Interacting all coefficients with quarterly dummies, we are able to estimate average quarterly compliance for both high compliants and low compliants. Figure 13 reports these estimates.
It is clearly seen that both natural experiments had an effect on compliance. Further, this effect was almost immediate. In particular, the abolition of the ticket in January 2001 increased the average compliance of “low compliant” patients, the new equilibrium being reached within one quarter. The reintroduction of the ticket fifteen months later reduced the equilibrium level again within one quarter. However, this time the average level of compliance was higher than before January 2001. This result provides further support to our simple theoretical model. In fact, we must remember that the new co-payment was set to a level that was lower than the one existing prior to January 2001. This implies that all potentially “low compliant” patients faced a less stringent constraint than before January 2001, allowing them to have higher levels of compliance than before.
1 5
6.4
Policy changes and health outcomes
The empirical analysis carried out in the previous sections shows clear evidence of causality running from co-payment to compliance and from compliance to health outcomes. In order to provide a quantitative measure of the effect on health outcomes of changes in co-payment, we use a two-step procedure.
In the first step, we use the model estimated in Section 6.2 to predict compliance for both high compliants and low compliants under three policies—Policy 0 (pre 2001), Policy 1 (abolition of the ticket) and Policy 2 (reintroduction of the ticket)—all else being constant. In the second step, we used the predicted values of compliance to feed the hospitalization and mortality models. More precisely, for each policy, predicted compliance for the ith patient refers to year t = 2000 and is computed as μ(Xit) = E(¯cit| Xit), where ¯cit is annual compliance at time t, Xit is a vector of patient’s characteristics and the expected value is estimated using the model in Section 6.2. Predicted hospitalization and mortality rates for the ith patient are then computed, respectively, as E(Hi,t+1| ¯cit = μ(Xit), Xit) and E(Mi,t+1| ¯cit = μ(Xit), Hit, Xit) where Hi,t+1 is the binary indicator of hospitalization at time t + 1, Mi,t+1 is the binary indicator of mortality at time t + 1 and the expected values are estimated using the logit models in Section 5.3.
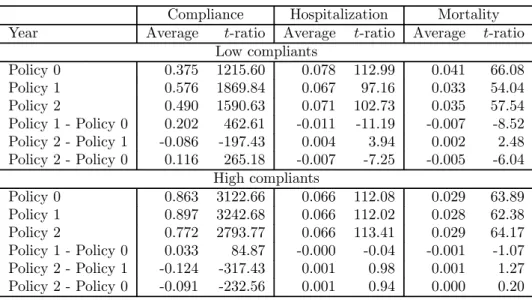
The average values of predicted outcomes (compliance, hospitalization and mortality), averaged over all units in our sample, are reported in Table 11 for each of the three policies. Notice that, for low compliants, Policy 1 implies a drop of 1 percentage point (from 8.1% to 7.1%) in the hospitalization rate and a drop of 0.7 percentage points (from 4.3% to 3.6%) in the mortality rate, relative to Policy 0. On the other hand, for high compliants, the differences between the two policies are not statistically significant. The opposite is true for Policy 2 relative to Policy 1. Overall, the predicted differences in health outcomes between Policy 2 and Policy 0 are negative and statistically significant for low compliants but not for high compliants. These effects are more clearly shown in Figure 14.
7
Conclusions
The main conclusion of this study is that compliance to anti-hypertensive drug treatment mat-ters for health outcomes. According to our results, the probability of future hospitalization for cardiovascular problems and mortality falls by about half as current compliance moves toward its optimal value of 1. This is partly in line with the results of Dracup and Meleis (1982) who find evidence that high compliance to a medication regimen for hypertension lowers blood pressure to
normal, whereas compliance below 50% is ineffective, up to a point where a low dosage produces a therapeutic effect similar to not taking a drug at all.
In particular, the probability of future hospitalization for male patients falls from about 11% when current compliance is near 0.3 to 7% when current compliance is close to 1. For female patients the reduction is less pronounced, but the lowest hospitalization rate is still observed when current compliance is near 1. Similar conclusions hold for mortality. Focusing on male patients, we estimate that increasing current compliance from 0.3 to 1 reduces future mortality rate by half. These results are robust to different econometric specifications and to sample selection.
Further, changes in the co-payment structure appear to have a strong effect on the average level of compliance of previously low compliant patients, while leaving almost unchanged the average level of compliance of previously high compliant patients. Reducing co-payments, therefore, leads to a larger fraction of patients being treated. The speed of adjustment appears to be extremely rapid. This is consistent with the view (and practice) that policy makers should operate through changes in co-payment schemes whenever they want to achieve rapid effects on demand. Finally, the average level of compliance of previously low compliant patients after the reintroduction of a reduced co-payment is higher than before the abolition of the ticket. This is consistent with the prediction of our theoretical model.
Our results have important policy implications. First, although the Italian NHS spends a large amount of money on drugs, the low level of compliance observed for a substantial fraction of patients may generate negligible returns in terms of improved health outcomes. This result would suggest a reconsideration of the relationship between GPs and patients, with GPs caring more about the compliance profile of their patients, possibly through a larger use of information technologies.
Second, in order to provide a better therapeutic coverage for all patients, drug consumption and, therefore, drug expenditure should increase. Of course, one needs to assess whether this is compatible with financial sustainability of the NHS.
Third, as long as co-payment affects drug consumption, it will consequently affect drug compli-ance and therefore health outcomes. Our calculations show that, all else being constant, abolishing the prescription charge affects health outcomes for low compliants in our sample by reducing the hospitalization rate by 1 percentage point (from 8.1% to 7.1%) and the mortality rate by 0.7 per-centage points (from 4.3% to 3.6%). This implies that the expected additional drug expenditure could be at least partly offset by the cost reduction associated with lower hospitalization and mortality rates.
References
Anonymous (2000), Antihypertensive compliance and stroke risk. The Pharmaceutical Journal 265: 642. Atella V. (1999), Drug cost containment policies in Italy: are they really effective in the long-run? The
case of minimum reference price. Health Policy, 50: 197—218.
Atella V. (2003), Physicians’ prescription behavior and cost to the patients in Italy: first evidence based on focus group techniques and prescription data. In Huttin C. (ed.), Patient Charges and Decision-Making Behaviors of Consumers and Physicians, Amsterdam: IOS Press.
Atella V., Rosati F.C., Rossi M.C. (2005), Precautionary saving and health risk. Evidence from the Italian households using a time series of cross sections. Rivista di Politica Economica, forthcoming.
Atella V., Schafheutle E.I., Noyce P.R., Hassell K. (2005), Affordability of medicines and patientsŠ cost reduction behaviors: empirical evidence based on SUR estimates from Italy and the United Kingdom. Applied Health Economics and Health Policy, 4: 23—35.
Case A., Le Roux I., Menendez A. (2004), Medical compliance and income-health gradients. American Economic Association — Papers and Proceedings, 94: 331—335.
Di Matteo R.M. (2004), Variations in patients’ adherence to medical recommendations. A quantitative review of 50 years of research. Medical Care, 42: 200—209.
Dracup K.A., Meleis A.I. (1982), Compliance: an interactionist approach. Nursing Research, 31: 31—36. Freemantle N., Bloor K. (1996), Lessons from international experience in controlling pharmaceutical
ex-penditure. I: influencing patients. British Medical Journal, 312: 1469—1471.
Harris B.L., Stergachis A., Ried L.D. (1990), The effect of drug co-payments on utilization and cost of pharmaceuticals in a health maintenance organization. Medical Care, 28: 907—917.
Hassell K., Atella V., Schafheutle E.I., Noyce P.R. (2003), Cost to the patient or cost to the healthcare system? Which one matters the most for GP prescribing decisions? A UK-Italy comparison. European Journal of Public Health, 13: 18—23.
Hughes D., McGuire A. (1995), Patient charges and the utilization of NHS prescription medicines: some estimates using a co-integration procedure. Health Economics, 4: 213—220.
Huttin C. (1994), The use of prescription charges. Health Policy, 27: 53-73.
Huttin C., Atella V., Brenner G., Hedvall M.B., Mechtler R., Noyce P., Schafheutle E. (2003), Patient survey: International hypertension results. In C. Huttin (ed.), Patient Charges and Decision-Making Behaviors of Consumers and Physicians, IOS Press.
Jacobzone S. (2000), Pharmaceutical policies in OECD countries: Reconciling social and industrial goals. OECD Labour Market and Social Policy - Occasional Paper n. 40.
Jones R., Lydeard S. (1989), Prevalence of symptoms of dyspepsia in the community. British Medical Journal, 298: 30—32.
Leibowitz A., Manning W., Newhouse J. (1985), The demand for prescription drugs as a function of cost sharing. Social Science and Medicine, 21: 1063—1069.
Lundberg L., Johannesson M., Isacson D.G.L., Borgquist L. (1998), Effects of user charges on the use of prescription medicines in different socio-economic groups. Health Policy, 44: 123—134.
McInnes G.T. (1999) Integrated approaches to management of hypertension: promoting treatment accep-tance. American Heart Journal, 138: S252—S255.
Miller N.H. (1997), Compliance with treatment regimens in chronic asymptomatic diseases. American Medical Journal, 102(2A): 43-49.
O’Brien B. (1989), The effects of patient charges on the utilization of prescription medicines. Journal of Health Economics, 8: 109—131.
OSMED (2003), L’uso dei Farmaci in Italia. Roma, Ministero della Salute.
Piette J., Heisler M., Wagner T.H. (2004), Cost-related medication underuse: Do patients with chronic illnesses tell their doctors?. Archives of Internal Medicine, 164: 1749—1755.
Poirier S., LeLorier J., Pagé V., Lacour A. (1998), The effect of a $2 co-payment on prescription refill rates of Quebec elderly and its relationship to socio-economic status. Canadian Pharmaceutical Journal, 131: 30—34.
Ryan M., Birch S. (1991), Charging for health care: Evidence on the utilization of NHS prescribed medicines. Social Science and Medicine, 33: 681—687.
Soumerai S.B., Avorn J., Ross-Degnan D., Gortmaker S. (1987), Payment restrictions for drugs under Medicaid: Effects on therapy, cost and equity. New England Journal of Medicine, 317: 550-556. Soumerai S.B., McLaughlin T.J., Ross-Degnan D., Casteris C.S., Bollini P. (1994), Effect of limiting
Med-icaid drug-reimbursement benefits on the use of psychotropic agents and acute mental health services by patients with schizophrenia. New England Journal of Medicine, 331: 650—655.
Stuart B., Grana J. (1998), Ability to pay and the decision to medicate. Medical Care, 36: 202-211. Tamblyn R., Hanley J.A., Abrahamowicz M., Scott S., Mayo N., Hurley J., Grad R., Latimer E., Perreault
R., et al. (2001), Adverse events associated with prescription drug cost-sharing among poor and elderly persons. Journal of the American Medical Association, 285: 421—429.
Vermeire E., Hearnshaw H., Van Royen P., Denekens J. (2001), Patient adherence to treatment: three decades of research. A comprehensive review. Journal of Clinical Pharmacy and Therapeutics, 26: 331—342.
Table 1: WHO DDs and Italian ADDs by substance.
ATC Active 1995 WHO Italian Ratio
code ingredient DDDs ADDs DDD/ADD
C09AA01 Captopril 50 50 1 C09AA02 Enalapril 10 20 0.5 C09AA03 Lisinopril 10 20 0.5 C09AA04 Perindopril 4 4 1 C09AA05 Ramipril 2.5 5 0.5 C09AA06 Quinapril 15 15 1 C09AA07 Benazepril 7.5 10 0.75 C09AA08 Cilazapril 2.5 5 0.5 C09AA09 Fosinopril 15 15 1 C09AA10 Trandolapril 2 2 1 C09AA11 Spirapril 6 6 1 C09AA12 Delapril 30 30 1 C09AA13 Moexipril 15 15 1 C09AA15 Zofenopril 30 30 1
* Source: Our calculations based on WHO (1999) and OSMED (2000).
Table 2: Panel structure of the initial and the final sample.
Year 1997 1998 1999 2000 2001 2002 Total Initial sample 1997 17,652 17,142 16,390 15,654 14,978 14,366 96,182 1998 0 5,323 5,156 4,913 4,726 4,525 24,643 1999 0 0 5,403 5,263 5,057 4,851 20,574 2000 0 0 0 4,728 4,593 4,396 13,717 2001 0 0 0 0 5,027 4,925 9,952 2002 0 0 0 0 0 6,015 5,015 Total 17,652 22,465 26,949 30,558 34,381 38,078 170,083 Final sample 1997 7,491 7,126 6,832 6,604 6,406 6,211 40,670 1998 0 1,715 1,592 1,515 1,460 1,415 7,697 1999 0 0 2,001 1,884 1,810 1,756 7,451 2000 0 0 0 2,040 1,947 1,875 5,862 2001 0 0 0 0 2,807 2,728 5,535 2002 0 0 0 0 0 4,285 4,285 Total 7,491 8,841 10,425 12,043 14,430 18,270 71,500
Table 3: DDDs per 1000 inhabitants in year 2000.
ATC Active Italy* Our
code ingredient sample
C09AA02 Enalapril 21.4 26.2 C09AA03 Lisinopril 7.3 3.4 C09AA04 Perindopril 4 3.5 C09AA05 Ramipril 7.4 5.7 C09AA09 Fosinopril 4.5 2.3 C09AA ACE-inhibitors 53 46.8 * Source: OSMED (2003).
Table 4: Descriptive statistics. Final sample: Patients born 1910—1960 filling ACE-inhibitor pre-scriptions (20,339 patients and 71,500 observations).
Men Women
Mean St. Dev. Mean St. Dev.
Year 1997 0.106 0.308 0.104 0.305 Year 1998 0.124 0.329 0.124 0.329 Year 1999 0.147 0.354 0.145 0.352 Year 2000 0.169 0.375 0.168 0.374 Year 2001 0.202 0.401 0.202 0.401 Year 2002 0.253 0.435 0.258 0.438 Age 66.2 11.2 69.9 11.4 Year of birth 1933 11 1930 11
Large pack size 0.612 0.487 0.590 0.492
Female GP 0.155 0.362 0.179 0.384
Year of birth of GP 1951 7 1951 7
Age of GP 48.5 6.9 48.2 6.8
Specialist 0.002 0.049 0.002 0.043
More than 1 ACE-inhibitor 0.042 0.200 0.034 0.180 More than 1 card. drug 0.633 0.482 0.597 0.491 Hospital. rate for cardiov. DRG 0.123 0.329 0.083 0.276 Mortality rate 0.042 0.200 0.028 0.165
Table 5: Estimated coefficients of the linear model for annual compliance (∗ significant at 10%; ∗∗ significant at 5%; ∗ ∗ ∗ significant at 1%). Men Women Age -0.035 * 0.015 Age2/100 0.078 *** -0.001 Age3/10000 -0.051 *** -0.010 Year 1997 0.015 ** 0.014 ** Year 1998 0.001 -0.008 * Year 1999 -0.007 * -0.010 ** Year 2001 0.030 *** 0.023 *** Year 2002 0.018 *** -0.005 Large pack size 0.125 *** 0.099 *** Female pract. 0.002 -0.017 ** Age pract. -0.001 -0.001 ** Constant 0.555 *** 0.556 *** No. obs. 34,639 36,861 R2 .0441 .0337 RMSE .345 .336
Table 6: Estimated coefficients of the logit model for hospitalization (∗ significant at 10%; ∗∗ significant at 5%; ∗ ∗ ∗ significant at 1%).
Men Women
Compliance -1.937 *** -1.492 *** Compliance2 1.124 *** 0.815 ***
More than 1 ACE-inhibitor 0.704 *** 0.562 *** Multi-therapy 1.081 *** 1.061 *** Age -0.611 ** -0.436 Age2/100 1.060 *** 0.702 Age3/10000 -0.558 *** -0.335 Year 1999 -0.217 ** -0.012 Year 2000 -0.235 *** -0.036 Year 2001 -0.290 *** -0.065 Year 2002 -0.374 *** -0.326 *** Constant -3.766 *** -4.377 *** No. obs. 17,784 18,669 Pseudo R2 .0716 .0678
Table 7: Estimated coefficients of the logit model for mortality (∗ significant at 10%; ∗∗ significant at 5%; ∗ ∗ ∗ significant at 1%).
Men Women
Compliance -1.170 ** -1.971 *** Compliance2 0.605 * 1.015 ** More than 1 ACE-inhibitor 0.528 *** 0.370 * Multi-therapy 0.566 *** 0.642 *** Hospitalized at t − 1 0.695 *** 0.711 *** Age -0.366 -0.087 Age2/100 0.602 0.124 Age3/10000 -0.259 0.006 Year 1999 -0.351 *** -0.051 Year 2000 -0.450 *** -0.394 ** Year 2001 -0.459 *** -0.601 *** Year 2002 -0.646 *** -0.788 *** Constant -4.806 *** -5.786 *** No. obs. 17,784 18,669 Pseudo R2 .129 .144
Table 8: Percentage of patients paying prescription charges by age group and year.
Age group 1997 1998 1999 2000 2001 2002 41—50 0.98 0.97 0.95 0.96 0 0.98 51—60 0.96 0.95 0.95 0.95 0 0.97 61—70 0.95 0.94 0.92 0.92 0 0.95 71—80 0.90 0.90 0.88 0.88 0 0.90 81—90 0.82 0.82 0.80 0.78 0 0.81 Total 0.92 0.91 0.90 0.90 0 0.93
Table 9: Estimated OLS coefficients. Comparison across subsamples.
2000—2002 1997—2002 Coeff. t-ratio Coeff. t-ratio α1= μL0 0.326 167.6 0.375 140.8 α2= ∆μL01 0.235 58.6 0.200 49.5 α3= ∆μL02 0.142 34.0 0.112 26.3 β1= μH0 − μL0 0.559 167.5 0.489 115.3 β2= ∆μH01− ∆μL01 -0.226 -39.9 -0.168 -28.8 β3= ∆μH02− ∆μL02 -0.254 -40.8 -0.206 -32.2 β3− β2= ∆μH12− ∆μL12 -0.028 -4.4 -0.038 -5.9
Table 10: Estimated DID parameters for the first policy change (β2) and the second policy change (β3− β2). Comparison across models. Subsample 2000—2002.
β2 β3− β2
Coeff. t-ratio Coeff. t-ratio OLS without demographic var’s -0.226 -39.90 -0.028 -4.37 OLS with demographic var’s -0.226 -39.89 -0.028 -4.37 FE without demographic var’s -0.226 -36.80 -0.028 -4.54
Table 11: Predicted compliance, hospitalization and mortality under alternative policies.
Compliance Hospitalization Mortality Year Average t-ratio Average t-ratio Average t-ratio
Low compliants Policy 0 0.375 1215.60 0.078 112.99 0.041 66.08 Policy 1 0.576 1869.84 0.067 97.16 0.033 54.04 Policy 2 0.490 1590.63 0.071 102.73 0.035 57.54 Policy 1 - Policy 0 0.202 462.61 -0.011 -11.19 -0.007 -8.52 Policy 2 - Policy 1 -0.086 -197.43 0.004 3.94 0.002 2.48 Policy 2 - Policy 0 0.116 265.18 -0.007 -7.25 -0.005 -6.04 High compliants Policy 0 0.863 3122.66 0.066 112.08 0.029 63.89 Policy 1 0.897 3242.68 0.066 112.02 0.028 62.38 Policy 2 0.772 2793.77 0.066 113.41 0.029 64.17 Policy 1 - Policy 0 0.033 84.87 -0.000 -0.04 -0.001 -1.07 Policy 2 - Policy 1 -0.124 -317.43 0.001 0.98 0.001 1.27 Policy 2 - Policy 0 -0.091 -232.56 0.001 0.94 0.000 0.20
Figure 1: Distribution by year of birth and gender. 0.00 0.01 0.02 0.03 0.04 1910 1920 1930 1940 1950 19601910 1920 1930 1940 1950 1960 Men Women Italy Treviso
Treviso − our database
Relative frequencies
Figure 2: Mortality rates in our sample and mortality rate for all causes in Italy and the Treviso province in year 1999. 0.00 0.05 0.10 0.15 35−44 45−54 55−64 65−74 75+35−44 45−54 55−64 65−74 75+ Men Women Italy Treviso
Treviso − our database Age categories
Figure 3: Mortality rates in our sample and mortality rates for cardiac illness in Italy and the Treviso province in year 1999.
0.00 0.05 0.10 0.15 35−44 45−54 55−64 65−74 75+35−44 45−54 55−64 65−74 75+ Men Women Italy Treviso
Treviso − our database Age categories
Figure 4: Hospitalization rates by age and gender. 0.00 0.05 0.10 0.15 0.20 0.25 40 50 60 70 80 90 40 50 60 70 80 90 Men Women
ACE inhibitors Other cardiov. drugs Age
Figure 5: Mortality rates by age and gender. 0.0 0.1 0.2 0.3 40 50 60 70 80 90 40 50 60 70 80 90 Men Women
ACE inhibitors Other cardiov. drugs Age
Figure 6: Histograms of compliance by active ingredient (in terms of ADDs). 0 5 10 0 5 10 0 5 10 0 5 10 0 .5 1 1.5 2 0 .5 1 1.5 2 0 .5 1 1.5 2 0 .5 1 1.5 2
Benazepril Captopril Cilazapril Delapril
Enalapril Fosinopril Lisinopril Moexipril
Perindopril Quinapril Ramipril Spirapril
Trandolapril Zofenopril
Density
Figure 7: Histogram of annual compliance. 0 1 2 3 Density 0 .25 .5 .75 1 1.25 1.5 1.75 2 Compliance
Figure 8: Age profile of average annual compliance by gender. 0.40 0.50 0.60 0.70 0.80 40 50 60 70 80 90 Age Men Women
Figure 9: Observed and fitted hospitalization rates by gender and compliance level. 0.00 0.01 0.02 0.03 0.04 0.05 0.06 0.07 0.08 0.09 0.10 0.11 0.12 0.13 0.14 .3 .4 .5 .6 .7 .8 .9 1 1.1 1.2 1.3 1.4 .3 .4 .5 .6 .7 .8 .9 1 1.1 1.2 1.3 1.4 Men Women Fitted Observed Compliance
Figure 10: Observed and fitted mortality rates by gender and compliance level. 0.00 0.01 0.02 0.03 0.04 0.05 0.06 0.07 0.08 0.09 0.10 0.11 0.12 0.13 0.14 .3 .4 .5 .6 .7 .8 .9 1 1.1 1.2 1.3 1.4 .3 .4 .5 .6 .7 .8 .9 1 1.1 1.2 1.3 1.4 Men Women Fitted Observed Compliance
Figure 11: The effect of co-payment abolition on utility maximization for “high compliant” and “low compliant” patients.
Figure 12: Estimated DID coefficient for the first policy change under different values for the threshold used to distinguish between “low” and “high” compliance.
−0.45 −0.40 −0.35 −0.30 −0.25 −0.20 DID coefficient 0 .1 .2 .3 .4 .5 .6 .7 .8 .9 1 1.1 1.2 Threshold
Figure 13: Average quarterly compliance for high compliants and low compliants. 0.0 0.1 0.2 0.3 0.4 0.5 0.6 0.7 0.8 0.9 1.0 2000q1 2000q2 2000q3 2000q4 2001q1 2001q2 2001q3 2001q4 2002q1 2002q2 2002q3 2002q4
Figure 14: Predicted hospitalization and mortality rates based on compliance in t − 1 for high and low compliants. 0.050 0.055 0.060 0.065 0.070 0.075 0.080 0.085 0.090
Base Policy 1 Policy 2
Low High Low High Low High
Hospitalization 0.025 0.030 0.035 0.040 0.045
Base Policy 1 Policy 2
Low High Low High Low High