Department of
Business and Management
Chair of
Advanced Corporate Finance
Acquirer’s Returns in Mergers & Acquisitions in
European Telecommunications Industry
SUPERVISOR
Prof. Raffaele Oriani
CANDIDATE
Gilberto Bosco
675391
CO-SUPERVISOR
Prof. Federico Merola
i
Acknowledgements
First of all, I would like to express my very true appreciation to my family, in particular my father Giacinto, my mother Umberta and my grandmother Nella, for their continuous support during my studies, encouraging me at every time and giving the possibility to follow this rewarding path.
I also want to sincerely thank Arianna, for her constant love and support which kept me motivated every day, and my friends in Italy and in London, who helped me to get through my studies and with whom I have unforgettable memories.
Finally, I want to express my true gratitude to Professor Nitzsche and Professor Oriani for their support and precious advices, fundamental in the research and writing of this dissertation.
Table of Contents
Table of Contents --- ii
List of Tables and Figures --- iii
1. Introduction. --- 1
2. Literature Review. --- 4
2.1 Mergers & Acquisitions waves --- 4
2.2 Motives for M&As. --- 6
2.3 Shareholder’s returns in M&A. --- 6
2.4 Factors influencing returns. --- 8
2.5 Focus on European studies. --- 9
3. Telecommunications Industry Overview. --- 12
3.1 Telecommunications Industry general trend. --- 12
3.2 Comparison between Europe and USA. --- 13
3.3 Focus on M&A sin telecommunications industry --- 16
4. Methodology of analysis and sample overview. --- 18
4.1 Methodology. --- 18
4.2 Sample Characteristics. --- 20
4.3 Descriptive statistics of the sample. --- 21
5. Results by characteristics of deals and firms. --- 22
5.1 Acquirer’s CAARs for the entire sample. --- 23
5.2 Acquirer’s CAARs by method of payment. --- 23
5.3 Acquirer’s CAARs for domestic vs cross-border bids.--- 25
5.4 Acquirer’s CAARs of UK vs continental European bids. --- 27
5.5 Acquirer’s CAARs by target legal status. --- 29
5.6 Acquirer’s CAARs by form of takeover. --- 30
6. Conclusions.--- 32
Bibliography --- 35
Appendix --- 40
List of Tables and Figures
Table 1. Drivers/hurdles matrix for telecommunications firms --- 40
Table 2. Deals included in the sample --- 41
Table 3. Number of deals per year, total and by deal characteristics --- 43
Table 4. Sample composition by countries of bidding and target firms --- 44
Table 5. Summary information from Table 4 --- 45
Table 6. Cumulative Average Abnormal Returns (CAARs) and test statistics by country of incorporation of the bidder (Mkt) --- 46
Table 7. Cumulative Average Abnormal Returns (CAARs) and test statistics by country of incorporation of the bidder (FF) --- 47
Table 8. Data collection and sample filtering --- 48
Table 9. SDC Platinum settings for deals’ sample --- 49
Figure 1. EU and USA Telecommunications services revenues --- 13
Figure 2. Users per 100 inhabitants in Europe, 2010-2016 --- 14
Figure 3. Revenues by firm in USA market --- 15
Figure 4. Revenues by firm in EU market --- 15
Figure 5. CAARs around announcement date (Mkt and FF) --- 23
Figure 6. CAARs around announcement by method of payment (Mkt) --- 24
Figure 7. CAARs by method of payment (FF) --- 25
Figure 8. CAARs in domestic and cross border bids (Mkt) --- 25
Figure 9. CAARs in domestic and cross border bids (FF) --- 26
Figure 10. CAARs of UK vs Cont. European target (Mkt) --- 27
Figure 11. CAARs of UK vs Cont. European target (FF) --- 28
Figure 12. CAARs by target legal status (Mkt) --- 29
Figure 13. CAARs by target legal status (FF) --- 30
Figure 14. CAARs by form of takeover (Mkt) --- 30
1
1. Introduction.
European telecommunications industry has experienced and to a certain extent is still experiencing a mergers and acquisitions consolidation wave that started in the industry in the 2000s, especially at a national level but which is predicted to have an increasingly cross-border and pan-European focus. This consolidation is driven by several factors such as changes in industry dynamics, regulatory changes and especially the high fragmentation of the European telecom industry where relatively few firms operate in a cross-border or pan-European scenario.
Recently there have been several high-profile transactions involving international players. Most importantly, in 2016 after the delisting of the company in 2015, Liberty Global and Vodafone got joint ownership of Ziggo, the main telecom operator in Netherlands; EE ltd in UK, which used to be a 50:50 joint venture of Orange SA and Deutsche Telekom, has been acquired by BT Group; in Italy, the joint venture between Veon and Hutchison created the biggest mobile operator in the country Wind Tre. These transactions allow telecommunication firms (“telcos”) to maintain a good profitability level, required by financial markets, by exploiting benefits1 coming from
M&A activities such as geographical expansion, infrastructure sharing and better ability to face increasing investing needs to keep pace with technological developments and increasing competition from other telcos and Over-The-Top (OTT) firms.
Based on these points, the consolidation through M&A appears to be convenient for telcos from an operating point of view. However, a more complete analysis should also consider the financial aspect of the transactions through an analysis of the previous transactions already happened in the market. The extent of shareholders abnormal returns has been one of the most studied topics in the M&A empirical literature to assess the price-reaction of deals around announcement day.
Historically researches on price-reaction around deal announcements returns focused mainly on US and UK markets, since continental Europe traditionally had weaker investor protection and generally less developed capital markets with concentrated ownership structure. However, this has changed in recent years and many studies have been done on the response of stock prices to deal announcements in continental Europe as well. Previous studies results will be discussed in more detail later, but a generally
1 For more detailed information look at Table 1. Drivers/hurdles matrix for
2
acknowledged result is that on average M&As are largely positive for target shareholders, while for bidding shareholders there is no clear evidence in favour of positive or negative outcomes.
These kinds of financial analyses have generally been performed at a macro level, looking at the aggregate market without focusing on the performance of a particular industry. Given the recent consolidation trend and the probable developments in the European telecommunications industry, it is possible to verify whether the general findings on the performance of the stock of bidding firms’ prior and after M&A announcements could also be applied to this specific industry and whether previous deals have received a good reaction in the stock market around announcement date. The primary purpose of this dissertation is to provide a comprehensive overview of the European takeover market in the telecommunications industry. In particular, the focus has been on the reaction of the stock price of the bidding company to the announcement of an M&A event in the telecommunications industry. The bidding shareholder short-term and long-term wealth effects has been analysed based on a variety of factors, such as the mean of payment of the consideration, the legal status of the target firm, the legal origin of the companies (UK vs continental EU) and others. The characteristics of the deals reflect the bidders’ motives, so by observing the different short-term and long-term price reaction around the announcement date it should be possible understand which are the most significant factors in such price movement.
This analysis also tries to assess whether the deals carried out in the telecommunication industry during the Seventh M&A wave have been well received by the market and have therefore achieved positive returns for bidding shareholders around the announcement date, identifying at the same time the conditions of the transactions under which these returns have been realized. The findings relative to the telecommunications industry have been compared to the results obtained in previous academic studies to understand whether the general research is also relevant when applied to this industry. Comprehending whether past European deals in telecommunications industry have been well received by financial markets, in relation to the acquiring firm stock, and the reasons of that reaction will also be helpful in assessing the financial convenience of future deals in the industry. The analysis is conducted using a technique which has been widely used in previous literature, computing the Cumulative Average Abnormal Returns (CAARs) of bidder shareholders, which look at the average excess return around the announcement date for a set sample of firms. The study regards M&A activity for telecommunications
3
companies between 2010 and 2016 and gives a unique perspective on the European telecom industry M&A market.
In the following chapter, there will be a review on the main academic studies related to M&As and their characteristics. In particular, the section will focus on the main findings in academic literature related to M&A transaction performance for acquirer shareholders and on analysis of the literature regarding stock price-reactions to M&A announcement, with the main results coming from research on the European takeover market. This will include previous studies regarding both bidding and target firms as well as bidding firms only, since those are the focus of this study. After this, there will be an overview of the telecommunications industry in Europe, with a comparison with the same industry in the US and a focus on M&A involving telcos. Following, there will be a detailed section on the methodology and statistical techniques adopted in the study where the models used for the analysis will be described and explained. In the same section, there will also be a description of the composition of the data of the sample of deals included in the analysis, divided by the features of the deals. After this, the results section will contain the findings related to the short-term price reaction around the announcement date using the cumulative average abnormal returns for the bidding company’s stock. This will help to understand whether some deal features lead to a better price reaction than others at announcement date. In conclusion, there will be the final remarks of the paper, with a summary of the main results and takeaways of the analysis.
4
2. Literature Review.
In this chapter there will be a review of main studies that have been done on the topic of mergers and acquisitions (M&As) and their results. This will be done starting with a general description of the motives leading to, and characteristics of, M&As. Then, the main studies that have been done on acquirer’s returns and their main results will be outlined showing the general findings on returns around announcement date for acquirer’s shareholders.
2.1 Mergers & Acquisitions waves
First of all, it is important to give an historical view of mergers and acquisitions evolution. It is unanimously accepted that mergers and acquisitions happen in waves. This has been studied by many but among the first have been Gort (1969), Mitchell and Mulhering (1996) and Golbe and White (1993). The reasons for which there is this division in waves are not clear and there a separation in thoughts in the literature (Golubov et al. 2012). The neoclassical theory supports the fact that merger waves happen as a reaction to economic shocks such as new technologies, changes in regulation or the surge of substitute products (Gort 1969; Harford 2005). The opposing theory posits that waves happen in response to the presence of mispricing of companies’ fundamentals in the market. In fact, when this happens managers are incentivized to use the overvalued stocks of their firms to buy the stocks of undervalued (or less overvalued) firms in the market (Shleifer and Vishny 2003; Rhodes-Khopf and Viswanathan 2004).
Six mergers and acquisitions waves have been studied until now and for some academics there is now a seventh wave. Regarding the exact starting and ending years of the waves there might not be an exact consensus, but the differences in different articles are minimal and the overall period is the same. For this dissertation, the following dates have been taken from Golubov et al. (2012). The M&A waves are:
1. Horizontal Consolidation Wave (1893-1904): in this period surged the giant firms for mines, oil, telephone, railroad and infrastructures in general, especially in US. This wave ended due to the institution of antitrust laws and the beginning of the First World War.
2. Increasing Concentration Wave (1919-1929): the second merger wave continued the consolidation in the industries of the first wave, with a focus on vertical integration. Car industry was born in this wave. The financial crisis of
5
1929 and the following years of the Great Depression caused the end of this wave.
3. The Conglomerate Wave (1955-1969): in America there has been a boom of conglomerate firms, such General Electric, ITT, Tyco and others. There was a focus of managers and organizational models. This tendency of conglomeration was severely diminished when in many cases synergies were not achieved and the stock market introduced a conglomerate discount. 4. The Retrenchment or Leveraged Buyouts Era (1980-1989): the first half of the
‘80s saw many cross-border M&A transactions in Europe in sight of the common market and very active U.S. multinationals at a global level. In the second half there have been many leveraged buyouts, often financed with junk bonds. The financial crash caused by the high number of these bonds and the loan bank crisis caused the end of this wave.
5. Strategic Megamerger Age (1993-2000): this wave saw a record of transaction value with skyrocketing purchase prices. Deals like Exxon and Mobil, AOL and Time Warner, Chrysler and Daimler were conducted in this period. The M&A wave ended due to the internet bubble in 2000, when the worldwide M&A market reached $3.3 trillion.
6. Cross-Border and Horizontal Megamergers Age (2003-2007): the sixth wave was characterized by consolidation in commodities and utilities industries, encouraged by increasing globalization and incentivizing government regulations to create strong national firms operating globally. Private Equity firms also had an important role in this period due to a high availability of bank financing. The wave came to an end due to the global credit crisis in 2007 and the following crisis.
Based on some new studies, particularly from professionals there is a 7th wave ongoing,
started after the financial crisis (see eg. Camaya Partners and EY reports):
7. Quantitative Easing Era (2012-currently): some scholars and professionals say that there is an ongoing merger wave mainly driven by the low cost of financing. Another reason for M&As has been to gain tax benefits by changing the country of incorporation. In fact, based on data from Zephyr, in 2015 there has been the largest value of transactions ever, with $6.3 billion.
The increase in M&A volumes coming with this 7th wave has also involved the
Telecommunications industry. This is particularly true in Europe, where in addition to the low cost of capital there is also a fragmented industry and the lack of truly pan-European players facilitating mergers in the industry. Also from the regulatory point of
6
view the European Union is pushing towards the consolidation at a national and at a European level (Manero et al. 2014, Marketline 2017 European Telecommunications Report).
2.2 Motives for M&As.
There are many different motives that could bring to a takeover or a merger. In the literature, there are different explanations to why companies participate in corporate takeovers. The main motive can be found in synergies. Synergies are the most common goal for purchasing a merger or an acquisition and are achieved when the combined entity resulting from the M&A transaction has a higher value than the sum of the two stand-alone firms (Jensen and Ruback 1983, Desai and Kim 1988 both as cited in Martynova and Reneeboog 2006).
Synergies can be financial or operating. Operating ones are obtained through cost reduction, operational efficiency, economies of scale or a rationalization of the overhead (Ravenscraft and Scherer 1989). Generally operating synergies arise when the transaction involves two firms which are in an identical or similar industry. Financial synergies on the other hand are due to exploitation of leverage, lower cost of capital or tax benefits or to obtain an improved cash flow stability and lower bankruptcy probability (Higgins and Schall 1975).
M&As can also occur when managers believe that there is a favourable financial condition to conduct acquisitions, during M&A waves for example, or when they believe that a poorly managed firm is under-priced and could have better results if managed better. This is the disciplinary market for corporate control (Franks and Mayer 1996). Moreover, factors such as managerial hubris, exploitation of foreign capital or labour markets or influence from investment banks can be other reasons to conduct M&As (Scholes and Wolfson 1990, Servaes and Zenner 1994, Golubov et al. 2011).
2.3 Shareholder’s returns in M&A.
One of the most widely researched issues has been the performance of bidder and target shareholders after M&A transactions. As already said before, previous papers mainly focused on US and UK markets, but recently there have been several researches on the European market as well (La Porta et al., 1998). Among those Martynova and Renneboog (2006) and Faccio et al. (2006) have done a comprehensive analysis of the shareholders returns in European deals. Those two articles will be the main reference for previous researches during this dissertation.
7
In this section, there will first be an analysis of previous studies on the reaction, captured with abnormal returns, of the stock price for acquiring shareholders around announcement date of M&A transactions. This will first be done by looking at evidence in US and UK markets, where most of past studies have turned their attention, and then focusing on European evidence. The most important factors and characteristics of the deal or of the bidding company that have been found to drive returns in previous literature will also be outlined. On this topic will expand the chapter regarding the methodology and then results based on those characteristics will be given for this analysis.
The performance of a stock around the announcement of a deal is typically measured using abnormal returns of the stock in respect to an index. In the empirical literature, there is a general consensus on the fact that mergers and acquisitions create value for the combined entity and that target shareholders benefit the most from this value accretion. In fact, based on studies of US and UK markets, target shareholders receive large premiums relative to the pre-announcement share price (going from 20% to 40%) at the moment of the acquisition announcement (Song and Walkling, 1993; Bauguess, Moeller, Schlingemann and Zutter, 2009). In continental Europe the results are similar, with average abnormal returns for target shareholders spacing from about 13% to 30% (Frank and Harris 1989, Goergen and Renneboog 2004). There is evidence from previous studies that these abnormal returns for target shareholders are not only achieved on or after announcement day, but start up to two months before it. This is most likely a reflection of bids anticipation coming from rumours, information leakage or insider trading. (Dennis and McConnell 1986, Goergen and Renneboog 2004). However, while there is a clear indication in the literature regarding target shareholders’ abnormal returns being positive, for what concerns bidder shareholders there is not such a clear cut. In most cases, findings show that abnormal returns for acquirer shareholders are close to zero, slightly positive (Moeller and Schlingemann 2005, Schwert 2000) or slightly negative (Andrade et al. 2001, Mulherin and Boone 2000, Franks et al. 1991). Recent studies show that acquirer shareholders, on average, earn a positive abnormal return if the deal has certain features, such as if the target is a private firm and the form of payment is in stocks (Netter and Stegemoller 2002, Golubov et al. 2012).
Finally, given that around announcement date target shareholders report on average a significantly positive abnormal return and that acquiring firm shareholders have a close to zero abnormal return, the combined entity will have a positive effect on its market
8
value. This has been studied by Mulherin and Boon (2000), who found combined abnormal returns of 7% for period of 1962-1984 and about 4% for 1971-1999. Andrade (2001) found a lower positive effect of 1.8% for 1973-1998 in US.
2.4 Factors influencing returns.
Different features of the transaction or of the target and bidder firms have been studied to affect the firms’ value at the announcement of the takeover. The following are some of the factors which have been found to be most relevant or impactful on returns for acquiring or target firm.
Listing status of the target firm will affect abnormal returns: public target firms will generally result in slightly negative returns for bidders. Faccio, McConnell and Stolin (2006) show that in European countries takeovers involving public target have zero-to-negative bidder returns, while private firm acquisitions have as a consequence slightly positive bidder returns. This is coherent with the illiquidity discount of private firms. Another factor are announcements of M&A done by bidding firms in which management has a significant equity stake generally see a better reaction for share price than those done by bidding firms in which management does not have an equity participation (e.g. Agrawal and Mandelker 1987).
Announcements of hostile takeovers generally have as an outcome higher target returns than friendly M&A announcements. The opposite is true for bidder returns, with lower returns for hostile deals and higher for friendly. (Goergen and Renneboog 2004, Franks and Mayer 1996).
The method of payment used in the deal is one of the main factors in determining the acquisition returns. Based on Moeller et al. (2004), Andrade (2001) and Travlos (1987) all-cash bids cause higher target and bidder returns that all-equity takeovers. This is because equity acquisitions signal that the management believes that the stock is overvalued, resulting in a downwards price adjustment in the market. In fact, it is true that managers try to exploit the peak of M&A waves or good market period for the equity issues. On the other hand, managers often misuse excess cash in the firm, decreasing expected acquirer returns (Jensen 1986).
The underlying strategy of the deal is also relevant. Deals in which target firms are within the same industry of the acquirers generate higher acquirer returns that the ones in which there is a corporate diversification strategy (Doukas et al. 2002, Matsusaka 1993, Hoberg and Philips 2010).
9
Finally, target firms in cross-border acquisitions generally have larger abnormal returns than their domestic firms’ targets. (Doukas and Travlos 1988, Conn et al. 2005). This is reflected in an opposite performance for bidder shareholders, who enjoy an higher return for domestic acquisitions rather that cross-border. This is due to the fact that market anticipates possible regulatory or cultural differences between bidder and target firms, making it more difficult to integrate and manage the post-acquisition process (Baldwin and Caves 1991, Schoenberg 1999).
There of course are many other factors which can modify the returns of the shareholders, but the aforementioned are the most important ones.
In this dissertation some of these factors will be taken into account when looking at acquirers return in telecommunications industry. This research will add to the studies on the price-reaction of the acquirer’s stocks and will focus on the price-dynamics in Europe and for a specific industry rather than having a market-wide scope of research.
2.5 Focus on European studies.
Since the aim of this paper is to conduct a research on the acquirer shareholder’s short-term price reaction in Europe, there will now be a focus on the findings from previous researches done on European samples.
Martynova and Renneboog (2006) have done a research regarding M&As in Europe and have looked at the returns of acquirers in different deals. Their research looked at the price-reaction of M&A deals between 1993 and 2001 using Cumulative Average Abnormal Returns (CAARs) over different event windows, focusing mainly over a six months timespan, or a period of 60 trading days before and after the announcement date. This method allowed them to not only look at reactions of the price just before and after the announcement of the M&A, but also to check if that reaction was consistent in the period following it or if there were leakage before the event date. At a general level, they found that the price reaction of bidding firms is on average modest but still positive at around 0.8% around the announcement date but becomes significantly negative at a -3.0% after 60 trading days from the announcement. This behaviour is affected by different characteristics of the transaction such as payment method, board opposition and others.
In fact, when looking at abnormal returns by bid attitude, they find that announcement day abnormal returns for bidding firm are significantly slightly positive at 2.9%, 1.6% and 0.8% for unopposed tender offers, hostile bids and friendly deals respectively. However, in the 60 days after the announcement the CAARs results become negative
10
(-1.6% and -4.4%) for hostile and friendly deals and close to 0% for unopposed tender offers.
By looking at the returns by mean of payment, they found that cash payments are generally more well-seen by market than equity bids, since equity offers are received as a way for managers to exploit overvalued stocks. This means that all-cash and mixed offers respectively have announcement day abnormal returns of 0.6% and 0.9% while equity payments have a not significantly different from zero return. When looking at the six months CAARs, for all-cash bids those are not statistically different from 0, while for all-equity and mixed payments are significantly negative at -2.2% and -2.8% respectively due to the overvaluation signal transmitted to the market.
They also look at returns for domestic or cross-border acquisitions and they find that announcement day abnormal returns for bidding firms are higher for domestic acquisitions (0.6%) than cross-border ones (0.4%). Moreover, the whole period CAARs are more negative for cross-borders bids at -3.6% than domestic bids (-2.5%). Another aspect they look at is whether returns are different for M&As carried out in UK rather than continental Europe. This is because corporate control market is more active in UK leading to a dispersed ownership structure, while it is less so in continental Europe, where more concentrated ownerships are common. This leads to an expectation of way less hostile offers and higher announcement abnormal returns in continental Europe than in UK, fact confirmed in their research. They look at returns both for UK and continental bidders doing either cross-border or domestic M&As. The results are that there is little difference between CAARs of UK or Continental European bidders but bids on continental targets have a cumulative average abnormal return of 0.5%, higher than UK one which is not significantly different from zero.
Martynova and Renneboog (2006) also analyse the effect of acquiring 100% of equity, and therefore full control, of a firm rather than acquiring just the majority of the voting rights. In the first case, market reaction to the announcement is much better, with an abnormal return on announcement date of 0.6% versus one of 0.4% in case of partial acquisitions. The most relevant finding is that in the 6-month period centred around the event date, bidding shareholders doing a full acquisition experience a CAAR not significantly different from 0, while those doing partial acquisitions experience a CAAR of about -5%.
Also, in this research they analyse the returns when target firms are public versus when they are private. Acquisitions of privately-held companies represent the majority of intra-European M&A activity. In accordance to other researches, Martynova and
11
Renneboog find that announcement day abnormal returns are higher when acquiring a private target (0.8%) than a public one (-0.1%). However, post-announcement returns in a longer time window are better when the target is listed rather than private (with respectively CAARs of -1.3% and -3%).
Moreover, Faccio et al (2006) focus on acquirer’s return for listed and unlisted targets. Their analysis covers the period from 1996 to 2001. As an overall result for the period they computed the mean for five days Cumulative Abnormal Returns (CARs). The mean CAR for acquirers of listed targets is negative (-0.38%) and is not significantly different from zero, while the one for acquirers of unlisted targets is equal to 1.51% and is highly significantly different from zero, just like for acquirers of unlisted subsidiaries (1.44%). Given also that this result is also true when looking at sub-periods, acquisitions of listed targets seem to be the worst performing.
Faccio et al. also look at CARs by home country of acquirers, dividing between UK and non-UK acquirers. They find that the results do not vary between the two samples: mean CAR for acquirers of unlisted targets is significantly different from zero as well as greater than CAR for acquirers of listed targets both for UK and non-UK acquirers. Moreover, results for examined individual countries (France, Germany, Italy, Netherlands and Sweden) are consistent with the results of the full sample. In fact, for every country except France CAR for acquirers of unlisted targets is significantly greater than zero, while CAR for acquirers of listed targets is significantly greater than zero in all of five countries.
Furthermore, Faccio does a comparison of the results obtained for EU with the ones from previous articles studying acquirer’s returns in U.S. From their own research, the average CAR for Europeans acquirers of listed targets is -0.38%, compared to -1.49%, -1.02% or -1.00% for U.S. based on different researches and periods (respectively Chang’s, 1998; MS, 2004; FNS, 2002 as cited in Faccio et al., 2006 p. 205). Average CARs for acquirers of unlisted stand-alone targets for EU were 1.51% and 1.44% for unlisted subsidiaries, against 1.50% and 2.00% or 2.08% and 2.75% for U.S. (first two numbers from MS, 2004; the latter two from FNS, 2002; both as cited in Faccio et al., 2006 p. 205). Therefore, they conclude that “in terms of their signs, magnitudes and statistical significance, mean CARs for European acquirers’ line up closely with those of U.S.” (Faccio et al., 2006 p. 205).
12
3. Telecommunications Industry Overview.
In this chapter there will be a comprehensive overview of the telecommunications industry, looking in general at its trends and focusing on the M&A activities related to it. The information here presented is partly coming from own analysis of the telecommunications companies and partly from industry research from practitioners of the industry.
3.1 Telecommunications Industry general trend.
Telecommunications industry has been facing many changes during the last years. Many coming from technological innovation but many also from a change of business model due to the emergence of Over-The-Top (OTT) players that use the infrastructure provided by telcos (mainly the internet service) to offer their own services. This competition of external players, combined with the increased competition also between telcos themselves, has had a tough impact on revenues especially in Europe, where regulatory changes have favoured this increased competition.
In particular, roaming regulation could impact MVNOs (Mobile Virtual Network Operators), and telcos in Nordic and Benelux markets, but could help larger operators and Southern European networks. A common opinion among professionals is that Telcos will confirm their focus on the Fixed-Mobile (F-M) convergence, as an obvious solution to the competitive pressures. According to a Credit Suisse report, this convergence and consolidation will also help, having better economies of scale, to face the rise in CAPEX driven by the need to keep pace with competition and with technological innovation both for mobile and fixed infrastructures. On the side of mobile connectivity, the need to improve existing 4G infrastructure, making it compatible with the new 5G standard, necessary to satisfy the increasing demand for mobile data. Regarding fixed connection, big investment will also be needed to roll-out in a big scale FTTH connections, which had been put aside in favour to the less capital intensive FTTc, but which look inevitable in the long-term plans.
If competition is the main problem from an industry point of view, F-M convergence seems to be the solution to be able to face the increased CAPEX needed to keep pace in this environment. In fact, it represents an example of a strategy in the telco sector that has broadly 'worked'. Furthermore, this kind of consolidation appears to be generally supported by regulatory authorities, with antitrust allowing F-M combinations such as BT-EE, Wind-Tre and Vodafone with Kabel/Ono/Ziggo with relatively few concessions.
13
3.2 Comparison between Europe and USA.
The overall Telecommunications services revenues from 2010 to 2016 for both Europe and USA compared by ETNO (European Telecommunications Network Operators’ Association) are reported in figure 1.
Figure 1. EU and USA Telecommunications services revenues
From figure 1, it is possible to notice the difference between the latest trend in the European and USA markets. In Europe, revenues have suffered from a steep decline, from € 255 billion to € 221 billion with a negative CAGR of -2.36%. However, while from 2010 to 2013 the YoY change was worsening, in the period between 2013 to 2016 it is possible to see an inversion in trend, with a close to 0% variation for 2016. In the same period, revenues in USA went from € 283 billion to € 309 billion, with a CAGR of 1.48%. Nevertheless, revenues in USA registered a bigger increase between 2010 and 2013 (CAGR of 2.86%) than between 2013 and 2016 (with a 0.11% CAGR). It is possible to note from figure 2 that the decrease of revenues happened in European market is not due to a shrinking demand, since the number of users increased both for mobile and fixed communications.
-5 -4 -3 -2 -1 0 1 2 3 4 5 0 50 100 150 200 250 300 350 2010 2011 2012 2013 2014 2015 2016 R ev en u e Gro w th ( %) R ev en ues (mln € ) Year
EU USA EU growth USA growth
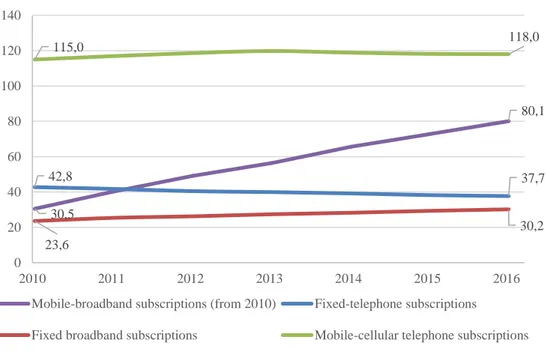
14
Figure 2. Users per 100 inhabitants in Europe, 2010-2016
In fact, the decrease in revenues is more likely to be due to a decrease in the ARPUs (Average Revenue Per User) coming from the increased competition especially in mobile market (ETNO reported a sharp fall in ARPU for mobile voice services from 10€ in 2010 to 6.2€ in 2016 and a slight decrease in fixed line ARPU from 25.6€ in 2010 to 24.7€ in 2016).
To provide a further comparison between the European and the USA markets, the revenues for the top telcos in each have been aggregated for the FYs from 2010 to 20162. For the European market, Deutsche Telekom3, Vodafone, Telefonica, Orange
and Telecom Italia have been considered, while in the sample from USA, AT&T, Verizon, T-Mobile and Sprint Corporation have been included. Values not in EUR have been converted using the relevant closing exchange rate at the end of the 2016 FY in order to avoid biases coming from FX variations.
2 The aggregated numbers from this own analysis are not necessarily comparable with the one
of the previous diagram due to adjustments that ETNO made to the reported values.
3 Including its share of revenues from USA operator T-Mobile.
30,5 80,1 42,8 37,7 23,6 30,2 115,0 118,0 0 20 40 60 80 100 120 140 2010 2011 2012 2013 2014 2015 2016
Mobile-broadband subscriptions (from 2010) Fixed-telephone subscriptions
Fixed broadband subscriptions Mobile-cellular telephone subscriptions
15
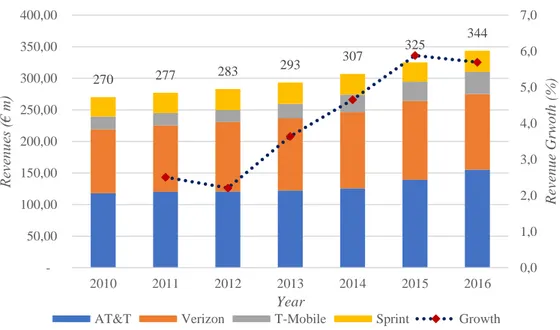
Figure 3. Revenues by firm in USA market
From figure 3 it is possible to see how the revenues are divided among the top firms in US. It is very clear that the market is dominated by AT&T and Verizon, that always account for more than 80% of the total revenues. Moreover, in this period there has always been a growth in revenues, with a CAGR of 4.09%.
Figure 4. Revenues by firm in EU market
Figure 4 presents the segmentation of revenues among the top European telcos. From this analysis is pretty clear that the market is much more segmented than the USA one, especially accounting for the fact that in 2015 the top 4 firms in 201USA represented
270 277 283 293 307 325 344 0,0 1,0 2,0 3,0 4,0 5,0 6,0 7,0 50,00 100,00 150,00 200,00 250,00 300,00 350,00 400,00 2010 2011 2012 2013 2014 2015 2016 R ev en u e Grw o th ( %) R ev en ues (€ m) Year
AT&T Verizon T-Mobile Sprint Growth
289 269 266 263 240 232 233 -10,0 -9,0 -8,0 -7,0 -6,0 -5,0 -4,0 -3,0 -2,0 -1,0 0,0 1,0 50,00 100,00 150,00 200,00 250,00 300,00 350,00 2010 2011 2012 2013 2014 2015 2016 R ev en u e Gro w th ( %) R ev en ue (€ m) Year
DT Vodafone Telefonica Orange
TI Growth
Source: Own analysis of data from public reports
16
98% of the market4 while in 2016 the top 5 in Europe only accounted for 69.15% of
the European market5.
It can also be observed that, notwithstanding the negative growth rates, in the latest years there has been an inversion of trend in revenues confirmed also by the recent results for Q1 and Q2 of 2017, when a 4.0% increase has been registered in European revenues compared to the same period in 20166.
3.3 Focus on M&A sin telecommunications industry
In 2016, telecoms spent US$224 billion on M&A globally, an increase of 137 percent over the prior year, according to Capital IQ.
The recent consolidation trends for Telcos regarded not only the aforementioned F-M convergence, but have been often related also to cable companies because of the possibility of sharing the same infrastructure. This has permitted Telcos to offer in addition to the “triple play” offers, comprising of fixed telephony, wireless services and internet connectivity, the so said “quadruple play” offers, which added television services (generally via cable or via internet, exploiting the broadband).
Despite an increasing control by antitrust authorities, many deals in the past few years had as a motive the increase in market share and the better control of prices coming from the acquisition of rival companies within the telecom industry, that also had as a result the doubling up of the core networks. Among the most important transactions in the last 3 years there were the one of Kabel Deutschland in 2013, when Vodafone gained access to the cable company’s 8.5 million households in Germany being able to offer a “quadruple play”. Vodafone has also been active in the Netherlands, with the Ziggo JV (2016) and in Spain with Ono (2014). Regarding the F-M convergence, in 2016 BT, mainly active in the fixed connection market, acquired EE, the biggest mobile operator in UK which was founded as a JV between Orange and DT. With a similar theme of F-M convergence, in 2016 there has been a JV between Veon and Hutchison that created Wind Tre, biggest wireless operator in the country by number of customer and among the bigger fixed-line operators.
In USA, Verizon’s recent decision to acquire XO Communications should boost its presence in the small and medium-sized enterprise market. At the same time AT&T’s pending purchase of Time Warner and its vast storehouse of content is an example of
4 Based on data from Statista, AT&T, Verizon, T-Mobile and Sprint represented 98.9% of the
USA market, with the remaining part being related to the operator US Cellular.
5 Based on data from ETNO Annual Economic Report 2016. 6 Data from http://temax.gfk.com/reports/ .
17
an acquisition of a non-telecom company by a telco with the objective of offering bundled-up content. With a similar philosophy was Verizon’s acquisition of AOL in 2015, with the objective of exploiting AOL’s vaunted automated online advertising program as a source of growth for Verizon’s telecom companies. within the nearby media spectrum. As said in a PwC report on Telecommunications industry, deals like these, targeting firms not exactly in the telecommunications industry but in industries which are essentially related to it, have the potential to reshape the industry, especially if they allow companies to build scale using the size of the Telcos while keeping the focus on their expertise.
Recently announced is the interest of T-Mobile and Sprint Corporation in what would be the merger between the third and fourth operators in the USA. While Deutsche Telekom and Softbank, their respective majority shareholders, have not yet reached a final agreement, the deal would anyway be subject to the antitrust approval. This merger would bring economies of scale, needed to preserve margins and invest in new infrastructure.
18
4. Methodology of analysis and sample overview.
4.1 Methodology.
There will now be an explanation of the methodology used to conduct the analysis. The analysis follows what has been done in Martynova and Renneboog (2006), applied only to the Telecommunications industry and in a different period, but is more in general based on widely known event study analysis of stock price reaction with abnormal returns.
The share price reaction to the deal announcement is measured by computing the abnormal returns around the announcement day in a period starting 60 trading days before until 60 trading days after the announcement. Abnormal returns (ARi,t) are
defined as the difference between the realized, or actual, arithmetic return7 (R
i,t) and an
expected, or predicted, return (ERi,t), which is the anticipated return in case there would
not have been an M&A announcement based on the pre-M&A relation between the stock price and the benchmark index.
The ERs needed to compute the ARs have been estimated using two different models: The OLS market model, as in Brown and Warner (1985) or Faccio et al. (2006), which has been widely used in the literature and, although simple, has been found to yield consistent results and; the three-factor model based on Fama, French8 (1993) which
takes into account also a return premium in relation to size and boot-to-market-equity introducing two more independent variables in the regression (SMB, small minus big, and HML, high minus low).
To compute the ERs with the OLS market model approach the following was used as the regression model:
R
i,t= α
i– β
i*R
m,t+ε
i,t(1)
Where Rm,t is the actual market return on day t based on the MSCI Europe market index.
7To compute the actual, realized return of the firm i (R
i,t) starting from the Total Return Index
(RI) from Datastream 5.1, the following formula has been used: 𝑅𝑖,𝑡= 𝑅𝐼𝑖,𝑡
𝑅𝐼𝑖,𝑡−1 − 1. The Total
Return Index has been preferred to the Price Index, since it is corrected for stock splits and is dividend-adjusted.
8 SMB and HML European daily factors have been downloaded from
http://mba.tuck.dartmouth.edu/pages/faculty/ken.french and converted to a € denomination ; risk free is the European 3 months deposit rate.
19
(3)
The three-factor model is based not only on the market returns, but includes also a size (SMB) and a value (HML) excess premiums and estimates linearly the factors of the following model:
R
i,t– R
f= α
i– β
mkt,i*(R
mkt,t– R
f) + β
smb,i*SMB
t+ β
hml,i*HML
t+ε
i,t(2)
For both the market model and the three-factor model, the model parameters are estimated over a period of 240 trading days, starting from 300 to 60 trading days before the announcement date.
Using these models, it is possible to compute the ARs and consequently the cumulative abnormal returns9 (CARs) for different event windows around the announcement in the
60 days before and after the announcement for each bidding firm.
Using the CARs, the cumulative average abnormal returns (CAARs) have been computed over different time windows as in Martynova and Renneboog (2006), in order to assess the price-reaction:
𝐶𝐴𝐴𝑅𝜏= 1 𝑁∑ 𝐶𝐴𝑅𝑖τ = 𝑁 𝑖=1 1 𝑁∑ ∑ 𝐴𝑅𝑖,𝑡 𝑡=𝑡2 𝑡=𝑡1 𝑁 𝑖=1
where τ denoted the event window from t1 to t2, for -60 ≤ t1 < t2 ≤ +60.
The statistical significance of the CAARs test follows the multi-day interval test as it is presented in Brown and Warner (1985)10. This test statistic follows a Student-t
distribution under the null hypothesis, and given that the degrees of freedom exceed 200 it is assumed unit normal. This is done, for CAARs based on each deal or firm characteristics, both for the market model and for the three-factor model.
9 This is done using the formula 𝐶𝐴𝑅
𝑖τ= ∑ ∑ 𝐴𝑅𝑖,𝑡 𝑡2 𝑡=𝑡1 𝑁
𝑖=1 where τ denoted the event window
from t1 to t2, for -60 ≤ t1 < t2 ≤ +60.
10 The following formula is used to test significance of CAARs: 𝑡
𝐶𝐴𝐴𝑅= 𝐶𝐴𝐴𝑅𝜏 𝜎̂(𝐶𝐴𝐴𝑅𝜏) where σ ̂(𝐶𝐴𝐴𝑅𝜏) = √ 1
𝑁2∑𝑖=1𝑁 ∑𝑡2𝑡=𝑡1̂σ2𝑖 and σ̂𝑖2is the variance of the Ars for security I computed
in the 240 days estimation windows from -300 days to -60 days from event announcement day. Statistical tests have been done at 5% significance level.
20
4.2 Sample Characteristics.
In obtaining the sample of 68 deals, Martynova and Renneboog (2006) criteria are followed, but limiting the scope to the telecommunications industry11 and in a period
between 1st of January 2010 and 31st of December 2016, so that only deals with the
following characteristics are included.
First, only intra-European takeovers are considered, with both bidder and target from Western Europe or UK. The restriction on only Western Europe or UK deals is applied since financial markets in Eastern Europe have different rules and this could cause inconsistency and lack of comparability in the analysis of acquirer’s returns.
Second, bidding firms must be listed publicly, to be able to conduct the analysis regarding the price reaction.
Third, the transactions must involve a change of control, meaning that the acquirer should retain control of the target after the deal, while not controlling it before. In this way transactions where the bidder is only intending to buy a mere minority participation or to increase the ownership share in a firm which was already controlled are excluded from the sample.
Fourth, the transaction has to be related to a deal which was completed at the time of the analysis. Attempted or pending deals are not included in the sample. Moreover, bids done on the same target and by the same bidder within 300 days from each other are excluded to avoid biases in the estimation of the parameters of the model needed to calculate the abnormal returns. To avoid having two overlapping event windows, also bids made by the same acquirer, even for different targets, within an interval smaller than two months are not included.
Fifth, the transactions must be between two independent companies. This means that target companies which at the time of the bids were subsidiaries and deals in which the bidder was the management of the company itself, are excluded from the sample. This has been done to enhance comparability among the deals.
Moreover, the sample gathered from the database was further reduced since some bidding firms were infrequently traded, not allowing to infer the necessary parameters
11 Targets have been identified as part of Telecommunications industry by filtering the database
from SDC Platinum M&A section to just include firms with a Standard Industrial Classification (SIC) code of one of 4899, 4812, 4822 and 4813. See Appendix for more details.
21
to compute the price reaction around announcement date, or there were not enough observations for parameter estimation.
4.3 Descriptive statistics of the sample.
In the period covered in the analysis, between 2010 and 2016, whose info is summarized in Table 3 12, 67.65% of the deals in the telecom industry sample were
domestic, done between firms of the same country. This data is comparable with the one obtained in the sample of Martynova and Renneboog (2006). However, looking at the single year 2016, the percentage diminished to 56.25% with a big increase in the cross-border proportion, possibly due to regulatory changes and due to the general consolidation trend.
In contrast with Martynova and Renneboog data regarding the whole market, in telecom industry almost the totality of the deals is done to acquire the 100% of the shares of the target, possibly due to the strategic nature of the assets (90% in this sample instead of 60% for Martynova). Moreover, only a very small portion of the target firms from the sample are actually listed, with most of acquired firms being private. In fact, as already pointed out in the introduction, there still is not a pan-European consolidation in the industry, but this is expected among the big players in the upcoming years.
In relation to the method of payment, when looking at single years the results are variable but if we look at the whole period from 2010 to 2016 the results are very similar to the ones obtained by Martynova and Renneboog, with 62% of the disclosed deals being all-cash, about 21% being mixed between cash and equity and just less than 17% all-equity. Also, in about 38% of the deals details regarding the mean of payment were not disclosed.
In Table 4 and Table 5 13 there is data regarding the geographical distribution of the
M&A activity in the Telecommunications industry between 2010 and 2016. Unsurprisingly, most of the activity is carried out within the United Kingdom, with 31% of the European domestic transactions being carried out in the UK and almost one out of three deals involving the UK either as the country of the bidding or the target firm. This data confirms that the British financial market is the single most active also in the Telecommunications industry. Regarding the overall activity of bidding firms,
12 Table 3, reporting the number of deals per year, total and by deal characteristics, can be found
in Appendix.
13 Tables 4 and 5, regarding the sample composition by countries of bidding and target firms,
22
following the UK, but with lower proportions are Sweden with 16%, Spain with 10% and France with about 9%.
By looking just at cross-border acquisitions, UK is not anymore the biggest market and there is not a nation with a many more deals than the others. In fact, France, Spain and Norway are the home-country of the bidding firm for the most number of deals with just 3 transactions. This is again an indication of the relatively low pan-European M&A activity, with only a third of the deals being completed out of national limits.
5.
Results by characteristics of deals and firms.
In this chapter will be analysed the CAARs for bidding firms realized in European M&As in telecommunications industry between 2010 and 2016. While the main focus is on the CAARs for the 6 months and 3 days around the event day, different event windows around the announcement date (-60,+60 ; -40,+40 ; -40,-1 ; -5,+5 ; -1,+1 days from announcement date) are studied in order to understand if the market reaction is the same around the various time-frames. When relevant, results from event windows different than -60,+60 (6 months window) and -1,+1 (3 days window) will be pointed out, otherwise the conclusion should be assumed to be substantially the same. Moreover, the CAARs are computed using both OLS market model (“Mkt”) and the three-factor Fama-French model (“FF”). The results will be discussed at a general level, valid for both the models, unless during the study a difference emerged between the two, in which case the peculiarity of the two will be highlighted.
Obtained acquirer’s CAARs will be associated to the characteristics of the deals and of the companies to which they refer in order to provide a more complete analysis as follows: overall acquirer’s CAAR for the whole sample of deals; CAARs by the method of payment, divided in all-cash bids, all-equity bids, mixed and undisclosed; CAARs for cross-border versus domestic transactions; CAARs for both UK and for Continental Europe acquirers doing both domestic or cross-border bids; CAARs for acquirers of public versus private target firms; CAARs of full versus partial acquisitions, where full acquisition means that bidder owned 100% of the share of the target after the transaction while partial means that it owned above 50% but below 100% of target firm; finally, an outlined of CAARs by the home-country of the acquirer.
23
5.1 Acquirer’s CAARs for the entire sample.
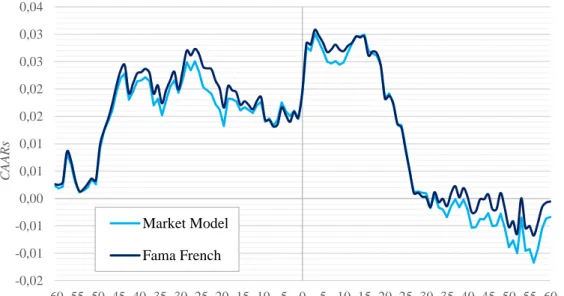
The price-reaction for bidding firms to the announcement of a deal in telecom industry for the whole sample, is significantly positive in the 3-days (1.17% Mkt; 1.25% FF) and in the 11-days (1.25% Mkt; 1.49% FF) event windows around announcement date. However, after 20 days from the announcement date, the CAARs decrease until they get to the 6 months’ time frame value, not significantly different from zero with both market model and Fama-French model. The reduction in abnormal returns after the announcement day is attributable to the more informed views from the market and the investors on the stock price and therefore the long-term CAARs [4 months CAARs are -2.15% (Mkt); -2.07% (FF) in this study] would be more significant since they are coming from more informed decisions (Martynova and Renneboog 2006, p.19).
Figure 5. CAARs around announcement date (Mkt and FF)
Now it will be shown how sign and magnitude of the CAARs of the bidding firm are affected by different characteristics of the firm and of the deal.
5.2 Acquirer’s CAARs by method of payment.
One of the factors which has been found to be relevant the most for what concerns abnormal returns and price reaction, especially for bidding shareholders, is the method of payment of the consideration. From the theory, there would be the expectation of a better reaction for all cash bids than equity ones, due to the signalling effect of overvaluation of the stock that comes with the equity offer.
-0,02 -0,01 -0,01 0,00 0,01 0,01 0,02 0,02 0,03 0,03 0,04 -60 -55 -50 -45 -40 -35 -30 -25 -20 -15 -10 -5 0 5 10 15 20 25 30 35 40 45 50 55 60 Market Model Fama French
Days from announcement date
CAA
R
24
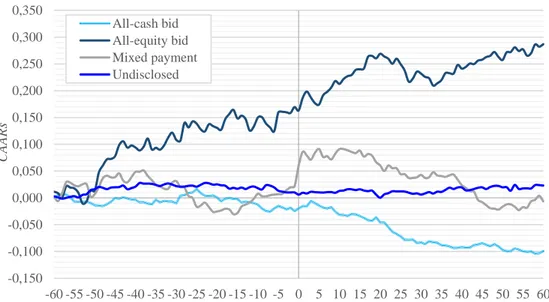
Figure 6. CAARs around announcement by method of payment (Mkt)
However, using market model, the results for this category are showing a clear preference for stock payment (25.75% 6-months CAAR) and a negative reception of cash payment (-9.90% 6-months CAAR), in contrast with what has been generally found in previous studies. While this could be due to an insufficient representativeness of the sample, it could also be a peculiarity of the telecom industry. In fact, apart from the financial signal given by stock payment, it could represent a better interest and operational tying between the acquiring firm and the target firm management in comparison to cash payments and this could be of importance in an industry like telecommunications, where the exploitation of synergies is fundamental. To be noted is that the short-term effect around the announcement date is greater for deals with mixed payments than any other, with respectively 6.62% and 8.38% for 3-days and 5-days CAARs. However, both 4 and 6 months CAARs for mixed payments are not significantly different from zero.
Moreover, all-cash deal CAARs are insignificantly different than zero in the short-term and significantly negative in the long-term (in addition to -9.90% 6-months CAAR also a -8.84% 4-months CAAR). -0,150 -0,100 -0,050 0,000 0,050 0,100 0,150 0,200 0,250 0,300 -60 -55 -50 -45 -40 -35 -30 -25 -20 -15 -10 -5 0 5 10 15 20 25 30 35 40 45 50 55 60 All-cash bid All-equity bid Mixed payment Undisclosed
Days from announcement date
CAA
R
25
Figure 7. CAARs by method of payment (FF)
For what concerns results obtained with the Fama-French model, these are essentially the same as for the market model, except for the mixed-payment long-term CAARs. In fact, 4-months CAAR are significantly negative, with -1.49% while for market model it is insignificantly different from zero. Finally, concerning deals with undisclosed method of payment, the announcement-day reaction is insignificantly different from zero, but in the long term there are significantly positive 6-months CAARs (1.94% Mkt and 2.30% FF).
5.3 Acquirer’s CAARs for domestic vs cross-border bids.
Figure 8. CAARs in domestic and cross border bids (Mkt)For what concerns previous studies on European takeover market, there is no clear evidence of whether cross border deals should have a better price reaction than domestic deals or vice versa. This is partially due to the fact that in continental Europe
-0,150 -0,100 -0,050 0,000 0,050 0,100 0,150 0,200 0,250 0,300 0,350 -60 -55 -50 -45 -40 -35 -30 -25 -20 -15 -10 -5 0 5 10 15 20 25 30 35 40 45 50 55 60 All-cash bid All-equity bid Mixed payment Undisclosed
Days from announcement date
CAA R s -0,025 -0,020 -0,015 -0,010 -0,005 0,000 0,005 0,010 0,015 0,020 0,025 0,030 0,035 0,040 -60 -55 -50 -45 -40 -35 -30 -25 -20 -15 -10 -5 0 5 10 15 20 25 30 35 40 45 50 55 60 Domestic Cross-border
Days from announcement date
CAA
R
26
financial markets have been less active than in Anglo-Saxons countries. However, based on Martynova and Renneboog (2006) empirical analysis, domestic deals tend to have better price-reaction than cross-border ones. In the sample analysed in this study, this is confirmed for what concerns market model results. In fact, short term CAARs around 3 and 11 days of the announcement for domestic bids are respectively of 1.35% and 1.36% versus 0.78% and 1.04% for cross-border bids. Longer term results are not significantly different from zero for what concerns 6-months CAARs, but are significantly negative for domestic bids at -2.80% and cross-border at -0.92% for the 4 months period.
Figure 9. CAARs in domestic and cross border bids (FF)
For what concerns results with Fama-French model, those are comparable with the ones obtained with the market model except for the long-term cross-border CAAR for the 4-months CAAR, insignificantly different from zero, and for the 6-months CAAR, for which the value is positive for 0.3%, even if statistically is not significantly different from zero. On the topic of domestic and cross-border bids will expand the following section, on the difference between UK and continental European deals.
-0,020 -0,015 -0,010 -0,005 0,000 0,005 0,010 0,015 0,020 0,025 0,030 0,035 0,040 -60 -55 -50 -45 -40 -35 -30 -25 -20 -15 -10 -5 0 5 10 15 20 25 30 35 40 45 50 55 60 Domestic Cross-border
Days from announcement date
CAA
R
27
5.4 Acquirer’s CAARs of UK vs continental European bids.
Based on Goergen and Renneboog (2004, as cited in Martynova and Renneboog 2006, p. 23) and on Barca and Becht (2001), the market for corporate control is very active in UK due to the low concentration in ownership of firms listed in the London Stock Exchange. In this way, ‘the firms are continually up for auction’. On the other hand, in continental Europe there is a much higher concentration of ownership in listed firms, with almost 60% of firms being family held versus the 24% for UK firms (Faccio and Lang 2002).
Figure 10. CAARs of UK vs Cont. European target (Mkt)
Results with both market model and Fama-French model show that domestic bids in UK are the worst performing in this sub-set of deals, with a not significantly different than zero three-days CAAR and significantly negative long-term CAARs (around -18.5% for the 4 months and about -24% for the 6 months CAARs for the two models). For what concerns price-reaction for bids made by UK acquirers targeting continental European firms, only 2 of such deals were included in the sample and the CAARs did not result significantly different from zero with either of the models, apart from the 4-months CAARs computed, which shows a negative long-term reaction of -3.36% with market model and -1.45% with Fama-French.
Regarding results for continental Europe, domestic deals showed strong evidence of significative positive CAARs, both in the short term around the announcement (around 2% and 3% respectively for 3-days and 11-days CAARs for both models) as well as in
-0,275 -0,250 -0,225 -0,200 -0,175 -0,150 -0,125 -0,100 -0,075 -0,050 -0,025 0,000 0,025 0,050 0,075 0,100 0,125 -60 -55 -50 -45 -40 -35 -30 -25 -20 -15 -10 -5 0 5 10 15 20 25 30 35 40 45 50 55 60 UK Domestic UK Cross EU Domestic EU Cross
Days from announcement date
CAA
R
28
the longer period around event date (about 4% of 4-months CAAR and 10% of 6-months CAAR). Cross-border deals with continental Europe bidder showed similar positive significant short-term 3-days and 11-days CAARs both for market model (0.90% and 1.03%) and Fama-French model (1.14% and 1.29%). For longer term CAARs, market model is not capturing significant differences from zero, while Fama-French model’s 6-months CAARs are positive at just above 0.42%
As Martynova and Renneboog say (2006, p.24), ‘the difference [between UK’s and continental Europe’s CAARs] may reflect a stricter takeover legislation in the UK than in the Continental European countries, which… gives target shareholders… higher premiums’, and therefore gives bidding firms a higher premium to pay, thing that is not well received by investors in the market.
Figure 11. CAARs of UK vs Cont. European target (FF)
-0,275 -0,250 -0,225 -0,200 -0,175 -0,150 -0,125 -0,100 -0,075 -0,050 -0,025 0,000 0,025 0,050 0,075 0,100 0,125 -60 -55 -50 -45 -40 -35 -30 -25 -20 -15 -10 -5 0 5 10 15 20 25 30 35 40 45 50 55 60 UK Domestic UK Cross EU Domestic EU Cross
Days from announcement date
CAA
R
29
5.5 Acquirer’s CAARs by target legal status.
There have been many studies on acquirer’s returns when bidding for listed or private targets. Faccio et al. (2006) point to the fact that bids for private target yield better results in terms of share price reaction than bids for listed target, obtaining a CAAR of -0.38% for European acquirers of listed firms and +1.38% for European acquirers of private firms. The preference of the market around announcement date for private target is confirmed by Martynova and Renneboog (2006, p.28), even if with different magnitude, who say ‘The fact that … privately-held firms are by definition illiquid, may create a price discount. Also, private firms are frequently controlled by one investor or investor group with which negotiations may have a better chance to succeed than with a tender offer’.
Figure 12. CAARs by target legal status (Mkt)
This study confirms that bids for private firms are better received than ones on public target also in telecommunications industry. In relation to public targets, the sample only contained 2 deals, in relation to which both short-term and long-term CAARs are significantly negative so, even if the magnitude of the CAARs could be different, the results should still be considered. In fact, both market model and Fama-French model get to the same conclusion that when a target is privately held, short-term CAARs are significantly positive (1.25% Mkt and 1.34% FF for 3-days CAARs). Also in the long-term CAARs result significantly positive in the 6-months period around announcement (1.20% Mkt and 1.44%FF). On the other hand, CAAR prior to announcement and 11-days and 4-months CAARs are insignificantly different from zero.
-0,520 -0,470 -0,420 -0,370 -0,320 -0,270 -0,220 -0,170 -0,120 -0,070 -0,020 0,030 0,080 -60 -55 -50 -45 -40 -35 -30 -25 -20 -15 -10 -5 0 5 10 15 20 25 30 35 40 45 50 55 60 Public Private
Days from announcement date
CAA
R
30
As previously touched upon, acquirer’s CAARs for bids for public firms in this sample are instead significantly negative both in the short and the long term and with both models, but the magnitude could not representative.
Figure 13. CAARs by target legal status (FF)
5.6 Acquirer’s CAARs by form of takeover.
Results from Martynova and Renneboog (2006, p. 29) show that market reaction to the announcement of a deal involving a complete takeover of the target company has been way better than the one for deals where the target company was owned only partially after the acquisitions (6-months CAAR of -5% for partial and not significantly different than zero for 100%). This could be due to the fact that investors are afraid of the possibility of hostile resistance by minority shareholders, while this problem is not present with an acquisition of 100% of voting rights.
Figure 14. CAARs by form of takeover (Mkt)
-0,500 -0,450 -0,400 -0,350 -0,300 -0,250 -0,200 -0,150 -0,100 -0,050 0,000 0,050 0,100 -60 -55 -50 -45 -40 -35 -30 -25 -20 -15 -10 -5 0 5 10 15 20 25 30 35 40 45 50 55 60 Public Private -0,075 -0,068 -0,060 -0,053 -0,045 -0,038 -0,030 -0,023 -0,015 -0,008 0,000 0,008 0,015 0,023 0,030 0,038 0,045 -60 -55 -50 -45 -40 -35 -30 -25 -20 -15 -10 -5 0 5 10 15 20 25 30 35 40 45 50 55 60 Partial 100%
Days from announcement date
CAA
R
s
Days from announcement date
CAA
R
31
The same kind of results are also obtained when looking at this sample of deals in the telecommunications industry. In fact, short-term announcement effect for partial acquisitions was negative for both market model for Fama-French model (3-days CAARs not significantly different than zero for both and 11-days CAARs of -1.58% for both models), with even worse effect when looking at the long-term or prior to announcement reactions (4-months CAARs of –7.11% and -5.42%; 6-months CAARs of -5.50% and -4.02%; 40-days prior announcement CAARs of -3.01% and -1. 73% for Mkt and FF respectively).
In relation to the effect of 100% acquisitions, which represent the vast majority of deals of the sample, CAARs prior to acquisition are not significantly different from zero but announcement day effect and short-term CAARs are significantly positive, with 3-days CAARs of 1.37% and 1.47% and 11-days CAARs of 1.58% and 1.84% for market model and Fama-French model respectively. In longer term CAARs, 4-months CAARs are significantly negative at -1.58% (Mkt) and -1.68% (FF) while 6-months CAARs are positive but insignificantly different from zero.
This last result is in accordance with previous study of Martynova and Renneboog (2006), where 6-months CAARs resulted not significantly different from zero and the announcement-day effect that resulted for 100% acquisitions in this analysis was significantly positive as well.
Figure 15. CAARs by form of takeover (FF)
-0,060 -0,050 -0,040 -0,030 -0,020 -0,010 0,000 0,010 0,020 0,030 0,040 0,050 0,060 -60 -55 -50 -45 -40 -35 -30 -25 -20 -15 -10 -5 0 5 10 15 20 25 30 35 40 45 50 55 60 Partial 100%
Days from announcement date
CAA
R