UNIVERSITY OF NAPLES FEDERICO II
DOCTORATE IN
MOLECULAR MEDICINE AND MEDICAL BIOTECHNOLOGY
XXXI CYCLE
Mitochondrial alterations in Down syndrome: molecular
mechanisms and therapeutic opportunities
Tutor Candidate Prof. Lucio Nitsch Nunzia Mollo
COORDINATOR
Prof. Vittorio Enrico Avvedimento Academic Year 2017/2018
INDEX
ABSTRACT 1
1. INTRODUCTION
1.1 The presence of three copies of chromosome 21 causes the Down syndrome 2 1.1.1 Experimental models to study Down syndrome pathogenesis 3
1.2 Mitochondrial defects are a phenotypic hallmark in DS 4
1.3 Molecular basis of mitochondrial dysfunction in Down syndrome 6 1.3.1 PGC-1α is a crucial modulator of mitochondrial biogenesis and function 6 1.3.2 Which Hsa21 genes are candidate for mitochondrial dysfunction
in Down syndrome? 8
1.3.3Hsa21 genes affecting other mitochondrial related functions: oxidative
stress and mitochondrial death pathway 10
1.3.4 Chromosome 21 miRNAs potentially involved in mitochondrial phenotype 11 1.4 Mitochondrial alterations might affect neuronal development and
neurodegeneration in Down syndrome 11
1.4.1 Mitochondria as major regulators of neuronal phenotype
1.4.2 Mitochondria as major regulators of neuronal development and
neurodegeneration in Down syndrome 12
1.5 Mitochondria as potential therapeutic targets in Down syndrome 13
2. AIMS OF THE STUDY 15
3. MATERIALS AND METHODS 16
4. RESULTS
4.1 The whole energy status of trisomic cells is significantly impaired 20 4.2 Trisomic cells exhibit abnormalities in mitochondrial architecture 23 4.3 Mitochondrial network and fission-fusion machinery genes in trisomic cells 25 4.4 Metformin and pioglitazione activate PGC-1α in trisomic cells 26 4.5 PGC-1α induction improve the bioenergetic profile of trisomic cells 29 4.6 ROS production is decreased in trisomic cells treated with
metformin and pioglitazone 31
4.7 Metformin and pioglitazone affect mitochondrial dynamics by modulating
the expression of fission/fusion machinery genes 32
4.8 Mitochondrial ultrastructure abnormalities are restored by metformin 4.9 Chromosome 21 miRNAs overexpression might contribute to mitochondrial
dysfunction in trisomic cells 35
5. DISCUSSION 39
6. CONCLUSIONS 43
7. ACKNOWLEDGEMENTS 44
8. REFERENCES 45
ABSTRACT
1
ABSTRACT
Increasing evidence suggests that the mitochondrial dysfunction represents a hallmark in Down syndrome (DS) and that it can play a role in the pathogenesis of DS. Impaired expression/activity of PGC-1α, a crucial modulator of mitochondrial biogenesis and functions, is emerging as a common underlying cause of mitochondrial dysfunction in several diseases. The analysis of molecular mechanisms responsible for the DS phenotype identified in the over-expression of the chromosome 21 repressor gene NRIP1/RIP140 a cause of the decreased in the expression and activity of PGC-1α and of several mitochondria-related genes. We demonstrated that by silencing NRIP1 in trisomic cells it was possible to counteract the mitochondrial alterations observed in these cells, including irregular mitochondrial dynamics together with defects in the fission-fusion machinery.
On this basis we tested the hypothesis that the induction of PGC-1α and of its downstream pathways might be able to reverse the mitochondrial dysfunction in DS. To this end we induced PGC-1α in trisomic fetal fibroblasts using two strategies: i) we used metformin, which stimulates PGC-1α through AMPK and SIRT1 activity; ii) we activated PGC-1α through the PPAR agonist pioglitazone. We demonstrated that both drugs were able to induce the PGC-1α pathway in trisomic cells. Both strategies stimulated respiratory capacity and increased ATP levels, while ROS production decreased. Most interestingly, both drugs affected mitochondrial dynamics promoting the formation of a mitochondrial network with branched and elongated tubular morphology. Accordingly, the expression of genes involved in the fission-fusion machinery, namely OPA1, Mitofusins and DRP-1, was modulated by either treatment, though the two drugs elicited different changes.
These results indicate that the induction of PGC-1α counteracts the mitochondrial dysfunction in DS cells stimulating the mitochondrial biogenesis and promoting the formation of a mitochondrial network.
We also investigated the role of chromosome 21 miRNAs in promoting mitochondrial alterations in DS. We put special attention to let-7c-5p, miR-155-5p and miR-99a-5p which are up-regulated in human fetal hearts. The study of their targets down-regulated in DS fetal hearts and involved in mitochondrial function identified the ATP translocator the
SLC25A4/ANT1 as a let-7c-5p target candidate for mitochondrial anomalies.
Taken all together these results indicate that unraveling the molecular mechanisms that underlie mitochondrial dysfunction in DS paves the way to new therapeutic approaches to counteract DS phenotypic traits and/or to prevent DS associated pathologies.
INTRODUCTION
2
1.
INTRODUCTION
1.1 The presence of three copies of chromosome 21 causes the Down syndrome
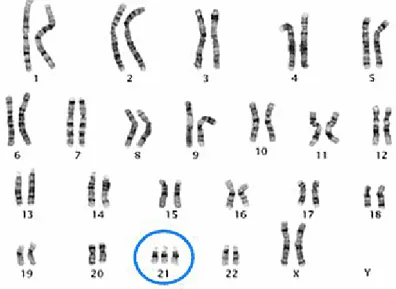
Down syndrome (DS) is one of the more commonly occurring genetic disorders with an incidence of 1/800 live births. DS is caused by a complete or partial trisomy of chromosome 21 (Hsa21) (Figure 1) and is characterized by a highly complex and variable phenotype (1). Symptoms always found include intellectual disability, associated with some impairment in
language, learning and memory (2) (3)and narrow slanted eyes, flat nose, muscle hypotonia
and short stature. DS is a major cause of congenital heart disease and the most frequent known cause of atrioventricular septal defects (4). In addition, there are other health problems affecting different organs and tissues such as immune and endocrine systems defects or nutritional disorders, such as obesity, diabetes and hypotiroidism (5).
Figure 1. DS karyotype. This karyotype shows the classic appearance of trisomy 21.
The phenotype of DS is thought to result from the dosage imbalance of multiple genes. Hsa21 encodes a number of transcription factors, co-regulators and post-translational modifiers, whose dysregulation might contribute to the DS phenotype by perturbing also gene expression of target genes mapping to different chromosomes (6). This hypothesis is supported by many studies, which demonstrate that three copies of Hsa21 may cause a 50% increase in the expression most of trisomic genes as primary dosage effect and an altered expression of disomic genes as secondary effects. Both primary and secondary effects will finally result in developmental defects and phenotypic alterations. High-throughput technologies have allowed the measurement of steady-state RNA levels for thousands of transcripts in human DS cells (7) (8) and in tissues from mouse models of DS (9) (10) (11) (12). All of them reported over-expression of triplicated genes, in a dosage-dependent way. These studies highlighted also that only a subset of Hsa21 genes is consistently over-expressed in comparison to euploid controls, and the increase in expression may differ from the expected~1.5-fold (7) (13) (8). Moreover, the set of over-expressed Hsa21 genes might differ across the trisomic cell types and developmental stages (14). These findings suggest that, in addition to gene dosage, epigenetic factors may affect gene expression (15).
INTRODUCTION
3 1.1.1 Experimental models to study Down syndrome pathogenesis
Given the complexity of the DS phenotype and of molecular mechanism involved, it is difficult to find adequate experimental models to study this pathology. For this reason many mouse models and cell culture models have been proposed for simulate DS condition.
Mouse models
Based on the homology (synteny) of Hsa21 traits with the murine chromosomes Mmu16, Mmu17 and Mmu10, several mouse models of DS have been developed. The first attempt to generate a mouse model of DS was the Ts16, a mouse trisomic for the entire Mmu16 (16). However, this model differs from the DS phenotype because Mmu16 presents syntenic regions with other humans chromosomes causing other phenotypic traits. Furthermore, Ts16 embryos die in utero, making it impossible to study the phenotypes of young and adult mice. The next approach consisted in generating mouse models with trisomies of sets of Mmu16 genes, orthologous to Hsa21 genes (17). In 1993, Davisson et al. (18) generated the Ts65Dn mouse, the most popular and widely used model of DS (19). Unfortunately it also presents a trisomy of a trait of Mmu17 containing non homologous to Hsa21 genes (20). Thus also this model does not show perfect matching with DS condition. Despite this bug, the Ts65Dn mouse is currently the model that better than others simulates DS phenotypic features such as
learning and memory deficits, and impairments in tasks involving the hippocampus.
Another mouse model, Ts2Cje, carries a rearrangement of the Ts65Dn genome with a Robertsonian translocation of the marker chromosome to chromosome 12 (21). This model is trisomic for a syntenic region smaller than that of Ts65Dn and does not contain other trisomies. Sago and co-workers generated two mouse models with the triplication of two different regions of Mmu16: the Ts1Cje mouse and the Ms1Ts65 mouse. Ts1Cje mouse, which presents a trisomy of 81 genes localized in the region of Mmu16 that extend from Sod1 to Znf295; the Ms1Ts65 mouse, which has a partial trisomy of 33 genes mapped in the region of Hsa21 that extend from App to Sod1 (22). These mice showed distinct learning and behavioral deficits, possible caused by abnormalities of the hippocampus. In addition Olson et al. (23) produced the Ts1Rhr mouse, a model that is trisomic for another Mmu16 region which contains 33 genes. Finally, Li et al. (24) generated a mouse trisomic for the complete Hsa21 syntenic region on Mmu16 containing 110 orthologous genes, the Dp(16)1Yey/+ mouse (17). Other two mouse models have been created trisomic for Hsa21 orthologous genes located in Mmu17: the Ts1Yah mouse, trisomic for 12 genes in the Mmu17 region (25) and the Dep(17)1Yey/+ mouse which is trisomic for the entire Hsa21 syntenic region on Mmu17 that contains 19 orthologous genes (17) (26).
The “transchromosomic” mouse line, Tc1, is a model of trisomy 21 that carries an almost complete human chromosome 21 (27). This strain summarizes features seen in DS patients including phenotypic alterations in behavior, synaptic plasticity, cerebellar neuronal number, heart development, and mandible size (27) (28). However, the Tc1 mouse presents variable levels of mosaicism of the extra chromosome in different tissues, because of an instability of the extra human chromosome during the development. After the three partial trisomic models, Yu et al. (26) generated a mouse model trisomic for all three Hsa21 syntenic regions. This mouse model, named Dp(10)1Yey/+;Dp(16)1Yey/+;Dp(17)1Yey/+, seems to be the best opportunity for modeling human trisomy 21 and it shows the DS related abnormalities in the central nervous system, including impairments in learning and hippocampal LTP as well as hydrocephalus. This is a promising new model with excellent construct and face validities but unfortunately is difficult to obtain it (26).
Finally, to study the role of particular genes in the DS phenotypes, a number of mouse models with the triplication of single genes in euploid models and trisomic mice, in which the expression of one trisomic gene has been normalized, have been created (29).
INTRODUCTION
4
In conclusion, many mouse models of DS have been generated, but none of them turns out to be a perfect model of DS mainly due to the lack of 3 copies of some Hsa21 orthologues and/or the trisomy of non-Hsa21 genes.
Human cell culture models
Starting from 2005 we have collected primary cultures of DS human fetal fibroblasts (DS-HFFs) because they are well characterized and have successfully been used in previous studies (30). Several DS-HFFs can be obtained from the "Bank of Fetal Biological Samples" at Federico II University of Naples.
Stem cell models have been successfully used to study neuronal alterations that occur in DS. Induced pluripotent stem cells from monozygotic twins discordant for trisomy 21 were used to investigate the anomalies occurring when they were induced to differentiate into neural progenitor cells (NPCs) and neurons (31). Studies on fetal brain derived neurospheres indicate that DS is associated with neurite and synapse formation defects (32), overrepresentation of glial lineages (33) and increased propensity for neuronal apoptosis (34) (35) (36). Finally, neurons derived from iPSCs of patients with DS demonstrated to reproduce early stages of Alzheimer’s disease type pathology in vitro (37).
All these data indicate that iPSCs from DS subjects are a good model to recapitulate neurodevelopmental stages in the study of DS pathogenesis.
1.2 Mitochondrial defects are a phenotypic hallmark in DS
Growing evidence suggests that the mitochondrial dysfunction, well documented in cellular models, animal models and human subjects, represents a phenotypic hallmark in DS.
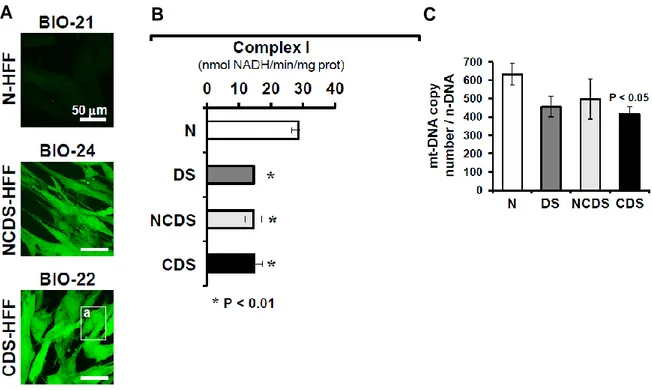
In DS-HFFs we found a global decrease of mitochondrial gene expression associated with the loss of mitochondrial bioenergetic capacities and abnormalities in mitochondrial structure. Trisomic fibroblasts showed a decrease of mitochondrial respiratory activity, inhibition of complex I, enhanced reactive oxygen species (ROS) production, decrease of mtDNA (Figure
2) and increased levels of intra-mitochondrial calcium (30). Interestingly, fibroblasts from
trisomic fetuses with cardiopathy showed a more pronounced mitochondrial dysfunction if compared with those without cardiopathy. These data suggest that an altered bioenergetic background in DS fetuses might be among the factors responsible for a more severe phenotype (30).
INTRODUCTION
5
Figure 2. Chronic pro-oxidative state and mitochondrial dysfunctions are more pronounced in fibroblasts from DS fetuses with congenital heart defects. (A) Confocal microscopy analysis of ROS production in DS
live fibroblasts. Representative LSCM imaging of the DCF-related fluorescence of euploid (N-HFF) and DS non-cardiopathic (NCDS-HFF) and cardiopathic (CDS-HFF) fibroblasts. Statistical analysis of the fluorescence intensity per cell as resulting from the averaged values ± SEM of about 100 randomly selected different cells for each sample from at least in-duplicate experiments was performer. (B) The specific activities of complex I (NADH dehydrogenase) was measured in cell lysates. The values are means ± SEM of the clustered N-, NCDS-, CDS-HFF. (C) Absolute qRT-PCR analysis of mtDNA. The bars are means ± SEM from five euploid and eight DS fibroblast samples (30).
Likewise, a deficit in the system of mitochondrial energy production, due to the impairment of mitochondrial respiratory chain complex I, ATP synthase, ADP/ATP translocator and adenylate kinase activities was reported in both fetal and adult fibroblasts with trisomy 21 (38).
INTRODUCTION
6 1.3 Molecular basis of mitochondrial dysfunction in Down syndrome
1.3.1 PGC-1α is a crucial modulator of mitochondrial biogenesis and function
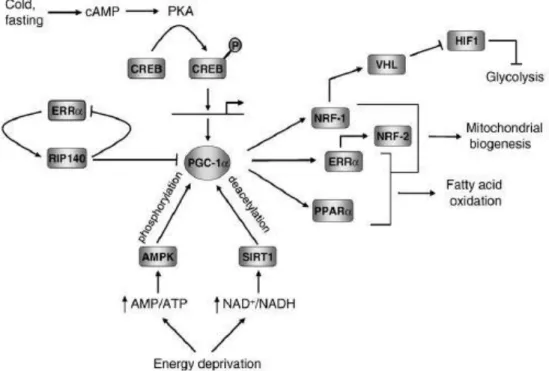
The molecular machinery responsible for mitochondrial energetic functions requires the regulation of many transcription factors and cofactors. The peroxisome proliferator-activated receptor γ co-activator 1α (PGC-1α/PPARGC1A) has emerged as a master regulator of mitochondrial biogenesis and function. PGC-1α regulates several aspects of oxidative metabolism enhancing the expression and activity of some transcription factors, such as the nuclear respiratory factor NRF-1 and nuclear receptors, such as PPAR-γ (39) (40) (41)
(Figure 3).
Figure 3. Regulatory network governing mitochondrial functions orchestrated by PGC-1α. Interactions
among some key participants in the transcriptional network regulating mitochondrial biogenesis are depicted schematically. The diagram summarizes the regulation of PGC-1α by transcriptional and post transcriptional pathways and its interactions with some of its target transcription factors involved in metabolic regulation. Potential suppression of glycolysis through NRF-1 control of VHL expression and negative is also shown (42).
INTRODUCTION
7
Forced over-expression studies performed in cultured adipocyte lines (43), cardiac myocytes (44) and in conditional, tissue specific, transgenic mice (45), have shown that PGC-1α is capable of driving virtually all aspects of mitochondrial biogenesis and functions, including activation of respiratory complexes, increased mitochondrial number, and improved mitochondrial respiratory capacity. Indeed PGC-1α knockout mice manifest a reduction of mitochondrial number and of respiratory capacity in skeletal muscle (41).
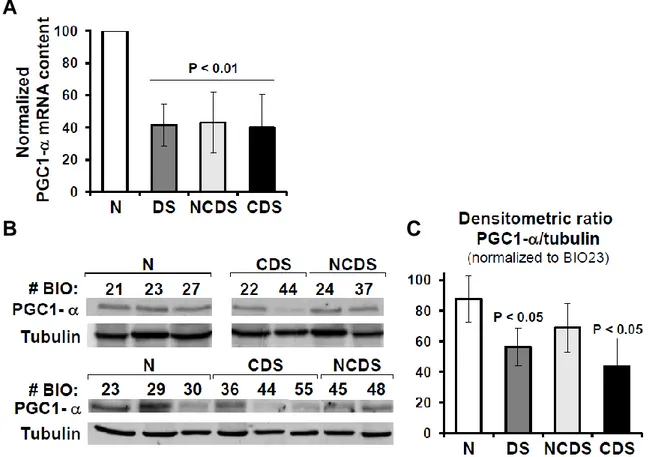
It is interesting to note that PGC-1α expression is decreased in cell types from DS patients
(Figure 4) and animal models (30) (8) (46).
Figure 4. 1α expression is decreased in trisomic fetal fibroblasts. (A) Expression analysis of the
PGC-1α expression by qRT-PCR. The bars are means ± SEM from five euploid and eight DS fibroblast samples; a distinction between non-cardiopathic (NCDS, n = 4) and cardiopathic (CDS, n = 4) fetuses-derived fibroblasts is also reported. The values of trisomic samples are normalized to that of the euploid ones. (B) Analysis of the PGC-1α protein. Western blotting of PGC-1α on total cellular protein extracts from euploid and trisomic samples (representative of two to three different analyses carried out for each sample). (C) Densitometric analysis of the PGC-1α-related immunodetected bands (means ± SEM of two to three assays) (30).
PGC-1α is indirectly involved in controlling the expression of mtDNA transcription by increasing the expression of mitochondrial transcription factor A (TFAM), which in turn is positively regulated by NRF-1 (42) (45). Gene expression analyses in trisomic cells and tissues and mouse models of DS revealed a disruption of the PGC-1α regulatory pathway in this condition. Analysis of the expression levels of the PGC-1α target genes, NRF-1 and TFAM, revealed a decrease of both transcription factors in DS cells and tissues when compared with controls (46) (30) (8). Consistently, a strong decrease in relative mtDNA content was found in DS human fibroblasts and in the Ts65Dn mouse model (46) (30). Interestingly, NRF-1 is significantly down-regulated in trisomic fetal hearts and fibroblasts, and 40% of the mitochondria-related genes down-regulated in DS hearts have consensus DNA binding sites for the nuclear respiratory factor NRF-1 (8) (30).
A
INTRODUCTION
8
Activation of the cAMP signaling pathway is a major mechanism underlying the induction of PGC-1α in several different cell types. In fact, the proximal promoter of PGC-1α contains a functional CREB binding site that is required for cAMP response (47). In this regard a decrease in PKA (protein kinase A) activity due to reduced basal levels of cAMP has been found in human fetal skin fibroblasts with trisomy 21 (48). Furthermore a decrease in basal levels of cAMP has also been reported in the hippocampus of the mouse model Ts65Dn, due to the altered basal activity of adenylate cyclase (49) (50). In addition PGC-1α expression and post-translational levels are regulated through sirtuin 1-dependent deacetylation (SIRT1) (51).
1.3.2 Which Hsa21 genes are candidate for mitochondrial dysfunction in Down syndrome?
A major task in the study of the molecular pathology of DS is to establish genotype-phenotype correlations, i.e. the identification of Hsa21 genes, or other genomic functional elements, that contribute to specific features of the DS phenotype. In this respect, many genes were identified as potential candidates in determining the mitochondrial dysfunction present in trisomic cells, as are discussed below.
NRIP1/RIP140
We have previously demonstrated that NRIP1 is a good Hsa21 candidate gene for the mitochondrial dysfunction observed in DS (52).
NRIP1 acts as a scaffold protein recruiting regulatory factors, such as histone deacetylases (53), COOH terminal binding protein (54) and histone metyltransferases (55), to exert its co-repressive function. NRIP1 is known to affect oxidative metabolism and mitochondrial biogenesis (56) (57) by negatively controlling the mitochondrial pathways regulated by
PGC-1α (58). Indeed, in Pgc-PGC-1α null mice (41) (59), as well as in knock-in Nrip1 mice (60),
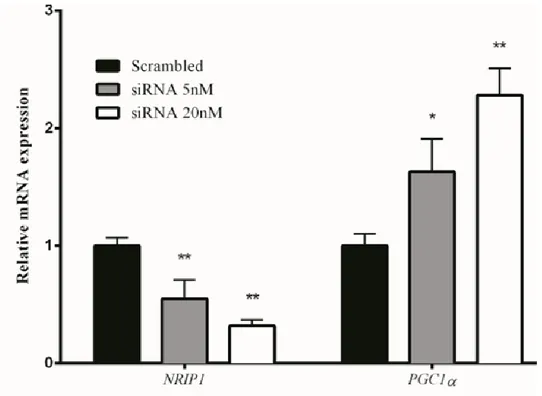
mitochondria-related gene expression decreased. NRIP1 transcript is up-regulated by 1.5-to 4-fold in trisomic fetal hearts (8) and fibroblasts (30). NRIP1 protein is increased in the hippocampal tissue from DS subjects (6). Interestingly, NRIP1 emerged as the main dysregulator of mitochondrial gene expression from the analysis of an experiment of modulation of Hsa21 genes (61) (52). To test the hypothesis that NRIP1 over-expression perturbs mitochondrial function, we silenced NRIP1 gene in trisomic human fibroblasts. We found an increase in the levels of PGC-1α (Figure 5) and mitochondria-related genes together with an improvement of mitochondrial function, demonstrated by the increase of ATP production and mitochondrial activity and by the decrease of the ROS production (52).
INTRODUCTION
9
Figure 5. NRIP1 silencing increases PGC-1α expression. NRIP1 and PGC-1α expression levels in trisomic
cells transfected with a scrambled siRNA and with a NRIP1-specific SMART pool of siRNAs. Values represent the average determination ± SEM for eight NRIP1-silenced DS-HFFs carried out in triplicate (52).
∗P < 0.05; ∗∗P < 0.01.
SUMO3
NRIP1 repressive activity is modulated by SUMOylation (62). SUMO3 is a gene mapping to chromosome 21 which is over-expressed in trisomic tissues due to gene dosage effect (6). The over-expression of SUMO3 might further increase NRIP1 repressive activity. SUMOylation also attenuates the transcriptional activity of PGC-1α, possibly by enhancing the interaction between PGC-1α and the co-repressor NRIP1 (63). Therefore SUMO3 over-expression in DS could contribute for a concurrent improvement of NRIP1 function and decrease of PGC-1α activity.
DSCR1/RCAN1 and DYRK1A
Two other genes mapping to chromosome 21, DSCR1/RCAN1 and DYRK1A, involved in the
calcineurin/NFAT pathway may affect DS mitochondrial phenotype. These two genes control
PGC-1α activity through the binding of NFATc genes to the PGC-1α promoter (64) (65). Accordingly, in DS fetal hearts and fibroblasts, it has been observed that whereas NFATc3 and NFATc4 were down-regulated, DYRK1A and RCAN1 were up-regulated (8) (30).
RCAN1 has been found chronically over-expressed in the brain of DS patients (66). It regulates mitochondrial function and increases susceptibility to oxidative stress in mammalian cells (67). RCAN1 over-expression is strictly related to calcium overloading, as it affects mitochondrial permeability transition pore leading to several consequences like swelling of mitochondria and rupture of the outer membrane (68). In agreement with these data,
mitochondrial Ca2+ concentration was found higher in fibroblasts from DS fetuses (30) and in
neutrophils derived from trisomic patients (69).
The over-expression of the brain-specific RCAN1.1S isoform in mice promotes dysregulation of dynamin-related protein 1 (DRP1) activity, a protein that promotes mitochondrial fission (70). Moreover, RCAN1 was found to induce mitochondrial autophagy in cardiomyocytes
INTRODUCTION
10
(71). In addition the over-expression of RCAN1.1S isoform remarkably up-regulated the expression of adenine nucleotide translocator (SLC25A4/ANT1) by stabilizing its mRNA (72).
PKNOX1/PREP1
The Hsa21 gene PKNOX1/PREP1 is an inhibitor of the oxidative phosphorylation that negatively regulates respiratory chain subunits and mitochondrial activity. PKNOX1/PREP1 gene codes for a homeodomain transcription factor which regulates multiple aspects of embryonic development through the homeobox protein Pbx activity (73). DS human fibroblasts, which show an increase of PREP1 expression, are more sensitive to genotoxic stress. Moreover, it has been demonstrated that PREP1 binds to the promoter region of genes encoding mitochondrial proteins and controls the stability of p160 Myb-Binding Protein, a powerful negative regulator of PGC-1α activity (74) (75). In the muscle of Prep1 ablated mice, Pgc-1α expression was increased with consequent increase in mitochondrial oxidative capacity together with an increase of expression of the mitochondrial fusion proteins Opa1 and Mfn2 (74).
1.3.3 Hsa21 genes affecting other mitochondrial related functions: oxidative stress and
mitochondrial death pathway SOD1
Overexpression of some of the genes present on chromosome 21 is responsible for the oxidative stress occurring in DS. One of the most probable inducer of oxidative stress is copper-zinc superoxide dismutase SOD1, a metalloenzyme catalyzing the conversion of superoxide anion to hydrogen peroxide (H2O2) (76). Levels of SOD1 in cells from DS
patients are about 50% higher vs euploid ones (77). APP
The amyloid β precursor protein APP, another gene consistently overexpressed in DS has been proposed to contribute to oxidative stress. Overexpression of APP induces mitochondrial oxidative stress and activates the intrinsic apoptotic cascade (78). In addition, amyloid-β fragments, particularly Aβ42, exert direct toxic effects in the cells, including mitochondrial dysfunction, induction of oxidative stress and Ca2+ dysregulation (79) (80). APP protein progressively accumulates in the mitochondrial matrix increasing free radicals and impairing mitochondrial metabolism (81).
S100B
This gene codes for the β subunit of S100 proteins, a large family of calcium-binding proteins. Elevated brain S100B expression occurs in various disease states, including DS and AD. In vitro studies of DS fetal human neural precursors demonstrated that S100B is constitutively over-expressed in these cells and that over-expression leads to increased ROS formation, activation of stress response kinases and increased programmed cell death (82).
ETS-2
Transgenic mice studies show that ETS-2 over-expression induces apoptosis of thymus, spleen, and brain cells (83). Furthermore ETS-2 promotes the activation of a mitochondrial death pathway in DS neurons and induces cytochrome c cytoplasmic translocation and apoptotic features in normal human cortical neurons (35).
ITSN1
ITSN1 is a Hsa21 gene encoding a multidomain scaffold protein that functions in endocytosis and regulates the mitochondrial apoptotic pathway in endothelial cells (84). ITSN1 expression is elevated in DS brain (85).
INTRODUCTION
11 1.3.4 Chromosome 21 miRNAs potentially involved in mitochondrial phenotype
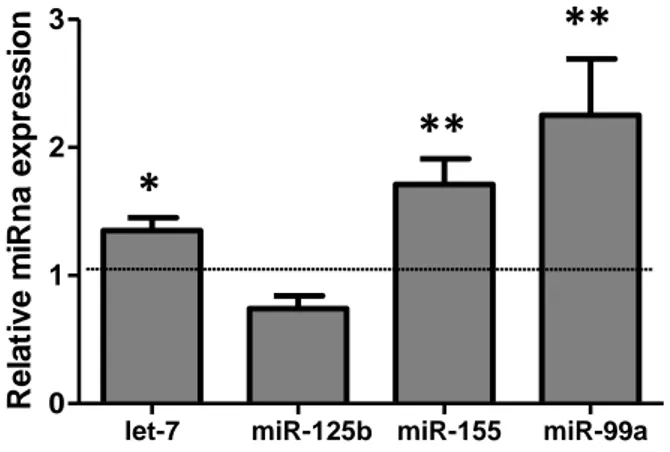
A recent annotation of miRNA database (miRBase, release 22) indicates that the Hsa21 harbors at least 30 miRNAs. Five of these miRNAs (let-7c-5p, 99a, 125b-2, miR-155 and miR-802) were initially identified. They were found over-expressed in DS human fetal brain and cardiac tissue (86) (87) (87). We determined the expression level of these miRNAs in the heart tissue from 6 DS fetuses at about 20 weeks of gestational age. We found
that let-7c-5p, miR-125b-2, miR-155-5p and miR-99a-5p were over-expressed in trisomic
hearts when compared with euploid controls (Figure 6). MiR802 was not expressed.
Figure 6. Chromosome 21 miRNA overexpressed in DS hearts. Hsa21 miRNA expression evaluated by
qRT-PCR in fetal hearts. Results are expressed as relative mean values ± SEM of 6 DS samples, compared with control hearts set equal to 1 (88).
∗P < 0.05; ∗∗P < 0.01.
We focused on the over-expressed Hsa21 miRNAs let-7c-5p, miR-155-5p and miR-99a-5p.
MiR-155-5p, a multifunctional microRNA, influences mitochondrial biogenesis by targeting TFAM (89), which is downregulated in trisomic hearts (as above described).
The overexpression of let-7c-5p in human induced neuronal cells as well as embryonic stem cells leads to morphological as well as functional deficits including impaired neuronal morphologic development, synapse formation, synaptic strength, and a marked reduction of neuronal excitability (90). Finally the forced expression of miR-99a-5p inhibits the feedback of AKT survival pathway and enhances the induction of apoptosis in cancer cells (91).
To investigate the role of these Hsa21 miRNAs, predicted targets from different databases were obtained and cross-validated using the gene expression profiling data set of human fetal hearts (88). For each miRNA, we compared predicted target genes, obtained by at least 2 different softwares, with the list of genes down-regulated in trisomic hearts. Eighty-five predicted target genes of let-7c, 33 of miR-155-5p, and 10 of miR-99a-5p were expressed in fetal heart and downregulated in trisomic hearts. Bioinformatics analysis indicated that let-7c has several predicted target genes that were down-regulated in trisomic fetal hearts and involved in mitochondrial function. The let-7c predicted target SLC25A4/ANT1, an ATP translocator, was identified among these genes and investigated during my PhD training (see Results).
1.4 Mitochondrial alterations might affect neuronal development and neurodegeneration in
Down syndrome
1.4.1 Mitochondria as major regulators of neuronal phenotype
As mitochondria are critical for energy production, calcium buffering, and cell survival pathways, it is not surprising that impaired mitochondrial activity might be linked to neuronal
let-7 miR-125b miR-155 miR-99a
0 1 2 3 Re la ti v e m iRn a e x p re s s io n
*
**
**
INTRODUCTION
12
dysfunction and neurological disorders (92) (93). The structure of the mitochondrial compartment is highly dynamic in neurons and there is a fine-tuned coupling between neuronal activity and mitochondrial function (94).
Mitochondrial dynamics plays an important role in neuronal function. It is essential for
neuronal processes such as synaptogenesis, Ca2+ buffering, axonal transport, and
bioenergetics (95). The neurons critically depend on mitochondrial function to establish membrane excitability and to execute the complex processes of neurotransmission and plasticity. Specifically, the neurons display a complex morphology, highly compartmentalized in long neuronal segments according to their cell type and brain region, thus demanding a proper mitochondrial trafficking network. Many neural developmental processes rely on mitochondrial regulation, including self-renewal and differentiation of neural stem cells, neurogenesis, axonal and dendritic growth, and synaptic formation and reorganization (94). Functionally and structurally damaged mitochondria do not synthesize sufficient ATP and are more prone to produce pro-apoptotic factors and ROS (96), which could represent an early step in the neurodegenerative process (97). Furthermore, alterations of mitochondrial dynamics are associated with neurodegenerative diseases such as Alzheimer’s (AD), Parkinson’s (PD) and Huntington’s diseases (97) (98) (99) (100) (101).
1.4.2 Mitochondria as major regulators of neuronal development and neurodegeneration in
Down syndrome
Although the phenotype of DS is complex, intellectual disability and an early development of AD neuropathology occur in almost all the individuals affected by DS (102). Increasing evidence suggests that mitochondrial dysfunction, consistently observed in DS, contributes to generating these phenotypic traits, as mitochondrial dynamics and metabolism play an important role in both fetal and adult neurogenesis (103), (104), (105).
Significant mitochondrial alterations have been well documented in DS fetal neurons showing an increase of ROS production, reduced membrane potential and increased fragmentation (34) (106) (107) (108). Evidence for mitochondrial damages was found also in the brain of the DS mouse model Ts1Cje (22) (109). Moreover, proteomic approach demonstrated a significant reduction of mitochondrial respiratory enzymes in different brain regions from DS patients (110).
Furthermore, Busciglio et al. (108) demonstrated that there is a marked alteration in AβPP processing and Aβ trafficking in cortical DS astrocytes and neurons. Development of the DS brain is associated with a decreased number of neurons, relative increase in the number of astrocytes and abnormal neuronal differentiation. The brain of DS fetuses show reduced weight (111) and a volume reduction was observed in various hippocampal structures (112) and in the cerebellum (113). Developmental defects in the dentate gyrus, altered dendritic spine morphology and reduced spine and synaptic density have also been described (114). These last features have been associated with the astrocyte-secreted thrombospondin 1, which is considered as a “spinotrophic” factor and is markedly reduced in DS astrocytes (115). In addition to developmental defects, the DS phenotype is characterized by early neurodegenerative processes including dementia and AD. Clinical signs of AD are manifested in 75% of DS individuals starting from 40 years of age (116). This has been correlated with the increased expression of the amyloid precursor protein.
However also other factors must be involved in the development of the symptoms of AD since a mouse model in which APP is not trisomic is affected as well by neurodegenerative disorders (109). It is known that the calcineurin-NFAT signaling pathway, in which the Hsa21 genes DYRK1A and RCAN1 are deeply involved, plays fundamental role in both neuronal development and degeneration. DYRK1A affects synaptic plasticity and memory consolidation. Its over-expression causes neurofibrillary degeneration and cell loss in the
INTRODUCTION
13
hippocampus area (117).
It is interesting to note that alterations of mitochondrial dynamics described in DS are very similar to those observed in neurodegenerative diseases (118) (97) (98) (99) (100) (101). By comparing the list of mitochondria related genes down-regulated in DS fetal hearts and the list of genes belonging to AD (KEGG pathway hsa05010) we found a significant overlap of 20 genes, most of them being target of the NRIP1/PGC-1α axis (52). This suggest that mitochondrial dysfunction might be a common denominator.
1.5 Mitochondria as potential therapeutic targets in Down syndrome
Targeting of signaling pathways which control mitochondrial functions represents a great opportunity for therapeutic approaches aimed at counteracting mitochondrial dysfunction in DS. In the last years we and other authors focused on several drugs and biological compounds, which have demonstrated favorable effects on the mitochondrial phenotype. Polyphenols
Epigallocatechin gallate (EGCG)
EGCG is a major flavonoid component of green tea. It inhibits cellular oxidation and prevents
free radical damage. It also is a DYRK1A inhibitor. EGCG stimulates mitochondrial biogenesis and promotes oxidative phosphorylation through a cAMP/PKA and sirtuin dependent mechanism (119) inducing the phosphorylation of complex I subunits and deacetylation of PGC-1α (120). It has been shown to be a multipotent therapeutic agent with beneficial neuroprotective effects (121). EGCG displays anti-apoptotic effects in many models of neurotoxicity (122). A therapeutic benefit on mitochondrial activity by EGCG has been demonstrated in cellular and DS murine model (119). Treatment with EGCG of neural progenitor cells, isolated from the hippocampus of Ts65Dn, reactivates mitochondria bioenergetics and biogenesis and promotes neural progenitor cell proliferation (46). On the other hand, in vivo studies demonstrated that EGCG counteract cognitive deficits in DS mouse models and in humans (123). Unfortunately even during this critical time window for hippocampal development, EGCG does not elicit enduring effects on the hippocampal physiology (124).
The prenatal EGCG treatment also demonstrated to improve craniofacial dysmorphology associated with DS in Ts65Dn embryos and mice. However, a long-lasting EGCG treatment at a lower dose (E0–E9) did not produce the same corrective effects failing to improve cognitive deficits. All these results suggest that timing and dosage of EGCG treatment are important and have to be optimized for DS patient treatment.
Resveratrol (RSV)
RSV is a stilbenoid, a type of natural phenol, found in red grape skin, blueberries and some other berries. RSV improves mitochondrial function and protects against oxidative stress by activating PGC-1α/SIRT1/AMPK axis (125) (46) (126). Recently it has been reported that RSV improves postnatal hippocampal neurogenesis and induces brain derived neurotrophic factor in prenatally stressed rat (127). Interestingly RSV also downregulates the miR-155 (128), which controls TFAM-regulated mitochondrial biogenesis.
A major pitfall in the treatment with polyphenols is represented by the absence of correlation between the dose of polyphenols and their bioavailability in the human body, due to their rapid metabolism and extensive modifications occurring during absorption. Moreover, the polyphenols are present at low concentrations in food with respect to their effective dose as therapeutic agents in humans (129).
INTRODUCTION
14
Antioxidants, CoQ10 and melatonin
Several clinical trials to test the effects of antioxidant nutrients or diets to scavenge oxygen-derived free radicals (130) (131) (132) (133) were performed in DS patients and DS mouse models.
A randomized, controlled trial of antioxidant supplementation (alpha-tocopherol, ascorbic acid and alpha-lipoic acid) showed neither an improvement in cognitive functions nor a stabilization of cognitive decline (130). To assess whether supplementation with antioxidants (selenium, zinc, vitamin A, vitamin E, and vitamin C) and folinic acid, or both, improves the psychomotor and language development of DS children, Ellis et al., (132) performed a randomized, controlled trial in 156 infants, below 7 months of age. Children receiving antioxidant supplements attained similar developmental outcome to the untreated controls. Therefore this study provided no evidence to support the use of antioxidant or folinic acid supplements in DS children.
In agreement with this study, vitamin E administration did not demonstrate to slow down the progression of cognitive deterioration in older individuals with DS (134).
Coenzyme Q10 (CoQ10), was discussed as possible therapeutic agent due to its ability to target mitochondrial dysfunction (131) (135). CoQ10 is a bioenergetic enzyme cofactor, central to mitochondrial OXPHOS apparatus, providing potent anti-oxidant protection; it is a potent ROS scavenger (136). CoQ10 supplementation to 10 DS patients for 3 months improves only oxidative imbalance (133).
Melatonin, a hormone involved in the regulation of sleep and wake cycles, was found to be low in the serum of DS children with respect to controls (137). Even though melatonin treatment attenuated the oxidative damage and cellular senescence in the brain (138), pre- and post-natal melatonin administration partially regulated brain oxidative stress but did not demonstrate to improve cognitive or histological alterations in the Ts65Dn mice (139).
Overall, randomized trials based on standard antioxidant supplements or diets failed to produce uniform therapeutic effects. These results suggest that antioxidant supplementation is safe but it neither improve the cognitive performance nor counteracts dementia in DS patients.
AIM OF THE STUDY
15
2. AIMS OF THE STUDY
The overall rationale behind this project is that manipulating the molecular mechanisms underlying mitochondrial dysfunction in DS could allow to develop successful strategies for preventing and/or treating DS phenotypic alterations.
The basic assumption is that the mitochondrial dysfunction observed in DS plays a role in determining some aspects of congenital DS phenotype, such as neuronal development defects, along with other disorders, such as neurodegeneration, observed in postnatal life. Counteracting mitochondrial dysfunction might therefore represent a worthwhile approach to treat this as yet incurable genetic disease improving the neurological phenotypes and preventing DS associated pathologies.
First step of this project was to characterize the bioenergetic profile of human trisomic fetal
fibroblasts (DS-HFFs) using the XFe-96 Extracellular Flux Analyzer (Seahorse Bioscience), a
very sensitive apparatus to study the mitochondrial respiration.
Based on the evidence that the dysregulation of a Hsa21 gene, the co-repressor NRIP1, plays a key role in DS mitochondrial dysfunction and that its activity is elicited by the inhibition of
PGC-1α, a gene that plays a central role in regulating the cell respiratory function.
We have designed therapeutic strategies aimed at repairing DS mitochondrial dysfunction by restoring PGC-1α activity. To meet this objective we planned to pharmacologically modulate
PGC-1α expression in DS-HFFs by using either metformin, a PGC-1α activator, or
pioglitazone, a PPAR-γ agonist. We evaluated the impact of both treatments on mitochondria-related genes expression and on mitochondrial function and network. A further objective of my study was to investigate new molecular mechanisms underlying mitochondrial anomaliesin targeting factors responsible for mitochondrial dysfunction in trisomic cells. We have investigated the role of overexpressed Hsa21 miRNAs. To this end SLC25A4/ANT1, a gene that encodes the adenine nucleotide translocator, which catalyzes the exchange of mitochondrial ATP for the cytosolic ADP, has been validated as target of the Hsa21 miRNA let-7c-5p.
The novelties of this study relies in: 1. the demonstration of anomalies in mitochondrial network and bioenergetic metabolism in trisomy 21 cells, and the identification of the molecular mechanism responsible for them; 2. the modulation of PGC-1α as a key factor in regulating structural and functional mitochondrial alterations in trisomic cells; 3. the demonstration that 2 drugs, already in use for different diseases, may counteract mitochondrial dysfunction in DS by affecting PGC-1α activity. If any of these drugs will demonstrate to be effective in counteracting DS features, it can be immediately introduced in human therapeutic protocols, maybe in association with specific therapies aimed at restoring the cognitive functions.
MATERIALS AND METHODS
16
3. MATERIALS AND METHODS
Ethics statementHFFs were obtained from the ‘Telethon Bank of Fetal Biological Samples’ at the University of Naples. All experimental protocols were approved by the local Institutional Ethics Committee.
Samples
Five skin biopsies explanted from human fetuses with trisomy of Hsa21 (DS-HFF) and four from euploid fetuses (N-HFF) after therapeutic abortion at 18-22 gestational weeks were used for this study. Fibroblasts from biopsies were cultured in T25 flasks (BD Falcon) with Chang medium B + C (Irvine Scientific) supplemented with 1% penicillin/streptomycin (Gibco) at 3° C in a 5% CO2 atmosphere; all analyses described throughout this study were carried out at
cell culture passages 4-5.
RNA extraction and quantitative RT-PCR
Total RNA from each sample was extracted using TRIzol reagent (Gibco/BRL Life Technologies, Inc., Gaithersburg, MD) and was reverse transcribed using the iScript cDNA Synthesis kit (BioRad Laboratories, Inc., Hercules, CA, USA). qRT-PCR was performed using SsoAdvanced universal SYBR Green supermix on a Bio-Rad iCycler CFX96 Touch Real-Time PCR Detection System according to the manufacturer’s protocols. Primer pairs (MWG Biotech, Ebersberg, Germany) were designed using the Primer 3 software (http://bioinfo.ut.ee/primer3-0.4.0/primer3; date last accessed 2015) to obtain amplicons ranging from 100 to 150 base pairs. In order to test primer efficiency, serial dilutions of cDNAs generated from selected samples, which expressed the target genes at a suitable level, were used to generate standard curves for each gene. qRT-PCR results are presented as relative mRNA levels normalized against reference control values. GAPDH or ABL housekeeping genes were chosen as reference genes.
For miRNA reverse transcription miScript II RT Kit (Qiagen) was used, and the mature miRNA let-7c-5p was quantified using miScript Primer Assay system and miScript SYBR Green PCR Kit (Qiagen). RNAUS and RNA5S were used as reference genes. For end point PCR, assays were performed using the PCR Master Mix (2X) Kit (ThermoFisher). Amplification products were visualized on 2% agarose gel and quantified using the Fiji software (http://www.fiji.sc) (140).
miRNA Mimic Transfection
For let-7c-5p up-regulation, a let-7c miRNA mimic (miScript miRNA Mimics, Qiagen) was transfected in 2 N-HFF lines. Cells were plated in a concentration of 70,000/well on 24 well plates (BD Falcon) and after 24 hrs were transfected with miRNA mimic using the INTERFERin transfection reagent (Polyplus-transfection). A fluorescent siRNA (AllStars Neg. siRNA AF 488, Qiagen) was used to monitor the efficiency of the chosen transfecting agent. Forty-eight hrs after the transfection cells were harvested and ANT1 and DICER expression were evaluated, cells treated with the INTERFERin transfection agent only were used as mock control for all experiments performed after transfection.
miRNA Inhibitor Transfection
For let-7c-5p down-regulation, an anti-hsa-let-7c miRNA (miScript miRNA Inhibitor, Qiagen) was transfected in 2 DS-HFF lines. Cells were plated in a concentration of 150,000/dish on 3.5 cm petri dishes (BD Falcon) and after 24 hrs were transfected with the inhibitor using the INTERFERin transfection reagent (Polyplus-transfection). Forty-eight hrs
MATERIALS AND METHODS
17
after transfection cells were harvested for RNA collection while 72 hrs after transfection protein lysates were obtained.
Western blotting
Cells were washed twice with ice-cold phosphate-buffered saline (PBS, Hyclone Lab. INC) and lysed in radio immunoprecipitation assay buffer (1% Triton; 0,5% sodium deoxycholate; 0,1% sodium dodecyl sulfate; 0.15 M NaCl; 0.05 tris-HCl pH7.2) or JS buffer (Hepes, pH 7.5,
50 mM, NaCl 150 mM, glycerol 1%, Triton X-100 1%, MgCl2 1.5 mM, EGTA 5 mM)
including protease inhibitor cocktail. Cell lysates were centrifuged at 10,000 g for 20 min at 4° C. Protein concentration was measured by the Lowry or Bradford procedure. Protein extracts were separated by SDS-PAGE and transferred onto nitrocellulose membranes. Membranes were incubated with specific primary antibodies: anti-SLC25A4/ANT1 mAb (ab 110322, Abcam), vinculin (N-19) (sc-7649, Santa Cruz), PGC1α (Calbiochem), anti-GAPDH (Cell Signaling), anti-luciferase (Invitrogen), anti-actin (Sigma), anti-MFN1 (Santa Cruz Biotechnology), anti-MFN2 (Santa Cruz Biotechnology), anti-OPA1 (Santa Cruz Biotechnology). Finally, primary antibodies were detected with the appropriate HRP conjugated secondary anti-bodies (Santa Cruz Biotechnology or GE-Healthcare) and revealed by chemiluminescence (Pierce) using digital imaging on a Bio-Rad ChemiDoc XRS apparatus or Fuji X-ray film.
Drug treatments
Metformin hydrochloride (Sigma-Aldrich) was dissolved in water to a stock solution of 100 mM and added to the cell growth medium at the final concentration of 0.05 mM or 0.5 mM. Fresh metformin solution was added every 24 hrs for 72 hrs. In control cells an equal volume of water was added.
Pioglitazone (Cayman Chemical) was dissolved in DMSO to a stock solution of 5 mM and added to the cell growth medium at the final concentration of 0.5 µM or 2 µM. Fresh pioglitazone solution was added every 24 hrs for 72 hrs. In control cells an equal volume of DMSO was added.
Mitochondrial bioenergetics measurements
Real-time measurements of oxygen consumption rate (OCR) were made using an XFe-96
Extracellular Flux Analyzer (Seahorse Bioscience, Billerica, MA, USA). Cells were plated in XFe-96 plates (Seahorse Bioscience) at the concentration of 25,000 cells/well. OCR was measured in XFe media (non-buffered DMEM medium containing 10 mM glucose, 2 mM L-glutamine and 1mM sodium pyruvate) under basal conditions and in response to 5lM Oligomycin, 1.5 µM of carbonyl cyanide-4 (trifluoromethoxy) phenylhydrazone (FCCP) and 1 µM of Antimycin-A and Rotenone (all from Sigma-Aldrich). The key parameters of mitochondrial function were measured. Each sample was plated at least in triplicate.
Luciferase measurements
The cells were plated on 13-mm diameter glass coverslips for single-sample luminescence measurements and allowed to grow to confluence. To measure total ATP content, the cells were infected with a VR1012-based construct encoding a mitochondrially targeted variant of the Photinuspyralis luciferase under the control of the CMV immediate early promoter (mtLuc). Cell luminescence was measured in a luminometer constantly perfused with a
modified Krebs-Ringer buffer containing: 125 mM NaCl, 5 mM KCl, 1 mM Na3PO4, 1 mM
MgSO4, 1 mM CaCl2 and 20 µM luciferin. The light output of a coverslip of infected cells
was in the range of 10,000–100,000 counts per second vs a background lower than 1000 counts per second.
MATERIALS AND METHODS
18
Measurements of mitochondrial potential
Mitochondrial potential was measured by loading cells with 10 nM
tetramethylrhodaminemethyl ester (TMRM; Life Technologies) for 20 min at 37° C, placed in a humidified chamber at 37° C and imaged with Nikon Swept Field Confocal microscope (Nikon Instruments Inc.) equipped with a CFI Plan Apo VC60XH objective and an Andor DU885 EM-CCD camera. TMRM excitation was performed at 560 nm and emission was collected through a 590 to 650 nm band-pass filter. TMRM fluorescence was analyzed using the NIS Elements software package (Nikon Instruments Inc.). FCCP (10 µM) was added after eight acquisitions to completely collapse the electrical gradient established by the respiratory chain in order to obtain the basal fluorescence values. Fluorescence intensity was measured in regions drawn around mitochondria and normalized respect to baseline fluorescence recorded after FCCP.
Mitochondrial morphology analysis
The cells were seeded at a density of 50,000 cells per well onto 25-mm glass coverslips, allowed to grow for 24 hrs and then infected with mitochondria-targeted GFP inserted into an adenoviral vector (Ad-mtGFP Ex/Em: 495/515). Protein expression was then allowed for 72 hrs in the presence or absence of metformin. The efficiency of infection was comparable in non-trisomic and trisomic cells both in terms of percentage of GFP positive cells (about 80%) and of intensity of fluorescent GFP signal. Coverslips were placed in an incubated chamber
with controlled temperature, CO2 and humidity. Single cells were imaged, by using the same
settings for non-trisomic and trisomic cells, with a Nikon Swept Field Confocal microscope (Nikon Instruments Inc.) equipped with a CFI Plan Apo VC60XH objective and an Andor DU885 EM-CCD camera, which was controlled by NIS Elements 3.2. Fifty-one-plane z-stacks were acquired with voxel dimensions of 133 x 133 x 200 nm (X x Y x Z). The mitochondrial network was then described in numbers of objects, total volume and object volume using the 3D object counter available in the software Fiji (http://www.fiji.sc; date last accessed 2015) (140) while 3D rendering was obtained with the 3D Viewer plugin.
Electron microscopy analysis
Cells were fixed in 1% glutaraldehyde dissolved in 0.2 M HEPES buffer (pH 7.4) for 30 min
at room temperature and then post-fixed with a mixture of 2% OsO4 and 100 mM phosphate
buffer (pH 6.8) (1 part 2% OsO4 plus 1 part 100 mM phosphate buffer) for 25-30 min on ice.
Next, the cells were washed three times with water and incubated with 1% thiocarbohydrizide
diluted in H2O for 5 min. Finally, the cells were incubated in a mixture of 2% OsO4 and 3%
potassium ferrocyanide (1 part 2% OsO4 plus 1 part 3% potassium ferrocyanide) for 25 min
on ice and overnight at 4° C in 0.5% uranyl acetate diluted in H2O. After dehydration in a
graded series of ethanol, the cells were embedded in epoxy resin and polymerized at 60° C for 72 hrs. Thin 60-nm sections were cut with a Leica EM UC7 microtome. EM images were acquired from thin sections using an FEI Tecnai-12 electron microscope equipped with a VELETTA CCD digital camera (FEI, Eindhoven, The Netherlands). The EM analysis was carried out on two euploids and three trisomic cell lines under control conditions and after metformin treatment. The number of damaged mitochondria including any type of ultrastructural changes (partially or completely damaged mitochondria, reduced cristae, broken, shorter or high swollen cristae, giant mitochondria) was calculated as the % of total mitochondria (n > 60 per cell line). Similarly, the number of giant mitochondria were counted and expressed as the % of total mitochondria (n > 60 per cell line). The maximal width of cristae was quantified using the ImageJ software line tool (National Institutes of Health, Bethesda, MD, USA) following a previous protocol (141). A line was drawn across the opening between membranes, not including membrane density. Mitochondria were analysed
MATERIALS AND METHODS
19
using the same magnification within a 25 µm square field of view. The width was calculated by averaging the width of 2-4 measurable cristae for each mitochondrion, then averaging the mean value obtained for all mitochondria (n > 20) in each sample and in each condition (untreated and treated).
Statistical procedures
Unless otherwise indicated, all assays were performed independently and in duplicate. Statistical analysis was performed using GraphPad Prism software vers.5.0 (GraphPad Software, La Jolla California USA, http://www.graphpad.com; date last accessed 2010). The ANOVA test, with Bonferroni post hoc correction in case of multiple comparisons, was applied to evaluate the statistical significance of differences measured throughout the data sets presented. The threshold for statistical significance (p-value) was set at 0.05.
RESULTS
20
4.
RESULTS
4.1 The whole energy status of trisomic cells is significantly impaired
- Respiratory activity in trisomic cells
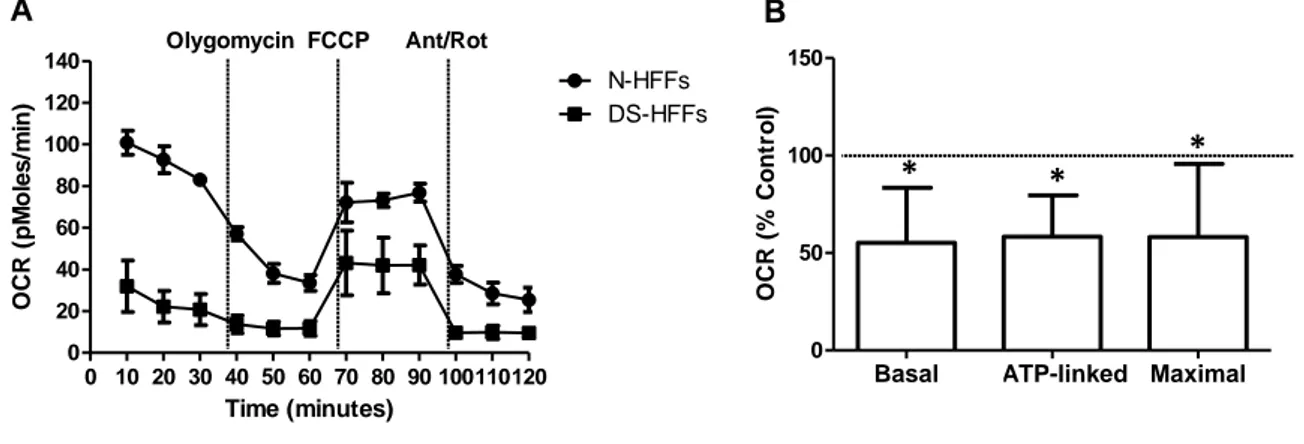
Previous studies in our lab indicated that trisomic cells, along with a decrease of mitochondrial gene expression, exhibit a deficit in cellular energy production (30). For a better characterization of mitochondrial metabolism, mitochondrial respiration was investigated in trisomic human fetal fibroblasts (DS-HFFs) versus euploid ones (N-HFFs) by determining directly their bioenergetic profile (118). Overall the indices of mitochondrial respiratory functions were drastically reduced by about half in trisomic cells when compared with euploid ones. Basal OCR, ATP-linked respiration, and maximal respiration were assessed using the XFe-96 Extracellular Flux Analyzer (Seahorse Bioscience) (Figure 8A). The comparison showed that Basal OCR was reduced by 55% in DS-HFFs (Figure 8B,
“Basal”). The OCR related to ATP production was decreased in DS-HFFs by 58% (Figure 8B, “ATP-linked”). The maximal respiratory capacity, (Figure 8B, “Maximal”) was also
reduced by 58% in trisomic cells.
Figure 8. DS-HFFs manifest a reduced respiratory activity.(A) Representative curves of OCR in N-HFFs and
DS-HFFs cells (single cell culture in triplicate) obtained in basal condition and after consecutive addition of Oligomycin 5 µM, FCCP 1.5 µM and Antimycin-A/Rotenon 1 µM (Ant/Rot) (left panel). (B) The bars show the mean values of three respiratory parameters (basal OCR, ATP-linked and Maximal OCR) ± SEM of four DS cell samples compared with four N-HFFs (set equal to 100).
∗P < 0.05.
Basal ATP-linked Maximal
0 50 100 150 OCR (% Co n tr o l) 0 10 20 30 40 50 60 70 80 90 100110120 0 20 40 60 80 100 120 140 N-HFFs DS-HFFs Time (minutes) OCR ( p M o le s /m in ) Olygomycin FCCP Ant/Rot A B * * *
RESULTS
21
- ATP basal level in trisomic cells
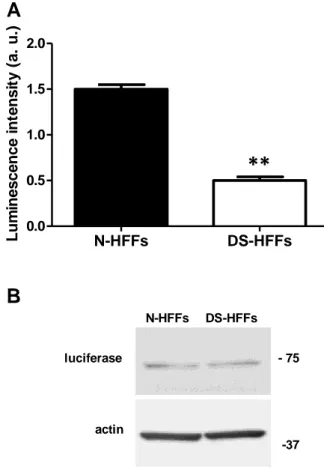
In addition to the indirect measure of ATP OCR-related the measurement of the basal cellular ATP levels was carried also using a chimera of the ATP sensitive photoprotein luciferase, as previously described (52) (118). This analysis revealed that the rate of basal ATP content was significantly lower in trisomic cells when compared with euploid ones (Figure 9A). This is consistent with the findings from the respiratory assay where OCR related to ATP production was indeed decreased. Considering that basal ATP content is dependent on the amount of transfected luciferase, we determined by western blot analysis that the levels of luciferase protein expressed in DS-HFFs were comparable with those detected in euploid cells (Figure
9B).
Figure 9. The amount of ATP content is decreased in DS-HFFs. (A) Basal ATP in DS-HFFs versus N-HFFs,
measured by a luciferase probe. The bars show the mean values ± SEM of a comparative analysis between three euploid and three trisomic samples. (B) Representative immunoblot of luciferase protein in N-HFFs and DS-HFFs transfected with a luciferase probe and cultured in complete medium for 72 hrs. Actin was used as loading control.
∗∗P < 0.01; a.u.: arbitrary units.
N-HFFs DS-HFFs 0.0 0.5 1.0 1.5 2.0 L u m in e s c e n c e i n te n s it y ( a . u .)
A
luciferase - 75 actin -37 N-HFFs DS-HFFsB
**
RESULTS
22
- Mitochondrial membrane potential in trisomic cells
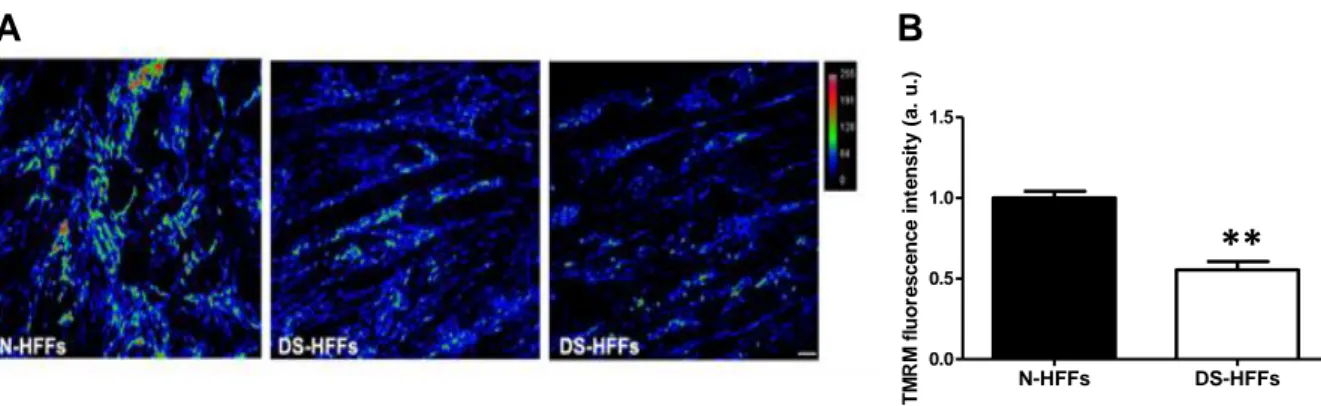
To further analyze the energetic status of DS-HFFs, the mitochondrial membrane potential was determined by confocal microscopy using the specific mitotropic probe tetramethylrhodamine methylester (TMRM), a red fluorescent dye sensitive to membrane potential changes (118). Fluorescence intensity was measured and normalized to basal fluorescence intensity levels obtained exposing cells to FCCP (see also Materials and Methods). Using this methodological approach, DS-HFFs showed a significant 50% decrease in TMRM fluorescence intensity when compared with N-HFFs (Figure 10A-B).
Figure 10. DS-HFFs show a significant decrease in TMRM fluorescence. (A) Representative confocal
microscopy live cell imaging of TMRM fluorescence before FCCP in N-HFFs and DS-HFFs. (B) The bars show relative mean values ± SEM of fluorescence intensity per cell in four trisomic cell lines compared with four non-trisomic ones (set equal to 1). Fifty randomly selected cells for each sample/experimental condition were analyzed.
∗∗P < 0.01; a.u.: arbitrary units.
N-HFFs DS-HFFs 0.0 0.5 1.0 1.5 T M RM f lu o re s c e n c e i n te n s it y ( a . u .) B A
**
RESULTS
23 4.2 Trisomic cells exhibit abnormalities in mitochondrial architecture
- Ultrastructure of mitochondria in trisomic cells
Altered mitochondrial function is often associated with abnormalities in mitochondrial structure we performed morphological analysis of mitochondria in trisomic fibroblasts versus
euploid unraveling mitochondrial alterations and remodeling of mitochondrial membrane
structures (118).
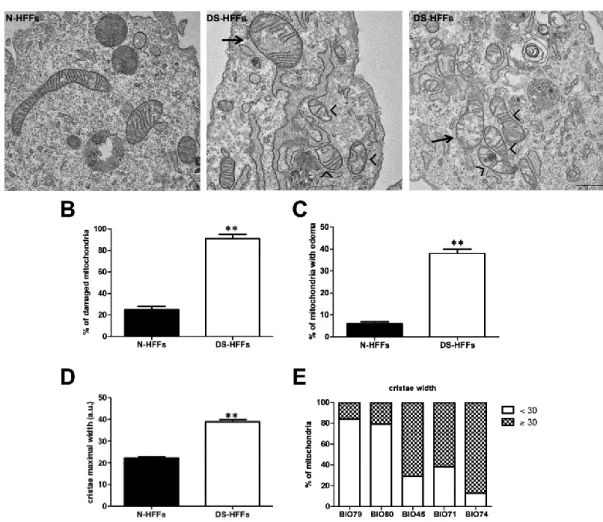
Mitochondria of DS-HFFs exhibited short and/or damaged cristae (Figure 11A, arrow heads), and some of them appeared with an enlarged size and swelling (Figure 11A, arrows). The number of damaged mitochondria in DS-HFFs was 3,5 fold higher when compared with N-HFFs (90% in DS-N-HFFs vs 25% in N-N-HFFs) (Figure 11B) and 40% of DS-N-HFFs mitochondria displayed intra-edema with respect to 6% in non-trisomic cells (Figure 11C). Since cristae shape determines the assembly and stability of respiratory chain complexes and hence mitochondrial respiratory efficiency (142, 143), we evaluated the maximal width of cristae (141). In DS-HFFs the mitochondrial membranes appeared more widely spaced when compared with euploid cells where they were closely juxtaposed at the level of the cristae
(Figure 11A). In detail trisomic cells showed mitochondria with significantly wider cristae
(2-fold) vs non-trisomic cells (Figure 11D). Furthermore, whereas in N-HFFs only 15% of mitochondria exhibited swollen cristae (mean maximal width > 30 a.u.), in DS-HFFs about 60-90% of mitochondria showed this characteristic (Figure 11E).
RESULTS
24
Figure 11. Mitochondria of DS-HFFs show morphological abnormalities. (A) Representative ultrastructural
images of N-HFFs vs DS-HFFs. The arrow heads indicate damaged mitochondria. (B) The percentage of damaged mitochondria in trisomic cells compared with non-trisomic cells and (C) the percentage of mitochondria with intra-edema. The bars show mean values ± SEM of two non-trisomic cells and three trisomic lines; n > 80 per cell line. (D) Mean cristae maximal width in N-HFFs versus DS-HFFs (see Methods). (E) The percentage of mitochondria with enlarged cristae (> 30 a.u.) in DS-HFFs in comparison with N-HFFs. In D and E the bars show mean values ± SEM of two euploid and three trisomic ones; n > 20 per sample. Scale bar 1 µm. ∗∗P < 0.01; a.u.: arbitrary units.
RESULTS
25 4.3 Mitochondrial network and fission-fusion machinery genes in trisomic cells
Studies on the correlation between the modulation of the energetic state of the cell and mitochondrial shape and network (143) (144) have demonstrated that mitochondria can switch from an elongated and interconnected network to a fragmented state via fusion and fission events during the so-called ‘mitochondrial life cycle’ (145). We examined the overall organization of the mitochondrial network at the confocal microscope by looking at the distribution of a green fluorescent protein targeted to mitochondria (mtGFP) (118) in order to investigate the fission-fusion phenotype in trisomic fibroblasts.
DS-HFFs appeared fragmented with many small and short mitochondria when compared with N-HFF mitochondrial network which exhibited a branched, tubular morphology (Figure
12A). The mitochondrial number was higher in DS-HFFs (Figure 12B), whereas their
average volume was significantly decreased (Figure 12D). Total mitochondrial volume was not significantly changed (Figure 12C).
Figure 12. DS-HFFs mitochondrial network is highly fragmented (A) Representative images showing the
mitochondrial network in N-HFFs versus DS-HFFs. (B) The number of mitochondria, (C) the total volume and
(D) the mitochondrial volume were compared in trisomic vs non trisomic cells. The bars show mean values ±
SEM of two euploid and five trisomic cell cultures. Fifty randomly selected cells for each sample/experimental condition were analyzed.
∗P < 0.05; ∗∗P < 0.01.
To understand the molecular bases of the differences in mitochondrial network organization between trisomic and non-trisomic cells, we focused on some proteins involved in mitochondrial fission-fusion machinery that play a role in the organization of mitochondrial network (118). We determined mRNA and protein levels of OPA1, MFN1 and MFN2 in trisomic and non trisomic cells. We found that OPA1 and MFN2 mRNA and protein expression was significantly reduced in DS-HFFs vs N-HFFs (Figure 13). This correlates well with the extensive fragmentation of mitochondria observed in trisomic cells (Figure 12).
RESULTS
26
Figure 13. Mitochondrial fusion gene expression is diminished in DS-HFFs. (A) OPA1, MFN1 and MFN2
mRNA expression measured by qRT-PCR upon normalization to a reference gene (ABL). (B) Representative immunoblotting of OPA1, MFN1 and MFN2 and densitometric analysis of three different experiments are shown. GAPDH was measured as a loading control. (C) The bars show the relative mean values ± SEM of three DS cell cultures compared with N-HFFs (set equal to 1).
∗P < 0.05; ∗∗P < 0.01.
4.4 Metformin and pioglitazione activate PGC-1α in trisomic cells
We tested the hypothesis that the induction of the PGC-1α, might restore the mitochondrial activity in trisomic cells. Among the drugs which demonstrated to affect PGC-1α activity we chose the biguanide, metformin (MTF) and a tiaziolinedione, namely pioglitazone (PG). We treated DS-HFFs with these two drugs. MTF stimulates PGC-1α through AMPK and SIRT1 activity and PG is a PPARγ agonist. To determine the effects of drug administration on the PGC-1α signaling pathway, based on literature data (146) and unreported preliminary experiments, we exposed DS-HFFs to different concentrations of the drugs for 72 hrs. For MTF 0.05 and 0.5 mM concentrations were chosen.
Trisomic fibroblasts treated with MTF for 72 hrs showed a significant increase in PGC-1α expression, at both the mRNA (Figure 14A) and protein level (Figure 14B-C), when compared with untreated control cells. To understand if MTF activated the PGC-1α signaling pathway, we measured the mRNA levels of two transcription factors dependent upon PGC-1α activity: NRF-1 and TFAM, which are both downregulated in trisomic cells (30). Furthermore NRF-1 is induced by PGC-1α in a dose dependent way (147) while TFAM is positively regulated by NRF-1 expression (40) and plays a central role in expression, maintenance, and organization of the mitochondrial genome (148).
MTF at both concentrations induced an increase of both NRF-1 and TFAM mRNA expression in DS-HFFs (Figure 14E). Also the amount of mtDNA, measured as the ratio of
D-LOOP/ACTIN mRNA expression, was found increased in trisomic cells after MTF treatment (Figure 14F). A B OPA1 MFN1 MFN2 0.0 0.5 1.0 1.5 Re la ti v e m RN A e x p re s s io n OPA1 MFN1 MFN2 0.0 0.5 1.0 1.5 Re la ti v e p ro te in e x p re s s io n * ** * * C