Katia Giusepponi
Ernesto Tavoletti
Virginia Tosi
TOP STARTUPS
WORLDWIDE
An investigation
on entrepreneurial
and organisational profiles
Research into entrepreneurial factors of success and failure continuously im-proves through observing and studying new players in the business world.
This work focuses on top startups in the world and seeks to understand their current habitat, what they excel in, and also the challenges awaiting them.
Based on technology and knowledge, the high-value startups analysed here capture and facilitate global tendencies, leveraging interconnectivity and sharing.
They create strengths from the worldwide ecosystems in which they are im-mersed and which give them easier access to resources but the organisational profiles often represent contexts of weakness and fundamental challenge.
The main contribution of this work is to show the positive effects of plurality. In particular this concerns the number of founders, attitudes to participation, and a sense of belonging and cooperation; and from an external perspective, factors such as the attitude towards collaboration and the ability to make use of fertile ecosystems, or to understand and interpret global trends.
Moreover, an effort to link strategic, organizational and social profiles has been made, creating a model for understanding entrepreneurship which will also be useful for comparing future evidence.
Katia Giusepponi, is an Associate Professor of Business Economics at the University of Macerata. She received her degree in Economics and Business (cum laude) at the University of Ancona and her PhD in Business Economics at the University of Pisa. Her main areas of research concern entrepreneurship, corporate strategy, business analytics and sustainability reporting. She has worked in several multi-competence teams, supporting them within strategic planning and control processes.
Ernesto Tavoletti, is an Associate Professor of Management, International Marketing and International Business Strategy at the University of Macerata. He received a degree in Economics and Commerce (cum laude) at the University of Bologna and a PhD in Economics and Management of Enterprises and Local Systems at the University of Firenze. His research interests focus on internatio-nal business, innovation management and higher education management.
Virginia Tosi, received her degree in Business Management and Consulting (cum laude) and her PhD in Economics and Management at the University of Macerata. She is a business consultant with particular focus on business plan-ning, corporate finance, mergers and acquisitions. Furthermore, she teaches in training courses for entrepreneurs and professionals.
This volume is published in open access format, i.e. the file of the entire work can be freely downloaded from the FrancoAngeli Open Access platform (http://bit.ly/francoangeli-oa).
On the FrancoAngeli Open Access platform, it is possible to publish articles and monographs, according to ethical and quality standards while ensuring open access to the content itself. It guarantees the preservation in the major international OA archives and repositories. Through the integration with its entire catalog of publications and series, FrancoAngeli also maximizes visibility, user accessibility and impact for the author.
Read more:
http://www.francoangeli.it/come_pubblicare/pubblicare_19.asp
Readers who wish to find out about the books and periodicals published by us can visit our website www.francoangeli.it and subscribe to our “Informatemi”
COPY 15,5X23 1-02-2016 8:56 Pagina 1
Katia Giusepponi
Ernesto Tavoletti
Virginia Tosi
TOP STARTUPS
WORLDWIDE
An investigation
on entrepreneurial
Open access funded by the University of Macerata ‒ Department of
Education, Cultural Heritage and Tourism.
Copyright © 2019 by FrancoAngeli s.r.l., Milano, Italy.
This work, and each part thereof, is protected by copyright law and is published in this digital version under the license Creative Commons Attribution-NonCommercial-NoDerivatives 4.0 International
(CC BY-NC-ND 4.0)
By downloading this work, the User accepts all the conditions of the license agreement for the work as stated and set out on the website
Contents
Introduction pag. 7
1. Theoretical framework (Katia Giusepponi and
Ernesto Tavoletti) » 9
2. Methodology (Katia Giusepponi and Virginia Tosi) » 15
3. Results and discussion (Katia Giusepponi) » 19
3.1. Entrepreneur profiles and strategic perspective » 19
3.2. Organisational profiles » 22
3.3. Attraction of critical factors and value » 25
3.4. Markets, ecosystems and value » 32
4. Conclusions (Katia Giusepponi and Virginia Tosi) » 39 »
Appendix 1 – Startups considered » 41
Appendix 2 – Checklist » 42
References » 43
Other sources » 49
Tables and graphs ‒ List » 51
Introduction
Research into entrepreneurial factors of success and failure con-tinuously improves through observing and studying new players in the business world.
This work focuses on top startups in the world and seeks to under-stand their current habitat, what they excel in, and also the challenges awaiting them.
Based on technology and knowledge, the high-value startups ana-lysed here capture and facilitate global tendencies, leveraging inter-connectivity and sharing.
They create strengths from the worldwide ecosystems in which they are immersed and which give them easier access to resources but the organisational profiles often represent contexts of weakness and fundamental challenge.
The main contribution of this work is to show the positive effects of plurality. In particular this concerns the number of founders, atti-tudes to participation, and a sense of belonging and cooperation; and from an external perspective, factors such as the attitude towards col-laboration and the ability to make use of fertile ecosystems, or to un-derstand and interpret global trends.
Moreover, an effort to link strategic, organizational and social profiles has been made, creating a model for understanding entre-preneurship which will also be useful for comparing future evidence.
1. Theoretical framework
Katia Giusepponi and Ernesto TavolettiA startup or new venture is generally understood as a nascent en-terprise with a relatively innovative focus but often lacking a proper business model. Understanding the critical success factors of growth is relevant in order to provide recommendations and guidelines to new entrepreneurs.
The literature on the critical success factors for their growth is ex-tensive (Plummer et al. 2016) and access to financial capital is one of the main factors (Gilbert et al. 2006). As capital investors look for “signals” that demonstrate the quality of a new venture’s unobserva-ble resources and capabilities, the following signals play the role of second order critical success factors: 1) “third-party signalling”, such as a certifying institution, a respected intermediary or any other pres-tigious third party that the investors assume to be better informed than them about the startup potential (Pollock & Gulati 2007); 2) af-filiation to a prominent venture development organization (VDO) (Chen et al. 2008) that will provide networking and help it to suc-ceed; 3) firm’s human and social capital (Beckman et al. 2007); 4) managerial experience of the founding team (Stuart & Abetti 1990).
Plummer et al. (2016) provide evidence that the managerial expe-rience of the founder will increase the probability a new venture re-ceives external capital only when the new venture also has a VDO affiliation. Founding team’s educational heterogeneity and prior founding experience have a positive and significant effect on the likelihood of a firm’s creating breakthrough innovation but the rela-tionship depends on the firm’s stage of life (Tzabbar & Margolis 2017).
Rasmussen et al. (2012) investigate number and mindset of founders, growth, and networks in five categories of Danish interna-tional new ventures and show that the more internainterna-tional the typolo-gy of venture, the higher the percentage of firms with more than one founder: 36% of the born local firms; 45% of the born international sourcers; 66% of the born international sellers; 59% of the born Eu-ropean firms; 68% of the born global firms.
A recent and comprehensive systematic literature review on the critical success factors of startups (Santisteban & Mauricio 2017) identify 16 relevant articles about the “experience in the industry of the founding team”, 13 about “previous experience startup of the founding team”, 13 about the number of founders, 12 about the “ex-perience in management of the entrepreneur”, 11 about the “academ-ic formation of the founding team”, 6 about “Government support”, 4 about “Technological/business capabilities of the founding team”, 2 about “Leadership of the entrepreneur”, 2 about “Initial motivation of the entrepreneur” and just 1 about “gender of the entrepreneur” and other issues. The 13 articles about the number of founders reveal what follows.
Starting from the observation that the survival rate after five years of new technology ventures (NTVs) in the United States is just 21.9%, Song et al. (2007) conducted a meta-analysis to analyze the findings of 31 studies and identified the 24 most widely researched success factors for NTVs; after correcting for artifacts and sample size effects, they found that among the 24 possible success factors identified in the literature, 8 are homogeneous significant success factors for NTVs (they have a positive significant effect on venture performance): 1) supply chain integration; 2) market scope; 3) firm age; 4) size of founding team; 5) financial resources; 6) founders’ marketing experience; 7) founders’ industry experience; and 8) exist-ence of patent protection. The remaining 11 success factors were not significant or heterogeneous and include: founders’ research and de-velopment (R&D) experience; founders’ experience with startups; environmental dynamism; environmental heterogeneity; and compe-tition intensity. The study does not identify any optimal size of the founding team but assesses that size has a positive effect on venture performance.
Ganotakis (2012), for the case of UK new technology based firms (NTBFs), claims that individual entrepreneurs or entrepreneurial teams with high levels of formal business education, commercial, managerial, or same sector experience create better performing NTBFs, and the performance of a NTBF can improve through the combination of heterogeneous but complementary skills, including, for example, technical education and commercial experience or man-agerial technical and manman-agerial commercial experience. Therefore founding team size improves performance when it provides comple-mentary variety (Ganotakis 2012).
Baptista et al. 2007 examine whether founders’ backgrounds in-fluence new firm survival in the early years after start-up and find that specific human capital more frequently found in spin-off found-ers plays a key role in enhancing survival chances, while more gen-eral forms of human capital may help inexperienced entrepreneurs overcome the barrier posed by the critical early years after start-up. In that context, they consider the impact of the existence of at least one partner in ownership: the result is that the presence of a partner increases the chances of survival.
Colombo et al. (2004) consider a sample of 391 young Italian firms operating in high-tech industries in both manufacturing and services. A result is that the specific component of human capital as-sociated with industry-specific professional knowledge and manage-rial and entrepreneumanage-rial experiences is found to have a greater posi-tive impact on initial firm size than the generic component, proxied by education and general working experience.
Gottschalk & Niefert (2013) focus on gender differences in busi-ness success of German start-up firms and their point of departure is that in many studies women-owned firms underperform when com-paring performance indicators at an aggregate level. They analyze whether gender differences in observable characteristics like educa-tion, experience, team size, entrepreneurial motivation and industry choice explain differences in performance and how large the impact is. The result is that female-founded firms perform worse for all indi-cators. At the same time, there are significant gender differences in many of the characteristics observed: compared to male entrepre-neurs, female entrepreneurs have a lower level of formal education, less professional experience, are part of smaller start-up teams, are
more often driven by necessity, and are overrepresented in the retail and service industries and in lower-tech industries in general. There-fore, their results support that smaller start-up firms tend to underper-form (Gottschalk & Niefert 2013) and, having women-owned firms smaller start-up teams, they underperform as a consequence. This is in line with previous research that reveal that size does matter for growth (Becchetti & Trovato 2002).
Analyzing 44 venture capital backed companies over a period of up to 12 years, Strehle, Katzy, & Davila (2010) confirm that partner-ing is positively associated to growth.Cannone & Ughetto (2014), in the context of startups internationalization, find that the diversity of team competences and organizational flexibility of a firm, have a significant impact on a born global's degree of born-globalness, alt-hough it is not a fundamental precondition for early internationalization.
On the opposite side, the findings of Dautzenberg & Reger (2009), based on a sample of 1,834 new German firms in high-technology sectors, disclose that team heterogeneity in terms of gen-der, size and educational level has little impact on firm success. However, the field of entrepreneurship involves both opportunities and individuals (Shane and Venkatraman 2000).
Numerous studies have tried to identify the factors in startup suc-cess and failure. These elements are unquestionably numerous, var-ied and interconnected; and include:
founder characteristics and abilities (Brockhaus 1980; Sexton and Upton 1985; Chandler and Jansen 1992; Begley 1995; Gatewood et al. 1995; Reuber and Fisher 1999; Baum and Locke 2004; Lazear 2004; Rauch and Frese 2007; Zhao et al. 2009);
social and human capital (Cooper et al. 1994; Peña 2002; Da-vidsson and Honig 2003; Bosma et al. 2004; Witt 2004; Brixy and Hessels 2010; Unger et al. 2011);
venture capital (Wasserman 2008; Davila et al. 2003; Bertoni et al. 2011; Nanda and Rhodes-Kropf 2013);
business model “as a mediating construct between technology and economic value” (Chesbrough and Rosenbloom 2002; McGrath 2010);
market opportunities (Venkataraman 1997; Shepherd and Lévesque 2002); and
macroeconomic and socio-cultural environment (Tiessen 1997; Hopp and Stephan 2012; Mthanti and Ojah 2017).
These factors need to be combined synergistically in order to launch a business which does not fail at the first experiment but which can develop and consolidate (Song et al. 2008).
Certainly, the characteristics of an entrepreneur, his / her strategic vision, leadership and ability to understand the situation all play a fundamental role in enabling and managing a virtuous mix of these elements, that is an “entrepreneurial success formula”.
In other words, it is true that in a startup, as in any organisation, the life cycle is deeply affected by both internal and external factors, but the entrepreneurial characteristics, skills and, in particular learn-ing ability, are central (Carter et al. 1996; Gartner et al. 1999; Minniti and Bygrave 2001; Cope 2003; Haber and Reichel 2007; Rauch and Frese 2007; Marmer et al. 2011; Ries 2011; Åstebro et al. 2014).
The keys on which our study is focused and which form the major part of our contribution are:
the entrepreneurial attitude to divergent interpretations, useful for finding concrete solutions to important widespread needs, and the ability to understand and enter people’s daily lives at a global
level, to come up with diverse, seemingly-simple solutions, while continuously learning and adapting.
Disruptive innovation – a phenomenon which breaks existing norms and frameworks by introducing new habits and a new equilib-rium – uses technology as a vital tool (Schumpeter 1934; Christensen 1997; Christensen et al. 2006, 2015, 2016; Wan et al. 2015; Hamari et al. 2016), but it is the ability to observe, understand and compare that leads to useful solutions for people and to efficient business models.
Competitiveness, effective strategic direction, market incisiveness and presence in an opportunity-rich ecosystem are traits which char-acterise a successful startup. Instead, weaknesses can be seen in the
organisational perspective which however represent an area of fun-damental challenge (Duchesneau and Gartner 1990; Brush et al. 2001; Ensley et al. 2006).
Consequently, a startup emerges as a team creation, which per-haps attains its critical maturity factor when it is aware of the im-portance of plurality and its ethical value.
2. Methodology
Katia Giusepponi and Virginia Tosi
This work aims to understand and interpret entrepreneurship and success factors of high-value startups worldwide on the basis of the theoretical framework illustrated below. This work aims to under-stand and interpret entrepreneurship and success factors of high-value startups worldwide on the basis of the theoretical framework illustrated above. In order to allow this understanding, the work analyses various aspects of high-value startups, particularly focusing on:
attitudes to entrepreneurship, specifically relating to the capacities for:
strategic orientation; context interpretation;
attracting critical resources (talent, knowledge, technologies,
financing);
employee engagement; and leadership;
markets in which these startups operate, their targets and the needs they meet and sometimes even create.
As seen above, there are extensive and in-depth studies on enter-prise creation and launch. Research into entrepreneurial factors of success and failure continuously improves through observing and studying new players in the business world.
Table 1 – Investigated connections
Source: own analysis and elaboration. age number of co-founders gender entrepreneur profiles entrepreneurial perspective socio-economic perspective conditions of achievement and acceleration strategic perspective ability to attract critical factors /value organisational profiles location ecosystem
needs and markets
price, place, promotion innovation focus RQ1B RQ1C RQ1A RQ2B RQ2A RQ3C RQ3B RQ3A R Q 3 E R Q 3 D RQ4B RQ4A R Q 2 C
The work focuses on top startups in the world: that is, enterprises which are often the catalysts for new trends and accelerators of pro-gress. In particular, this work seeks to understand their current habi-tat, what they excel in, and also the challenges awaiting them. The main contribution emerging from these research findings concerns the positive effects arising from plurality, understood as internal de-bate, openness to participation and networking.
Moreover, an effort to link strategic, organizational and social profiles has been made, creating a model for understanding entrepre-neurship which will also be useful for comparing future evidence.
The startups considered are listed in the Dow Jones Venture Source and The Wall Street Journal “venture-backed private compa-nies valued at $1 billion or more”. This list is available at The Billion
Dollar Startup Club (Austin, Canipe and Slobin) and was accessed
for this research in May 2017. As mentioned in this source, the list only concerns privately held companies that have raised funding in the past four years and with at least one venture-capital firm among the investors.
In particular this research considers the 109 startups valued at 1.1 billion dollars or more (see appendix 1). Information on these busi-nesses was acquired online based on the checklist included in appen-dix 2. Macro items studied are shown in table 1.
The analysis involves not only several objective elements – such as number, age and gender of founders, number of rounds of funding, latest evaluation, valuation to funding ratio – but also evaluation sub-jectively but not arbitrarily attributed to relevant profiles – such as effectiveness of vision and mission, level of the shared vision, sense of belonging and level of internal cooperation. A 1 to 5 rating scale was used, with 0 = highly negative, 1 = widely negative, 2 = slightly negative, 3 = slightly positive, 4 = widely positive and 5 = highly positive. Furthermore, on a subjective basis, opposite elements of specific factors were compared, with the total score of 5 split be-tween them. These factors are: transformational versus transactional leadership; participative versus authoritative decision-making; level of external collaboration versus competitiveness.
Data was collected and profiles evaluated based on online infor-mation and resources: primarily, the websites of companies, and sub-sequently the Dow Jones Venture Source and The Wall Street Journal,
LinkedIn, Glassdoor, Crunchbase Pro, Bloomberg, AngelList, Quora (to name just a few).
After the theoretical framework and these methodology notes, the third section of the work concerns the presentation and discussion on the results of the investigation (organised in sub-sections: entre-preneur profiles and strategic perspective; organisational profiles; at-traction of critical factors and value; markets and ecosystems); and the fourth section contains the conclusions.
3. Results and discussion
Katia Giusepponi3.1. Entrepreneur profiles and strategic perspective
Founders of high-value startups in the world are often solo (just one founder is the norm) and male (the mean of women co-founders is just 0.10, the norm is 0). The average age at startup foundation is 32.78, the median 31.5; the standard deviation, equal to 8.06, allows us to define the relevant range from 24.72 to 40.84 years (table 2).
High-value startups in the world show, on average, effective stra-tegic statements. Within the studied cases, a significant focus on the vision (average effectiveness 3.36, mode 5) and, in particular, on the mission (average effectiveness 3.93, mode 5; see table 3) can be ob-served.
Table 2 – Entrepreneur profiles
Company founded in Age (2017): average Age (at foundation): average Number of co-founders Number of men Number of women Valid elements 103 103 107 107 107 Not available 6 6 2 2 2 Total cases 109 109 109 109 109 MEAN 2008 41.3 32.78 2.19 2.08 0.10 MEDIAN 2009 40 31,5 2 2 0 MODE 2009 33 41 1 1 0 STANDARD DEVI-ATION σ 4.28 7.94 8.06 1.37 1.35 0.33 MIN 1995 28 19 1 0 0 MAX 2015 68 61 9 9 2 SUM 234 223 11 100.00% 95.30% 4.70%
Table 3 – Strategic perspective context interpretation and vision strategic orientation and mission evidence y=1; n=0 level of shared vision (1-5)* effectiveness (1-5)* evidence y=1; n=0 effectiveness (1-5)* Valid elements 109 104 104 109 104 Not available 0 5 5 0 5 Total cases 109 109 109 109 109 MEAN 3.14 3.39 3.93 MEDIAN 1 3 4 1 4 MODE 1 3 5 1 5 STANDARD DEVI-ATION σ 1.31 1.60 0.99 MIN 0 1 0 0 1 MAX 1 5 5 1 5
(*): 0 = highly negative, 1 = widely negative, 2 = slightly negative, 3 = slightly positive, 4= widely positive and 5 = highly positive.
Sources for the tables 2-13 and the graphs 1-4: own analysis, evaluation and elaboration based on online information and resources (primarily, the websites of companies, and subsequently the Dow Jones Ven-ture Source and The Wall Street Journal, LinkedIn, Glassdoor, Crunchbase Pro, Bloomberg, AngelList, Quora).
Furthermore, specific questions were defined regarding connections between entrepreneur profiles and strategic perspective (in particular, effectiveness of vision and mission, and level of shared vision):
Rq1a. Does a relevant correlation exist between the average age
of co-founders and strategic perspective (effectiveness of vision and mission and level of shared vision)?
Rq1b. Does a relevant correlation exist between the number of
co-founders and strategic perspective?
Rq1c. Does a relevant correlation exist between the number of
women co-founders and strategic perspective?
First of all, gender appears as relevant not only in order to pro-mote the effectiveness of strategic statements, but also in sharing vi-sion. In fact, on the basis of the Pearson coefficient, a positive corre-lation was noticed between the number of women co-founders and: the effectiveness of vision and mission (both with ρ equal to 0.20); the level of shared vision (ρ equal to 0.22).
Table 4 – Pearson correlation coefficient (ρ) averag e ag e at st art up
foundation number of
co-founders
number of women
co-founders level of shar
ed vision
effe
ctiveness of vision
effe
ctiveness of mission
value valuation to funding organizational cultur
e (sense of b elonging and level of coope ration) responsibilities (vs skills) tran sf or ma tiona l ( vs transactional) le ader -ship partic ipa tive ( vs a
u-thoritative) decision- making level of co
llabor ation vs co mpe titive ne ss
average age at startup
foundation 1 -0.06 0.03 0.01 -0.02 0.09 -0.05 -0.04 0 -0.06 0 0.05 -0.06
number of co-founders -0.06 1 0.18* 0.18* 0.06 -0.01 0.21** 0.13 0.25*** -0.09 -0.13 0.12 0.13
number of women
co-founders 0.03 0.18* 1 0.22** 0.20** 0.20** -0.06 0.01 0.15 0.1 0.02 -0.06 -0.01
level of shared vision 0.01 0.18* 0.22** 1 0.70*** 0.54*** 0.11 0.02 0.37*** 0.14 -0.16* 0.18* -0.16*
effectiveness of vision -0.02 0.06 0.20** 0.70*** 1 0.46*** -0.01 -0.11 0.19* 0 -0.24*** -0.01 -0.26*** effectiveness of mis-sion 0.09 -0.01 0.20** 0.54*** 0.46*** 1 -0.1 -0.08 0.16* 0 -0.05 0.01 -0.08 value -0.05 0.21** -0.06 0.11 -0.01 -0.1 1 0.30*** 0.07 -0.13 -0.04 0.1 0.17* valuation to funding -0.04 0.13 0.01 0.02 -0.11 -0.08 0.30*** 1 0.17* -0.02 0.20** 0.28** 0.07 organisational culture (sense of belonging and level of coopera-tion) 0 0.25*** 0.15 0.37*** 0.19* 0.16* 0.07 0.17* 1 -0.02 0.36*** 0.59*** 0.28*** responsibilities (vs skills) -0.06 -0.09 0.1 0.14 0 0 -0.13 -0.02 -0.02 1 0.03 0.03 -0.1 transformational (vs transactional) leader-ship 0 -0.13 0.02 -0.16* -0.24*** -0.05 -0.04 0.20** 0.36*** 0.03 1 0.61*** 0.44*** participative (vs authoritative) decision-making 0.05 0.12 -0.06 0.18* -0.01 0.01 0.1 0.28** 0.59*** 0.03 0.61*** 1 0.34***
level of external col-laboration vs competi-tiveness
-0.06 0.13 -0.01 -0.16* -0.26*** -0.08 0.17* 0.07 0.28*** -0.1 0.44*** 0.34*** 1
Significance: * P<0.10; ** P<0.05; *** P<0.01
Sources for the tables 2-13 and the graphs 1-4: own analysis, evaluation and elaboration based on online information and resources (primarily, the websites of companies, and subsequently the Dow Jones Ven-ture Source and The Wall Street Journal, LinkedIn, Glassdoor, Crunchbase Pro, Bloomberg, AngelList, Quora).
Nevertheless, only 11 female co-founders emerge (out of 234). Just one is a solo entrepreneur; there is in effect a positive, moderate link between the number of women and the total number of co-founders (ρ= 0.18).
The findings also show a positive relationship between the num-ber of co-founders and the level of shared vision (ρ= 0.18). It must be
observed that relationship is particularly significant in Europe (ρ= 0.40) and Asia (ρ= 0.33), while almost negligible in the USA (ρ= 0.08) where, however, the level of shared vision is higher than the general average (3.27 versus 3.14).
Having more than one founder appears as a favourable factor also at the level of organizational culture (see section 3.2) and value (see section 3.3).
To summarise, factors such as gender and plurality, which influ-ence internal debate and interaction, reveal a positive relationship with the level of shared vision. Gender is also linked to the effective-ness of vision and mission.
Instead, no significant correlation emerges with respect to the age of founders (table 4).
3.2. Organisational profiles
High-value startups worldwide do not represent, on average, ex-cellent organisational profiles. In particular, findings show key indi-cators with a negative or not fully positive value (table 5), regarding: a sense of belonging and level of internal cooperation, evaluated
within this study as slightly positive (on average 2.88 out of 5); responsibility elements of the leadership model which emerge as
weak in comparison with skills elements (2.04 vs 2.96);
transformational leadership which is clearly negligible in com-parison with transactional leadership (1.87 vs 3.13);
participative decision-making, which is marginal compared to au-thoritative decision-making (1.82 vs 3.18);
attitude to external collaboration which is almost ignored com-pared to competitiveness (1.18 vs 3.82).
Table 5 – Organisational profiles
Organizational culture
Sense of belonging (1-5)* Level of cooperation (1-5)* Mean
Valid elements 102 102 102 Not available 7 7 7 Total cases 109 109 109 MEAN 2.89 2.87 2.88 MEDIAN 3 3 3 MODE 3 3 2,5 STANDARD DEVIATION σ 1.10 0.94 0,92 MIN 1 1 1 MAX 5 5 5
Responsibilities vs skills, total 5 Transformational vs transactional leadership, total 5
Responsibilities Skills Transformational leadership Transactional leadership
Valid elements 103 103 103 103 Not available 6 6 6 6 Total cases 109 109 109 109 MEAN 2.04 2.96 1.87 3.13 MEDIAN 2 3 2 3 MODE 2 3 2 3 STANDARD DEVIATION σ 0.68 0.68 1.09 1.09 MIN 1 1 0 0.5 MAX 4 4 4.5 5
Employee engagement: participative vs authoritative decision-making,
total 5
Relationship model: level of collaboration vs competitiveness, total 5
Participative Authoritative Collaboration Competitiveness
Valid elements 103 103 106 106 Not available 6 6 3 3 Total cases 109 109 109 109 MEAN 1.82 3.18 1.18 3.82 MEDIAN 1.5 3.5 1 4 MODE 1 4 1 4 STANDARD DEVIATION σ 0.96 0.96 0.66 0.66 MIN 0 1 0 1,5 MAX 4 5 3.5 5
(*): 0 = highly negative, 1 = widely negative, 2 = slightly negative, 3 = slightly positive, = widely positive and 5 = highly positive.
Sources for the tables 2-13 and the graphs 1-4: own analysis, evaluation and elaboration based on online information and resources (primarily, the websites of companies, and subsequently the Dow Jones Ven-ture Source and The Wall Street Journal, LinkedIn, Glassdoor, Crunchbase Pro, Bloomberg, AngelList, Quora).
Research questions were defined regarding connections between organizational and entrepreneurial profiles on the one hand; and stra-tegic perspective on the other:
Rq2a. Is there a relevant correlation between number of co-founders
and organisational profiles (culture, responsibilities, transformational leadership, participative decision-making, external collaboration)?
Rq2b. Is there a relevant correlation between number of women
co-founders and organisational profiles?
Rq2c. Is there a relevant correlation between strategic perspective
and organisational profiles?
A positive connection emerges between the number of co-founders and organisational culture which is synthesised as the mean between sense of belonging and internal cooperation (ρ= 0.25, see table 4). It must be observed that this connection is significant in Asia (ρ= 0.35) and the USA (ρ= 0.22), while negligible in Europe (ρ= 0.06) where, however, the level of organisational culture is high-er than the genhigh-eral avhigh-erage (3.21 vhigh-ersus 2.88).
Furthermore, the Pearson coefficient shows a positive correlation between the effectiveness of vision (ρ= 0.19) and mission (ρ= 0.16) and the organizational culture. Similarly, there is a positive correla-tion of the level of shared vision with the organisacorrela-tional culture (ρ= 0.37) and with participative decision-making (ρ= 0.18), but not with transformational leadership (negative ρ equal to -0.16) nor with atti-tude to external collaboration (ρ= -0.16).
A negative correlation emerges also between the effectiveness of vision and both transformational (versus transactional) leadership (ρ= -0.24) and level of collaboration versus competitiveness (ρ= -0.26).
To sum up, it can be seen that effective vision stating and sharing are coherent with a sense of belonging, internal cooperation and par-ticipative style, but at the same time opposite to a transformational or-ganization and to forms of external collaboration or coo-petition. This would be not surprising in the initial phases of a business when the focus is mainly on competitiveness and market acquisition, but nonetheless it could entail a risk of using sharing and participation in a limited way and perhaps in name only. No other significant correla-tion emerges in this field, on the basis of the Pearson coefficient.
3.3. Attraction of critical factors and value
The enterprises studied stand out for the capacities to find and vir-tuously combine critical resources in terms of people, knowledge and, in particular, technology. More specifically, it can be noticed that the business model of analysed startups focus on knowledge dissemination and technological potential as tools to connect people worldwide and to contribute to a better life. The mean values of knowledge and tech-nology (respectively 4.25 and 4.45) are remarkably high. Moreover the relatively low standard deviation values (respectively 0.90 and 0.74) show the compactness of this synthesis indicator (table 6).
Table 6 – Ability to attract critical factors /Value
People (1-5)* Knowledge (1-5)* Technologies (1-5)* Financial re-sources: total equity funding (billion dollars, when applicable) Financial re-sources: latest valuation (billion dollars, when applicable) Valuation to funding Rounds of funding (current) Valid ele-ments 105 108 107 108 109 108 107 Not available 4 1 2 1 0 1 2 Total cases 109 109 109 109 109 109 109 MEAN 3.66 4.25 4.45 0.91 5.09 6.99 5.27 MEDIAN 4 5 5 0.37 2 5.34 5 MODE 5 5 5 1.4 1,1 12 5 STANDARD DEVIATION σ 1.14 0.90 0.74 1.87 9.68 6.56 2.36 MIN 1 2 2 0.10 1.1 0.73 1 MAX 5 5 5 14.1 68 12
(*): 0 = highly negative, 1 = widely negative, 2 = slightly negative, 3 = slightly positive, 4 = widely positive and 5 = highly positive.
The technological DNA is the core characteristic of the enterprises studied and is often presented and interpreted as a promise of a new life. Within website content, news, and interviews with founders, ref-erences to people are present but decisively less central.
Given the selection criteria of the sample discussed in this work, the businesses studied also stand out for their ability to attract financing. The mean of the latest valuation is 5.09 billion dollars, but the variability is very high (σ= 9.68). Several enterprises in the sample rank at the lowest level (mode of 1.1 billion and median of 2 billion) but five startups are valued at more than 20 billion dollars. Within this group Uber is valued at 68 billion. The ratio of valuation to
fund-ing, in particular, shows the value leverage, that is, the ability to gen-erate value. The average is 6.99 but the variability is high (σ=6.56; min 0.73; max 57.33).
In the face of such important capacities to attract financing, re-search questions arise concerning the connection of value with other analysis items (entrepreneur profiles, strategic perspective and organ-izational profiles):
Rq3a. Is there a relevant correlation between founder age and
value (as a signifier of the ability to attract financial resources)?
Rq3b. Is there a relevant correlation between number of
co-founders and value?
Rq3c. Is there a relevant correlation between number of women
co-founders and value?
Rq3d. Is there a relevant correlation between strategic
perspec-tive and value?
Rq3e. Is there a relevant correlation between organisational
pro-files and value?
A positive correlation can be noticed between the latest valuation and:
number of co-founders (ρ= 0.21); furthermore, in this respect there are significant differences concerning geographical location; in fact while there is a strong positive correlation for Chinese (ρ= 0.72) and Indian (ρ= 0.75) startups, there is a negative correlation in other Asian areas (ρ= -0.68) and there is no correlation within startups in the USA (ρ= 0.04);
level of collaboration (moderate, ρ= 0,17) very positively significant for Europe (0.82) and China (0.60) and but not for India (ρ= -0.63) and other Asian areas (ρ= -0.20), nor for the USA (0.06); total equity funding (obviously very strong; ρ= 0.83) but with
sig-nificant differences within geographical areas (China 0.74; India 0.95; Asia others 0.54; Europe 0.39 and USA 0.93); these differ-ences express a more or less strict link which startups have with financial markets (table 7 and graph 1).
Contrariwise, no significant correlation emerges between value and: founder age, number of women co-founders, effectiveness of strategic statements, organisational profiles apart from external collaboration.
Table 7 – Pearson correlation coefficient between value and other items
General
(all studied high-value startups)
China India Others° Asia Europe USA
Pearson coefficient value-number of co-founders 0.21 0.72 0.75 -0.68 0.12 0.04 Pearson coefficient value-external col-laboration 0.17 0.60 -0.63 -0.20 0.82 0.06 Pearson value-equity funding 0.83 0.74 0.95 0.54 0.39 0.93
° Israel, Singapore, South Korea
Graph 1 – Pearson correlation coefficient between value and other items
Sources for the tables 2-13 and the graphs 1-4: own analysis, evaluation and elaboration based on online information and resources (primarily, the websites of companies, and subsequently the Dow Jones Venture Source and The Wall Street Journal, LinkedIn, Glassdoor, Crunchbase Pro, Bloomberg, AngelList, Quora).
-0,8 -0,6 -0,4 -0,2 0,0 0,2 0,4 0,6 0,8 1,0China India Asia Others Europe Usa Number of co-founders Equity founding External collaboration
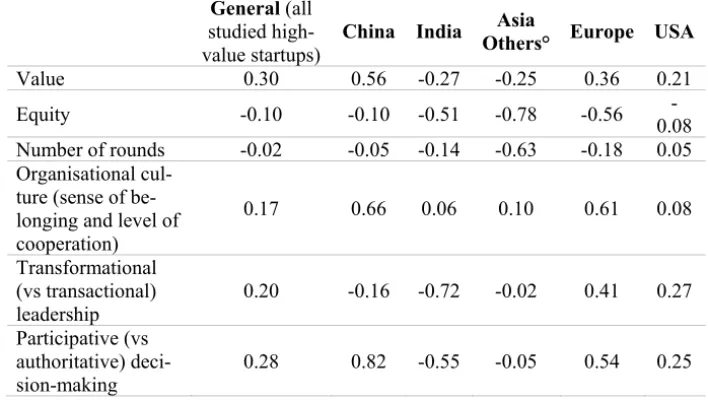
It is also interesting to split at a territorial level the significant cor-relations between valuation to funding (attraction lever for invest-ments) and some other factors (table 8 and graph 2). From this, the following points can be observed:
a strong correlation between valuation to funding and organiza-tional culture in China and Europe;
a relevant correlation between valuation to funding and trans-formational leadership in Europe and the USA (but the opposite in India);
a relevant correlation between valuation to funding and participa-tive decision-making in China, Europe and the USA (but the op-posite in India).
To sum up, the attraction lever for investments is sensitive to the organizational elements mentioned above, particularly in Europe, then in China and the USA. Instead, Indian high-value startups show opposite connections: between the attraction lever and both transac-tional leadership and authoritative decision-making, while other Asian high-value startups (not Chinese or Indian) do not show any significant correlation in this sphere.
The correlation between the valuation to funding ratio and equity is basically negative and shows an attraction lever for investments which is stronger in the initial phases of the business and weaker in the following phases. This is coherent with the basically negative connection between the same ratio and the number of funding rounds. However, this connection is significant for India, Asia Others and Europe but not for China or for the USA (table 8).
On the basis of the Pearson coefficient, organisational profiles are not correlated with value (interpreted here as latest valuation), while they are significantly correlated with the valuation to funding as at-traction lever for capital.
However, it must be observed that this territorial analysis can pro-vide only some initial elements which are useful for planning further, more extensive studies, since the 109 high-value startups are uneven-ly spread over geographical areas, concentrated in the USA (62% of elements) but much less present in other countries.
Table 8 – Pearson correlation coefficient between valuation to funding and other items
General (all
studied high-value startups)
China India Others° Asia Europe USA
Value 0.30 0.56 -0.27 -0.25 0.36 0.21
Equity -0.10 -0.10 -0.51 -0.78 -0.56 0.08
-Number of rounds -0.02 -0.05 -0.14 -0.63 -0.18 0.05
Organisational cul-ture (sense of be-longing and level of cooperation) 0.17 0.66 0.06 0.10 0.61 0.08 Transformational (vs transactional) leadership 0.20 -0.16 -0.72 -0.02 0.41 0.27 Participative (vs authoritative) deci-sion-making 0.28 0.82 -0.55 -0.05 0.54 0.25
° Israel, Singapore, South Korea
Graph 2 – Pearson correlation coefficient between valuation to funding and other items
Sources for the tables 2-13 and the graphs 1-4: own analysis, evaluation and elaboration based on online information and resources (primarily, the websites of companies, and subsequently the Dow Jones Venture Source and The Wall Street Journal, LinkedIn, Glassdoor, Crunchbase Pro, Bloomberg, AngelList, Quora).
-0,8 -0,6 -0,4 -0,2 0 0,2 0,4 0,6 0,8 1China India Asia Others Europe USA
organisational culture (sense of belonging and level of cooperation) transformational (vs transactional) leadership
On the basis of the Pearson coefficient, organisational profiles are not correlated with value (interpreted here as latest valuation), while they are significantly correlated with the valuation to funding as at-traction lever for capital.
However, it must be observed that this territorial analysis can pro-vide only some initial elements which are useful for planning further, more extensive studies, since the 109 high-value startups are uneven-ly spread over geographical areas, concentrated in the USA (62% of elements) but much less present in other countries.
In general, the above indicated frame shows:
as regard to absolute value (as latest valuation), the relation with: • internal plurality (number of founders) [H1];
• external plurality (collaboration) [H2];
regarding the valuation to funding ratio (as attraction lever for in-vestments), the relation with:
• organisational culture [H3]; • transformational leadership [H4]; • participative decision-making [H5].
Based on the linear regression analysis and F test, the hypothesis H1 and H5 can be accepted with α lower than 0.05 while the hypoth-esis H2 and H3 with α lower than 0.10. Instead the hypothhypoth-esis H4 cannot be accepted (table 9).
However, the above indicated links are in general not sufficient to explain changes in value.
Furthermore, it has to be considered that on the economic value definition there are undoubtedly external factors linked on the one hand to market and competition, and on the other to the geographic ecosystem and its technological and financial dynamic. Therefore other questions arise:
Rq4a. Is there a concentration of the startup value in certain
mar-kets?
Rq4b. Is there a concentration of the startup value in certain
To answer, we have to consider the socio-economic and the eco-system perspective, based on the following data (subsection 3.4.). Table 9 – Regression Analysis
Value – Number of founders
Hypothetical function Value = 1.69904797 + 1.501717379 number of founders
R2 = 0.04506707; F = 4.955366179; Critical F-value 3.931556186 (α = 0.05); 2.753924929 (α = 0.10)
The H1 hypothesis of influence and causality can be accepted. Value – Level of the external collaboration (vs competitiveness)
Hypothetical function Value = 2.07606907 + 2.584356001 level of the external
col-laboration
R2 = 0.03032159; F = 3.252052804; Critical F-value 3.93243761 (α = 0.05); 2.75439642 (α = 0.10)
The H2 hypothesis of influence and causality can be accepted with α equal to 0.075. Valuation to funding – Organisational culture
Hypothetical function Valuation to funding = 3.620970059 + 1.224415685 level of
organisational culture
R2 = 0.028387545; F = 2.892477255; Critical F-value 3.93711671 (α = 0.05); 2.75689879 (α = 0.10)
The H3 hypothesis of influence and causality can be accepted with α equal to 0.093. Valuation to funding – Transformational (vs transactional) leadership
Hypothetical functionValuation to funding = 5.685352686 - 0.316325079 level of
transformational leadership
R2 = 0.00140602; F = 0.149247985; Critical F-value 3.930691675 (α = 0.05); 2.753462449 (α = 0.10)
The H4 hypothesis of influence and causality cannot be accepted.
Valuation to funding – Participative (vs authoritative) decision-making
Hypothetical functionValuation to funding = 3.541269045 + 1.969153148 level of
participative decision-making
R2 = 0.079420027; F = 8.627172989; Critical F-value 3.936142779 (α = 0.05); 2.756378019 (α = 0.10)
The H5 hypothesis of influence and causality can be accepted.
Sources for the tables 2-13 and the graphs 1-4: own analysis, evaluation and elaboration based on online information and resources (primarily, the websites of companies, and subsequently the Dow Jones Ven-ture Source and The Wall Street Journal, LinkedIn, Glassdoor, Crunchbase Pro, Bloomberg, AngelList, Quora).
3.4. Markets, ecosystems and value
The findings reveal important details regarding not only an entre-preneurial perspective (strategic orientation, leadership and relation-ship models), but also a socio-economic perspective, as they show global tendencies which are at the heart of their existence and which, in turn, are strengthened and amplified through them.
An example would be the presence of startups in the sharing economy, and more specifically the positive loop linking companies like Uber and Airbnb to current sharing tendencies and behaviours. Table 10 – Price, place, promotion and innovation focus: summary
The ability to understand and give voice to socio-economic devel-opments and strategic-entrepreneurial attitudes permits speed of ac-cess to resources and services, determining the sucac-cess of these busi-nesses and providing new energy to the tendencies indicated above.
Innovation focused on technology Price in general, affordable, competitive Promotion / A big “promise”: simplify connections and processes to enable a better life Place online, first of all
Often the steps to a startup’s success arise from: careful observation of people’s daily habits;
analysis of the processes they follow to satisfy recurring needs; simplification and standardisation of these processes; and accessibility via mobile devices.
In effect, from a wider point of view, the different types of promo-tion carried out by the startups studied for this research are generally based on a big “promise”: to simplify connections and processes to enable wider knowledge, new networking and sharing opportunities, and thus a better life (table 10).
Price – when clearly stated on the startup website – appears af-fordable and competitive compared with offline solutions. Place, as far as startups are concerned, is the web. The contrast between ra-pidity and inclusiveness of the online world, on the one hand, and the slowness and limitations of the offline world, on the other, is the first key to understanding the success of the high-value startups in this re-search.
Thus, from a general perspective, it is not surprising that these startups show an innovation strategy focused on technology and it must be considered that technological change fuels important op-portunities and challenges at the same time (Selvam and Kal-yanasundaram 2015; Startup Genome 2017:9; Iansiti and Lakhan 2017).
With particular reference to the Rq4a, it can be seen that there is a concentration of the value and number of top startups in specific markets. In fact, the Gini coefficient, being equal to 0.71, shows a high concentration of value (graph 3).
The focus on technology is evident and the sectors which predom-inantly absorb value are: mobility/transport; IT/Q2C (Quote to Cash), hosting, security; financial services; O2O (Online to Offline); big data analysis; health control (table 11).
These markets in particular reflect tendencies towards the sharing economy and networking; simplification and rapid accessibility to goods and services, global interconnectedness and wider knowledge; lifestyle and health care.
Table 11 – Socio-economic perspective / Needs and markets
Needs and markets (number) Startups Valuation (total) Valuation (average)
Mobility/transport 8 167.6 20.95
IT/Q2C, hosting, security 18 103.6 5.76
O2O 20 78.4 3.92
Financial services 11 47.6 4.33
Big data analysis 8 31.2 3.9
Health control 10 26.8 2.68
Collaborative workspaces 1 17.2 17.2
Aerospace 2 14.5 7.25
Insurance 2 10.7 5.35
Free music /premium 1 8.5 8.5
HR services 3 6.9 2.3 Knowledge sharing 3 4.8 1.6 Sport tv 1 3.4 3.4 Ticket purchase 2 3.2 1.6 Electronic signature 1 3 3 Energy 1 2.9 2.9
Social media and
network-ing 2 2.9 1.45 Gaming/fantasy 2 2.8 1.4 Software 2 2.6 1.3 Mobile advertising 1 2.5 2.5 Home design 1 2.3 2.3 Real estate 2 2.2 1.1 Autonomous mobility / driverless cars 1 1.6 1.6 Sensing solutions 1 1.6 1.6 Chatting 1 1.4 1.4 Travel 1 1.4 1.4
Cars / connecting buyers
and sellers 1 1.2 1.2
Eyeglasses 1 1.2 1.2
Dynamic glass 1 1.1 1.1
General 109 555.1 5.09
It must also be noted that top startups worldwide also illustrate how innovation becomes reality such as in the case of autonomous mobility.
This discussion concerns not only big business, but also the posi-tive conditions of achievement and acceleration and the fundamental role of hubs and ecosystems which facilitate:
diffusion of knowledge and greater awareness regarding oppor-tunities and resources, and
the emergence of startups (Startup Genome 2017:9).
With particular reference to Rq4b, it can be seen that there is a concentration of the value and number of top startups in specific lo-cations (tables 12 and 13). The Gini coefficient, equal to 0.72, clearly shows the high concentration of value (graph 4).
This means that an ecosystem – that is, a virtuous system of fa-vourable conditions in terms of talent, technology, knowledge and financial resources – is crucial in order to allow a successful business startup (Koltai with Muspratt 2016).
It is not a coincidence that many founders of these startups have studied and obtained their degrees at American universities such as Stanford and MIT, at the same time immersed in and part of im-portant ecosystems.
Graph 3 – Concentration of the value of
startups: by sector (Gini coefficient) Graph 4 – Concentration of the value of startups: by ecosystem (Gini coefficient) Sources for the tables 2-13 and the graphs 1-4: own analysis, evaluation and elaboration based on online information and resources (primarily, the websites of companies, and subsequently the Dow Jones Venture Source and The Wall Street Journal, LinkedIn, Glassdoor, Crunchbase Pro, Bloomberg, AngelList, Quora)
0 0,2 0,4 0,6 0,8 1 0 0,2 0,4 0,6 0,8 1
Lorenz curve line of equality
Gini coefficient= 0.71 (sectors) 0 0,2 0,4 0,6 0,8 1 0 0,2 0,4 0,6 0,8 1 Gini coefficient= 0.72 (locations)
Table 12 – Continents and countries
Area Startups
Valuation (billion dollars, when
applicable)
Number % Total % Average
Asia China 17 15.60% 173.5 31.26% 10.21 Asia India 6 5.50% 30.4 5.48% 5.07 Asia / Others 6 5.50% 14.2 2.56% 2.37 ASIA 29 26.61% 218.1 39.29% 7.52 EUROPE 12 11.01% 26.7 4.81% 2.23 USA California 43 39.45% 242.4 43.67% 5.64 USA / Others 25 22.94% 67.9 12.23% 2.72 USA 68 62.39% 310.3 55.90% 4.56 General 109 100.00% 555.1 100.00% 5.09
Table 13 – Specific locations
Specific location Startups Valuation (billion dollars, when applicable) Number % Total % Average Beijing, China 10 9.17% 85.9 15.47% 8.59 Guangzhou, China 1 0.92% 2 0.36% 2 Hangzhou, China 1 0.92% 1.5 0.27% 1.5 Shanghai, China 3 2.75% 24.1 4.34% 8.03 Shenzhen, China 1 0.92% 10 1.80% 10 Tianjin, China 1 0.92% 50 9.01% 50 Bangalore, India 1 0.92% 11.6 2.09% 11.6 Gurgaon, India 1 0.92% 1.1 0.20% 1.1 Mumbai, India 1 0.92% 5 0.90% 5
New Delhi, India 3 2.75% 12.7 2.29% 4.23
Tel Aviv, Israel 1 0.92% 1.1 0.20% 1.1
Singapore 3 2.75% 9.8 1.77% 3.27
Seoul, South Korea 2 1.83% 3.3 0.59% 1.65
Paris, France 1 0.92% 1.5 0.27% 1.5 Berlin, Germany 3 2.75% 6.5 1.17% 2.17 Tubingen, Germany 1 0.92% 1.7 0.31% 1.7 Senningerberg, Luxembourg 1 0.92% 1.1 0.20% 1.1 Amsterdam, Netherlands 1 0.92% 2.3 0.41% 2.3 Stockholm, Sweden 2 1.83% 9.9 1.78% 4.95 London, UK 2 1.83% 2.2 0.40% 1.1 Oxford, UK 1 0.92% 1.5 0.27% 1.5
Carlsbad, California, USA 1 0.92% 1.5 0.27% 1.5
Emeryville, California, USA 1 0.92% 3.5 0.63% 3.5
Hawthorne, California, USA 1 0.92% 12 2.16% 12
Irvine, California, USA 1 0.92% 1.1 0.20% 1.1
Milpitas, California, USA 1 0.92% 1.1 0.20% 1.1
Mountain View, California, USA 1 0.92% 1.8 0.32% 1.8
Palo Alto, Californa, USA 7 6.42% 36.8 6.63% 5.26
Redwood City, California, USA 2 1.83% 2.5 0.45% 1.25
San Francisco, California, USA 24 22.02% 174.6 31.45% 7.28
San Mateo, California, USA 1 0.92% 1.3 0.23% 1.3
Sunnyvale, California, USA 2 1.83% 4.5 0.81% 2.25
Dania Beach, Florida, USA 1 0.92% 4.5 0.81% 4.5
Fort Lauderdale, Florida, USA 1 0.92% 1.6 0.29% 1.6
Jacksonville, Florida, USA 1 0.92% 3 0.54% 3
Chicago, Illinois, USA 2 1.83% 4 0.72% 2
Northbrook,Illinois, USA 1 0.92% 1.5 0.27% 1.5
Boston, Massachusetts, USA 1 0.92% 3.7 0.67% 3.7
Cambridge, Massachusetts, USA 1 0.92% 3 0.54% 3
Needham, Massachusetts, USA 1 0.92% 1.2 0.22% 1.2
Waltham, Massachusetts, USA 1 0.92% 1.1 0.20% 1.1
New York, NY, USA 10 9.17% 33.1 5.96% 3.31
Austin, Texas, USA 1 0.92% 2.4 0.43% 2.4
American Fork, Utah, USA 1 0.92% 2.3 0.41% 2.3
Provo, Utah, USA 2 1.83% 4 0.72% 2
Arlington, Virginia, USA 1 0.92% 2.5 0.45% 2.5
General 109 100.00% 555.1 100.00% 5.09
Sources for the tables 2-13 and the graphs 1-4: own analysis, evaluation and elaboration based on online information and resources (primarily, the websites of companies, and subsequently the Dow Jones Ven-ture Source and The Wall Street Journal, LinkedIn, Glassdoor, Crunchbase Pro, Bloomberg, AngelList, Quora)
4. Conclusions
Katia Giusepponi and Virginia Tosi
Based on technology and knowledge, the high-value startups ana-lysed here capture and facilitate global tendencies, leveraging inter-connectivity and sharing. They create strengths from the worldwide ecosystems in which they are immersed and which give them easier access to resources (Busenitz et al. 2003; Welter 2011; Spigel 2017). They are physiologically focused on shaping markets and compet-itiveness. The effectiveness of their mission and vision characterises them.
The presence of women founders, although extremely rare, is in positive correlation with strategic perspective (Jennings and Brush 2013). Similarly, plurality of founders is in positive correlation with strategic perspective (in particular, level of shared vision), organisa-tional profiles (specifically organisaorganisa-tional culture) and value (Harper 2008).
Regarding organisational profiles, the measures of central tenden-cy do not express high performance. However, the research findings show a correlation between dimensions of value (latest evaluation, valuation to funding) and organisational profiles, in particular cul-ture, external collaboration and participative decision-making which emerge, thus, as key factors to be strengthened in order to increase the maturity of the enterprise.
Consequently, the main challenges and risks in maintaining suc-cess particularly involve:
paying constant attention to people’s behaviours and life-style, market, competition and opportunities arising from ecosystems; developing employee engagement and organisation maturity.
The main contribution of this work is to show the positive effects of profiles which can be linked to the category of plurality. In broad terms, this includes, from an internal perspective, factors such as the number of founders, attitudes to participation, and a sense of belong-ing and cooperation; and from an external perspective, factors such as the attitude towards collaboration and the ability to make use of fertile ecosystems, or to understand and interpret global trends (Feld 2012). However, the research has given rise to a number of reflec-tions and insights into startups and their environment.
This work is generally focused on the 109 top startups worldwide and includes only brief considerations of differences among geo-graphical areas. An in-depth country-by-country comparison would be an important perspective in order to improve the research contri-bution.
Furthermore, following these businesses over the long-term would be fruitful in order to better understand the factors for success or for failure.
Appendix 1 – Startups considered
(109 startups valued at 1.1 billion dollars or more, as of May 2017)
1-27 28-54 55-81 82-109
Uber Credit Karma Uptake Deem
Didi Chuxing Tanium Prosper Marketplace Apttus
Xiaomi Instacart WePiao Thumbtack
Airbnb LeSports Sprinklr Robinhood
Palantir Delivery Hero ZocDoc Ticket Monster
Lufax VANCL AppNexus Rubrik
Meituan-Dianping Fanatics Quora FanDuel
WeWork DocuSign Honest Co. Medallia
SpaceX Grabtaxi BuzzFeed Infinidat
Flipkart Moderna CureVac Warby Parker
Pinterest Wish (ContextLogic) Lakala.com Auto1 Group
Dropbox Bloom Energy MongoDB Automattic
DJI Oscar Health Insur-ance JetSmarter Global Fashion Group
Stripe Qualtrics Quanergy Actifio
Theranos InMobi Zoox Proteus Digital Health
Spotify OneWeb Oxford Nanopore IronSource
Zhong An Online Mozido Jawbone Nextdoor
Lyft Houzz InsideSales.com Farfetch
Snapdeal Adyen Razer Shopclues.com
Ola Cabs (ANI
Technologies) Domo Koudai Shopping TransferWise
One97
Communica-tions HelloFresh BlaBlaCar Cylance
Magic Leap Trendy Group Mu Sigma OpenDoor
Ele.me Coupang Unity Technologies View
Sea Zenefits (YourPeo-ple) Guahao.com Anaplan
SoFi (Social
Fi-nance) Blue Apron Klarna Deliveroo
Slack Github Hike Gusto (ZenPayroll)
Intarcia Therapeutics Avant C3 IoT Jiuxian
Aiwujiwu
Source: own analysis and elaboration based on data from The Billion Dollar Startup Club (Dow Jones Venture Source and The Wall Street Journal).
Appendix 2 – Checklist ENTREPRENEUR PROFILES Company founded in Age (2017): average
Age (at founda-tion): average Number of co-founders Number of men Number of women STRATEGIC PERSPECTIVE Context interpretation
and vision Strategic orientation and mission Evidence y=1; n=0 Level of shared vision (1-5)* Effectiveness (1-5)* Evidence y=1; n=0 Effectiveness (1-5)* ORGANISATIONAL PROFILES Organizational culture
Sense of belonging (1-5)* Level of cooperation (1-5)* Mean
Responsibilities vs skills, total 5 Transformational vs transactional leadership, total 5
Responsibilities Skills Transformational leader-ship Transactional leadership Employee engagement: participative vs
authori-tative decision-making, total 5
Relationship model: level of collaboration vs competitiveness, total 5
Participative Authoritative Collaboration Competitiveness
ABILITY TO ATTRACT CRITICAL FACTORS /VALUE
People (1-5)* Knowledge (1-5)* Technologies (1-5)* Financial resources: total equity funding Financial resources: latest valua-tion Valuation to funding Rounds of funding (cur-rent)
SOCIO-ECONOMIC PERSPECTIVE /NEEDS AND MARKETS
Needs and markets Startups (number) Valuation (total) Valuation (average)
CONTINENTS, COUNTRIES AND SPECIFIC LOCATIONS
Continents Countries Specific loca-tions Startups (number) Valuation (total) Valuation (average)
(*) 0 = highly negative, 1 = widely negative, 2 = slightly negative, 3 = slightly positive, = widely positive and 5 = highly positive.
References
Åstebro, T., Herz, H., Nanda, R., & Weber, R.A. (2014) Seeking the Roots of Entrepreneurship: Insights from Behavioral Economics, Journal of
Economic Perspectives 28(3), 49–70.
Baptista, R., Karaoz, M. & Mendonca, J. (2007). Entrepreneurial back-grounds, human capital and start-up success. Jena Economic Research Papers, 45, 1-39.
Baum, J.R. & Locke, E.A. (2004). The relationship of entrepreneurial traits, skill, and motivation to subsequent venture growth. Journal of applied
psychology 89(4), 587–598.
Becchetti, L. & Trovato, G. (2002). The determinants of growth for small and medium sized firms. The role of the availability of external finance.
Small Business Economics 19(4), 291-306.
Beckman, C.M., Burton, M.D. & O’Reilly, C. (2007). Early teams: The impact of team demography on VC financing and going public. Journal
of Business Venturing 22, 147–173.
Begley, T.M. (1995). Using founder status, age of firm, and company growth rate as the basis for distinguishing entrepreneurs from managers of smaller businesses. Journal of business venturing 10(3), 249–263. Bertoni, F., Colombo, M.G. & Grilli, L. (2011). Venture capital financing
and the growth of high-tech start-ups: Disentangling treatment from se-lection effects. Research Policy 40(7), 1028–1043.
Bosma, N., Van Praag, M., Thurik, R. & De Wit, G. (2004). The value of human and social capital investments for the business performance of startups. Small Business Economics 23(3), 227–236.
Boston, Massachusetts: Harvard Business School Press.
Brixy, U. & Hessels, J. (2010). Human capital and start-up success of nas-cent entrepreneurs. EIM Research Reports, H201013.
Brockhaus, R.H. (1980). Risk taking propensity of entrepreneurs. Academy
Brush, C.G., Greene P.G. & Hart, M.M. (2001). From initial idea to unique advantage: The entrepreneurial challenge of constructing a resource base. The academy of management executive 15(1), 64–78.
Busenitz, L.W., West III, G.P., Shepherd, D., Nelson, T., Chandler, G.N. & Zacharakis, A. (2003). Entrepreneurship research in emergence: Past trends and future directions. Journal of management 29(3), 285–308. Cannone, G. & Ughetto, E. (2014). Born globals: A cross-country survey
on high-tech start-ups. International Business Review 23(1), 272–283. Carter, N.M., Gartner, W.B. & Reynolds, P.D. (1996). Exploring start-up
event sequences. Journal of business venturing 11(3), 151–166.
Chandler, G.N. & Jansen, E. (1992). The founder's self-assessed compe-tence and venture performance. Journal of Business venturing 7(3), 223–236.
Chen, G., Hambrick, D.C. & Pollock, T.G. (2008). Puttin’on the Ritz: pre-IPO enlistment of prestigious affiliates as deadline-induced remediation.
Academy of Management Journal 51, 954–975.
Chesbrough, H. & Rosenbloom, R.S. (2002). The role of the business mod-el in capturing value from innovation: evidence from Xerox Corpora-tion's technology spin-off companies. Industrial and corporate change
11(3), 529–555.
Christensen, C. (1997). The innovator's dilemma: when new technologies
cause great firms to fail, Boston (MA): Harvard Business School Press.
Christensen, C.M., Baumann, H., Ruggles, R. & Sadtler, T.M. (2006). Dis-ruptive Innovation for Social Change. Harvard Business Review 84(12), 94–101.
Christensen, C.M., McDonald, R., Altman, E.J. & Palmer, J. (2016). Dis-ruptive Innovation: Intellectual History and Future Paths. Harvard Busi-ness School, Working Paper 17–057.
Christensen, C.M., Raynor, M. & McDonald, R. (2015). What Is Disruptive Innovation? Harvard Business Review 93(12), 44–53.
Colombo, M.G., Delmastro, M. & Grilli, L. (2004). Entrepreneurs' human capital and the start-up size of new technology-based firms.
Internation-al journInternation-al of industriInternation-al organization 22(8-9), 1183–1211.
Cooper, A.C., Gimeno-Gascon, F.J. & Woo, C.Y. (1994). Initial human and financial capital as predictors of new venture performance. Journal
of business venturing 9(5), 371–395.
Cope, J., Towards a dynamic learning perspective of entrepreneurship, Lancaster University Management School, Working Paper 2003/079. Dautzenberg, K. & Reger, G. (2009). Entrepreneurial team characteristics
and success of new technology-based firms in Germany. International