1
Altered blood gene expression of tumor-related genes (PRKCB, BECN1 and CDKN2A) in Alzheimer’s disease
Anna Antonell1, Albert Lladó1, Raquel Sánchez-Valle1, Coral Sanfeliu2, Teresa Casserras3, Lorena Rami1,
Cristina Muñoz-García1, Adrià Dangla-Valls1, Mircea Balasa1, Patricia Boya4, Susana G Kalko3, José
Luis Molinuevo1.
1 Alzheimer’s disease and other cognitive disorders unit. Neurology Service. Hospital Clínic, Institut d’Investigacions BiomèdiquesAugust Pi i Sunyer (IDIBAPS), Barcelona, Spain
2 Department of Brain Ischemia and Neurodegeneration, Institut d’Investigacions Biomèdiques de
Barcelona (IIBB)-Consejo Superior de Investigaciones Científicas (CSIC), Barcelona, Spain
3 Bioinformatics Core Facility, IDIBAPS - CEK, Hospital Clínic/Universitat de Barcelona, Barcelona,
Spain
4 Department of Cellular and Molecular Biology, Centro de Investigaciones Biológicas. (CIB), Consejo Superior de Investigaciones Científicas (CSIC), Madrid, Spain
Corresponding author: Anna Antonell, PhD
Alzheimer’s Disease and Other Cognitive Disorders Unit Center for Biomedical Research CELLEX (CRBC) Planta 3, sector B
C/Casanova, 143 08036, Barcelona, Spain
Phone. +34-932275400 (ext.4814) [email protected]
Keywords: Gene expression; blood; Alzheimer’s disease; preclinical; autophagy; mitochondria
Acknowledgments
This study was supported by grants to JLM (Consolider CSD2010-00045) and to ALL (PI14/00282, ISCIII, Cofinancia FEDER, Unión Europea, Otra manera de hacer Europa) from the Spanish Ministry of Economy and Competitiveness. The research leading to these results has received support from the Innovative Medicines Initiative Joint Undertaking under grant agreement n°115568, resources of which are composed of financial contribution from the European Union's Seventh Framework Programme (FP7/2007-2013) and EFPIA companies’ in kind contribution. The authors are grateful to Alicia Mansilla for excellent technical assistance. This work was developed at the Centre de Recerca Biomèdica Cellex, Barcelona, Spain.
Manuscript
2
AbstractAlzheimer’s disease (AD) is the most common of the neurodegenerative diseases. Recent diagnostic criteria have defined a preclinical disease phase during which neuropathological substrates are thought to be present in the brain. There is an urgent need to find measurable alterations in this phase as well as a good peripheral biomarker in the blood. We selected a cohort of 100 subjects (controls = 47; preclinical AD = 11; patients with AD = 42) and analyzed whole blood expression of 20 genes by quantitative polymerase chain reaction. The selected genes belonged to calcium-signaling, senescence and autophagy, and mitochondria/oxidative stress pathways. Additionally, two genes associated with an increased risk of developing AD (CLU and BIN1) were also analyzed. We detected significantly different gene expressions of BECN1 and PRKCB between the control and the AD groups; and, of CDKN2A between the control and the preclinical AD groups. Notably, these three genes are also considered tumor suppressor (CDKN2A and BECN1) or tumor promoter (PRKCB) genes. Gene-gene expression Pearson correlations were computed separately for controls and patients with AD. The significant correlations (p<0.001) were represented in a network analysis with Cytoscape tool, which suggested an uncoupling of mitochondria-related genes in AD group. Whole blood is emerging as a valuable tissue in the study of the
3
IntroductionAlzheimer’s disease (AD) is the most common of the neurodegenerative diseases. It is characterized by an initial alteration of episodic memory that progresses to dementia in later stages. Most patients with AD are sporadic, with evidence of a complex multifactorial etiology in which genetic and environmental factors contribute to the disease development. Many genome-wide association studies have tried to link the risk of suffering AD with certain genes. Consequently, we know that the apolipoprotein E (APOE) gene (specifically the 4 allele) has an important role, with other important susceptibility loci being the clusterin (CLU) and bridging integrator 1 (BIN1) genes. Indeed, single-nucleotide polymorphisms in these genes are associated with increased risk of developing AD (http://www.alzgene.org/).
In AD, the underlying neuropathological findings are the extracellular deposition of β-amyloid (Aβ) peptide plaques, intracellular neurofibrillary tangles (consisting of hyperphosphorylated aggregates of the microtubule-associated protein tau) and selective neuronal loss [1]. Thus, biomarkers of brain amyloid deposition, such as the reduction of Aβ42in cerebrospinal fluid (CSF) or increased tracer retention on amyloid positron emission tomography (PET) have been described as early biochemical hallmarks of the disease. Other CSF biomarkers, such as increased levels of total tau protein (t-tau) and phosphorylated tau at threonine 181 (p-tau), are altered later in the progression of the disease and indicate neuronal injury [2].
Recent consensus criteria [3] have defined the preclinical stage of AD (Pre-AD) as patients with normal cognition, but abnormal amyloid biomarkers. Nevertheless, although such patients can be defined as Pre-AD, this does not mean that all of them will develop the clinical symptoms of the disease, nor can it predict when it might happen. In that sense, diagnosis of AD cannot be established in the Pre-AD stage, even though such patients are part of both observational research studies and clinical trials aiming to prevent or delay disease onset.
Several studies have tried to identify a gene expression signature in the peripheral blood that has diagnostic value for the detection of AD [4-8]. Although the validity of the blood transcriptome for the early diagnosis of AD has yet to be tested extensively, gene transcriptional profiles in the blood can reflect the complex pathophysiological status of AD, suggesting the potential of blood as a tissue for investigating causative factors, disease mechanisms, biomarkers, and novel therapeutic targets for AD [9-10,8]. Genes found to be expressed differently in the blood in AD are involved in biological pathways that have been associated with oxidative stress, mitochondrial dysfunction, immune activation,
4
inflammation, apoptosis, cell cycle, transcription, ion channels, extracellular matrix components, neurological function, and other functional categories [4-6,8].
In a whole-genome brain transcriptome profiling study in patients with AD, we previously described that calcium signaling was the most overrepresented altered pathway in the AD brain [11]. Thus, we wanted to explore if we could detect differences in the expression of genes related to this pathway in the peripheral blood. Moreover, mitochondrial dysfunction and autophagy have been related to the physiopathology of AD [12-13]. Therefore, we were also interested in studying the expression of genes from these pathways in the blood.
The aim of this study was to investigate if gene expression in the peripheral blood reflects AD-related changes in calcium-signaling, senescence and autophagy, and mitochondrial function/oxidative stress. Additionally, we searched for changes in the expression of two genes associated with an increased risk of developing AD (CLU and BIN1). These two genes do not belong to any of the biological pathways mentioned above, although CLU can be related to the response to elevated platelet cytosolic Ca2+. We
carefully selected our cohort, taking into account clinical and neuropsychological information together with the levels of AD biomarkers in the CSF (A42, t-tau, and p-tau). We specifically included a group of Pre-AD subjects, which to our best knowledge have not been studied in previous gene expression studies in the peripheral blood. In addition to assessing the differences in gene expression between clinical groups, we derived correlation networks for the studied genes to identify potential differences between patients with AD and controls.
Materials and methods
Subjects
Study subjects (total N = 100) were consecutively recruited at the Alzheimer’s Disease and Other Cognitive Disorders Unit of the Hospital Clínic de Barcelona. Written informed consent was obtained for all subjects. Participants received a complete clinical and neuropsychological examination, magnetic resonance imaging, and a lumbar puncture. The determination of CSF biomarkers of AD (Aβ42, t-tau, and p-tau) was used to create groups to increase the probability of an AD neuropathological substrate in the AD group, and to define the Pre-AD group (Table 1).
5
The AD group (N = 42) was defined according to the International Working Group (IWG)-2 criteria [14], requiring an AD-compatible CSF signature: decreased CSF Aβ42 levels plus high t-tau and p-tau levels. The Pre-AD group (N = 11) was defined according to the National Institute on Aging–Alzheimer's Association NIA-AA criteria [3], which include cognitive performance within the normal range (performance within 1.5 standard deviations) in all tests from a specific test battery, no significant psychiatric symptoms or previous neurological disease, and decreased CSF Aβ42. The control group (N = 47) consisted of cognitively healthy individuals without cognitive deficits or biomarker-level
abnormalities. Demographic data and APOE genotypes are shown in Table 1.
Cerebrospinal Fluid Analysis
Cerebrospinal fluid (CSF) was collected by lumbar puncture between 9 am and 12 am. Samples were processed within 1 hour by centrifugation at 4ºC for 10 min at 2000 × g, stored in polypropylene tubes, and frozen at -80ºC. Next, CSF Aβ42, p-tau, and t-tau levels were detected by enzyme-linked
immunosorbent assay (ELISA) (Fujirebio Europe, Gent, Belgium). Biomarker cut-off values were 500 pg/mL for Aβ42, 450 pg/mL for t-tau and 75 pg/mL for p-tau [15].
Whole Blood RNA Extraction
Venous blood samples (3 mL) were drawn into Tempus Blood RNA tubes (Life technologies, Thermo Fisher Scientific, Waltham, MA, USA) and inverted 8–10 times. Tubes were frozen below −20ºC until RNA extraction. Total RNA was extracted using two Tempus tubes per subject and with the Tempus Spin RNA Isolation Kit (Life technologies) according to the manufacturer’s instructions. RNA was stored at −70ºC or below, then concentrated using the RNA Clean & Concentrator-5 Kit (Zymo Research, Irvine, CA, USA) and assessed for quality and quantity using the Nanodrop ND-1000 spectrophotometer (Thermo Fisher Scientific, Thermo Scientific, Waltham, MA, USA).
Quantitative Reverse-Transcription Polymerase Chain Reaction (qRT-PCR)
RNA (1 g) was retro-transcribed using the SuperScript® VILO™ cDNA synthesis kit following the manufacturer’s instructions (Life technologies). A pre-amplification of 14 cycles was performed for all genes with a customized TaqMan® PreAmp Pool and TaqMan® PreAmp Master Mix (Life technologies) prior to quantitative PCR. Custom TaqMan® Array Cards (TACs) were designed with three reference genes (PPIB, PGK1, POLR2A) and 20 selected genes, classified into the following groups: calcium signaling (7 genes), mitochondria/oxidative stress (8 genes), senescence and autophagy (3 genes), and AD
6
risk factor (2 genes) (Table 2). Reference genes for normalization were selected based on existing literature [16] and confirmed with a good stability score in Expression Suite software (Life technologies). Quantitative PCR with TACs was performed in a Viia7 instrument (Life technologies). All reactions were run in triplicate.
Bioinformatics Analysis
Quality control and statistical tests. Triplicate raw data cycle threshold (Ct) values of each sample were
analyzed with Expression Suite software. These values were normalized with the mean Ct of the three endogenous genes (mean Ct value – mean Ct of endogenous genes = Ct value), and were further transformed to 2-Ct. After a careful exploration of the quality of the normalized data, a generalized linear
model analysis (ANOVA), adjusted for covariates (age as quantitative and APOE genotype as cathegorical), was used to calculate differences in expression between groups. P-values < 0.05 were considered significant. The magnitude of change between groups was calculated with the 2-Ct method
(mean Ct value of group 1 – mean Ct value of group 2 = Ct, further transformed to 2-Ct). For the comparison of Pre-AD with controls or patients with AD, we selected groups of equal number (N = 11) matched for age.
Pearson correlation and networks derivation. Pearson correlations between all genes were computed
separately for both datasets, controls and patients with AD. Networks were constructed for any dataset and two genes were connected if their correlation was considered significant, having a p-value < 0.001. Representation of the networks was accomplished with the Cytoscape© tool [17], an “open-source” platform which construct and manage networks. Finally, we performed a meta-analysis comparing the differences between the topology of the networks, mainly identifying differences on hubs (genes with a large number of connectivities).
Results
Differential gene expression
Patients with AD presented significantly downregulated expression of BECN1 (p-value = 0.038; FC = 0.88) and PRKCB (p-value = 0.024; FC = 0.85) genes compared with the control group (Fig. 1 A, B and
7
Fig. 2A). When using only age and not the APOE genotype as a covariate (ANOVA test), the CLU gene also reached statistical significance between these groups (p-value = 0.013).
The Pre-AD group presented significant differences in the expression and up-regulation of the CDKN2A gene (p-value = 0.028; FC = 1.70) compared with an equal number of age-matched controls (Fig. 1 C and Fig. 2B). No significant differences in gene expression were detected between the matched Pre-AD and AD patient groups.
Gene-gene expression correlations
We looked for gene-gene expression correlations separately in the control (N = 47) and AD (N = 42) groups. Initially, we focused on large correlations (|R| > 0.7) in at least one of the two groups and
highlighted those where a clear difference existed between groups: BECN1-S100A6 (only present in AD), and ATP2B1-MAP1S and ATP2B1-PPP3R1 (only present in controls) (Table 3).
We then looked for all the correlations for the genes that were expressed statistically differently between AD and controls (BECN1 and PRKCB) with an |R| > 0.5 and p < 0.001 in at least one of the two groups. From these correlations, we identified three differences: BECN1-S100A6 (already mentioned above),
BECN1-ATP2B1 (present in AD), and PRKCB-MAP1S (present in controls). In addition, seven more
correlations were common in the two groups, mostly for the PRKCB gene (6/7) (Table 3).
Cytoscape networks
Correlations with |R| > 0.5 and p < 0.001 were represented with the Cytoscape© tool to visualize the networks for controls (Fig. 3A) and patients with AD (Fig. 3B). The network obtained for control subjects had largest coordination between the calcium-signaling and mitochondria/oxidative stress genes (12 positive inter-correlations) than that obtained for AD patients (7 positive inter-correlations ). Moreover, in the AD group, there were fewer connectivities between the mitochondria/oxidative stress genes compared with controls. We also identified gene hubs (largely connected genes) in both networks (ATP2B1, S100A6, CAPN1, PRKCB, and POLG), whereas other genes behaved as hub only in the controls and not in the patients with AD (PPP3R1, COX6B1, GPX3, and MAP1S). Finally, in the AD group, the links for the calcium-signaling gene, CACNA1B, were lost. Inversely, new correlations appeared for the senescence and autophagy genes for patients with AD (three genes with five correlations), with only one gene connected in controls.
8
DiscussionWe detected significant differences in the expression of three genes (BECN1, PRKCB, and CDKN2A) in the blood of patients with AD and Pre-AD. Compared with controls, we demonstrated that CDKN2A was expressed differently in the Pre-AD phase, while BECN1 and PRKCB were expressed differently in patients with AD. BECN1 and CDKN2A were related to the senescence and autophagy pathway, while
PRKCB was related to the calcium-signaling pathway (http://pathcards.genecards.org/), although it can
also play a role in autophagy and mitochondrial function [18]. Notably, these three genes are also considered tumor suppressor (CDKN2A and BECN1) or tumor promoter (PRKCB) genes
(http://www.genecards.org/).
A number of recent studies have revealed an inverse correlation in the prevalence of AD and cancer in multiple ethnic groups, with a reduced risk of developing cancer in patients with AD and a reduced risk of developing AD in those with a history of cancer [19]. In this sense, many genes regulating cell
proliferation/survival or apoptosis are altered in AD brains, resulting in a prone-to-death state [20]. The re-expression of a multitude of cell-cycle regulators known to control the activation and progression of the cell cycle in dividing cells has been observed in degenerating AD neurons [21], suggesting a reactivation of the cell cycle during neurodegeneration [22-23,21]. After withdrawal from the cell cycle, differentiated neurons are able to alter molecular mechanisms that primarily control proliferation, to control synaptic plasticity instead [21,23]. The existence of these alternate effector pathways within a neuron might put it at risk and erroneously convert signals derived from plastic synaptic changes into positional cues that will activate the cell cycle. This cell-cycle activation can potentially link synaptic plasticity to cell death [21]. Indeed, aberrant reentry to the cell cycle may be an early pathogenic event of AD, and could be detectable in the brains of patients with mild cognitive impairment and pathological evidence of AD [24].
The CDKN2A gene codes for the Cyclin-Dependent Kinase Inhibitor 2A (CDKN2A) protein. It is a tumor suppressor gene involved in cell-cycle regulation, and is frequently mutated or deleted in several tumors. Interestingly, our study is the first to describe altered CDKN2A levels in the blood of patients with pre-AD compared with controls. This suggests that CDKN2A could be considered as a potential biomarker or therapeutic target in the earlier stages of the disease; but, more evidence is needed using larger cohorts. The CDKN2A protein has previously been reported to be up-regulated in the brains of patients with AD [25], as well as in brain and peripheral cells from the amyloid precursor protein ⁄presenilin 1 mouse model
9
of AD [26]. However, we did not detect any differences in CDKN2A gene expression between our control and AD groups. This discrepancy from the previous studies could be explained by differences in the tissue/animal model studied and in the targeted molecule (mRNA or protein). Equally, the fact that we detected mRNA expression differences in the blood of the Pre-AD group makes us consider that it is possible to detect differences using this model. Thus, we hypothesize that the differences are bigger in the Pre-AD phase than when AD is present (with respect to controls), which would explain why we only have been able to detect them in blood of patients in the Pre-AD phase. Another possible explanation for this unexpected finding when comparing Controls and AD groups (with bigger sample size than the Pre-AD) would be the inter-individual variability in the values of CDKN2A expression within a group and the wider range of age. Other studies have revealed alterations of cell-cycle regulating proteins (p53, p21, phosphorylated forms p53 [ser15] and p21 [thr145], CDK2, E2F-1, Cyclin E, Rb and CDKN1B) in
peripheral blood lymphocytes of patients with AD [27-29]. These studies, together with our findings, suggest that the use of peripheral cells to study the molecular basis of AD pathogenesis, including cell-cycle disturbances, can be a valuable resource.
The PRKCB gene encodes the beta protein of the Protein Kinase C (PKC) family of serine- and threonine-specific protein kinases that can be activated by calcium and the second messenger diacylglycerol. Although PKC over-expression has been shown to contribute to cell transformation, PKCs are not considered classic oncogenes that are activated by mutations, but are considered tumor promoters that enhance multiple cellular signaling pathways [30]. We have found evidence of PRKCB gene
downregulation in patients with AD. However, the role of PRKCB in the development of AD is ambiguous, because some contradictory results exist as to whether it is up- or downregulated [31-33]. This could be explained by differences in studied tissue, mRNA or protein analysis, and experimental protocols.
Autophagy is a major intracellular degradation pathway that plays an essential role in the cellular stress response. Autophagy degrades intracellular components, including whole organelles, allowing building blocks and energy to be released to maintain cellular homeostasis [34]. Several pathologies (including various types of cancer and neurodegenerative disorders such as AD) are characterized by altered levels of autophagy. The BECN1 gene, which encodes the Beclin-1 protein, is a tumor suppressor gene that participates in the regulation of autophagy and has an important role in development, tumor genesis, and neurodegeneration [35]. We identified BECN1 downregulation in patients with AD, consistent with
10
previous literature that have indicated that expression of the Beclin-1 protein is reduced in the brains of patients with AD [12,36]. We have been unable to identify any data concerning its expression in the blood.
Several reports have described increased CLU protein concentration in different brain areas. However, there is some controversy as to whether it is increased in the frontal cortex in AD and whether it is associated with the APOE 4 load [37-40]. Moreover, increased plasma CLU concentration has been reported in AD to predict greater beta amyloid (Aβ) burden in the medial temporal lobe [41] as well as brain atrophy in mild cognitive impairment [42]. We analyzed the differences in CLU gene expression in the blood, but it only reached statistical significance when using age as a covariate (p-value = 0.013), with a trend when using APOE as a covariate (p-value = 0.07). Thus, the APOE genotype may be important when considering CLU levels as a possible biomarker. The role of CLU should be explored in more depth to clarify its potential role as a blood biomarker.
Gene expression correlation networks were created for the 20 genes selected for this study. Although they represent a small proportion of the genome, we detected different correlations between the control group and patients with AD. These could represent functional relations that are gained or lost in patients with AD, and that could be targets for research or therapy. Gene-gene significant correlations present in controls only (i.e., PRKCB-MAP1S, ATP2B1-MAP1S, and ATP2B1-PPP3R1), and not in patients with AD, could describe important relationships for healthy aging. Conversely, gene-gene significant correlations present only in patients with AD (i.e., BECN1-S100A6 and BECN1-ATP2B1) could be important for the development of the disease or could be a consequence of the disease. Some genes were hubs (largely interconnected features) only in one of the groups, but the PRKCB gene was a hub in both networks, and had a relatively high number of connectivities with genes involved in mitochondrial function, such as POLG, GPX3, MAP1S, and COX6B1. In this sense, many inter-correlations exist between calcium-signaling and mitochondria/oxidative stress functional groups, with a higher number in controls than in patients with AD. While the correlations were present in both networks (controls and AD) for the calcium-signaling genes, the correlations were diminished in the AD network for the
mitochondria/oxidative stress genes, which indicates that the uncoupling of genes from these functional groups could be relevant for the disease state.
We are aware that the present study has some limitations. First, our Pre-AD group had a reduced sample size because it was difficult to identify potential subjects that met all the inclusion criteria. Second, when
11
assessed in blood, gene expression may be influenced by the cellular diversity of the blood compartment; several additional factors can contribute to the individual variability in gene expression, such as diet, exercise, treatment or inflammatory events. Finally, for the genes with a statistically significant difference, there exists an overlap among participant groups, which makes them unsuitable for use as diagnostic biomarkers. Nevertheless, we believe that they are very useful for continue to advance our knowledge of the physiopathology of AD.
In conclusion, we studied the expression of genes in the peripheral blood at different stages of AD. We detected significant differences in the expression of genes related to calcium signaling, senescence and autophagy. Notably, all identified genes were related to cancer, strengthening the argument that more studies are needed to investigate the relationship between neurodegenerative diseases and cancer. Due to its accessibility, whole blood represents a valuable tissue that can be used to advance our knowledge of the pathophysiology of AD and, potentially, to find a biomarker for AD.
References
1. Braak H, Alafuzoff I, Arzberger T, Kretzschmar H, Del Tredici K (2006) Staging of
Alzheimer disease-associated neurofibrillary pathology using paraffin sections and
immunocytochemistry. Acta Neuropathol 112 (4):389-404.
doi:10.1007/s00401-006-0127-z
2. Jack CR, Jr., Knopman DS, Jagust WJ, Shaw LM, Aisen PS, Weiner MW, Petersen
RC, Trojanowski JQ (2010) Hypothetical model of dynamic biomarkers of the
Alzheimer's pathological cascade. Lancet Neurol 9 (1):119-128.
doi:S1474-4422(09)70299-6 [pii]
10.1016/S1474-4422(09)70299-6
3. Sperling RA, Aisen PS, Beckett LA, Bennett DA, Craft S, Fagan AM, Iwatsubo T,
Jack CR, Jr., Kaye J, Montine TJ, Park DC, Reiman EM, Rowe CC, Siemers E, Stern Y,
Yaffe K, Carrillo MC, Thies B, Morrison-Bogorad M, Wagster MV, Phelps CH (2011)
Toward defining the preclinical stages of Alzheimer's disease: recommendations from
the National Institute on Aging-Alzheimer's Association workgroups on diagnostic
guidelines for Alzheimer's disease. Alzheimers Dement 7 (3):280-292.
doi:S1552-5260(11)00099-9 [pii]
10.1016/j.jalz.2011.03.003
4. Fehlbaum-Beurdeley P, Jarrige-Le Prado AC, Pallares D, Carriere J, Guihal C,
Soucaille C, Rouet F, Drouin D, Sol O, Jordan H, Wu D, Lei L, Einstein R,
Schweighoffer F, Bracco L (2010) Toward an Alzheimer's disease diagnosis via
high-resolution blood gene expression. Alzheimers Dement 6 (1):25-38.
doi:S1552-5260(09)02089-5 [pii]
10.1016/j.jalz.2009.07.001
5. Booij BB, Lindahl T, Wetterberg P, Skaane NV, Saebo S, Feten G, Rye PD,
Kristiansen LI, Hagen N, Jensen M, Bardsen K, Winblad B, Sharma P, Lonneborg A
12
(2011) A gene expression pattern in blood for the early detection of Alzheimer's
disease. J Alzheimers Dis 23 (1):109-119. doi:W413U3248K01W27Q [pii]
10.3233/JAD-2010-101518
6. Rye PD, Booij BB, Grave G, Lindahl T, Kristiansen L, Andersen HM, Horndalsveen
PO, Nygaard HA, Naik M, Hoprekstad D, Wetterberg P, Nilsson C, Aarsland D,
Sharma P, Lonneborg A (2011) A novel blood test for the early detection of Alzheimer's
disease. J Alzheimers Dis 23 (1):121-129. doi:W4H554U72110W857 [pii]
10.3233/JAD-2010-101521
7. Lunnon K, Sattlecker M, Furney SJ, Coppola G, Simmons A, Proitsi P, Lupton MK,
Lourdusamy A, Johnston C, Soininen H, Kloszewska I, Mecocci P, Tsolaki M, Vellas
B, Geschwind D, Lovestone S, Dobson R, Hodges A (2013) A blood gene expression
marker of early Alzheimer's disease. J Alzheimers Dis 33 (3):737-753.
doi:R36932421476K620 [pii]
10.3233/JAD-2012-121363
8. Naughton BJ, Duncan FJ, Murrey DA, Meadows AS, Newsom DE, Stoicea N, White
P, Scharre DW, McCarty DM, Fu H (2014) Blood Genome-Wide Transcriptional
Profiles Reflect Broad Molecular Impairments and Strong Blood-Brain Links in
Alzheimer's Disease. J Alzheimers Dis. doi:FK85177375240413 [pii]
10.3233/JAD-140606
9. Maes OC, Xu S, Yu B, Chertkow HM, Wang E, Schipper HM (2007) Transcriptional
profiling of Alzheimer blood mononuclear cells by microarray. Neurobiol Aging 28
(12):1795-1809. doi:S0197-4580(06)00298-3 [pii]
10.1016/j.neurobiolaging.2006.08.004
10. Han G, Wang J, Zeng F, Feng X, Yu J, Cao HY, Yi X, Zhou H, Jin LW, Duan Y,
Wang YJ, Lei H (2013) Characteristic transformation of blood transcriptome in
Alzheimer's disease. J Alzheimers Dis 35 (2):373-386. doi:3685X227K52688P6 [pii]
10.3233/JAD-121963
11. Antonell A, Llado A, Altirriba J, Botta-Orfila T, Balasa M, Fernandez M, Ferrer I,
Sanchez-Valle R, Molinuevo JL (2013) A preliminary study of the whole-genome
expression profile of sporadic and monogenic early-onset Alzheimer's disease.
Neurobiol Aging 34 (7):1772-1778. doi:S0197-4580(12)00659-8 [pii]
10.1016/j.neurobiolaging.2012.12.026
12. Salminen A, Kaarniranta K, Kauppinen A, Ojala J, Haapasalo A, Soininen H,
Hiltunen M (2013) Impaired autophagy and APP processing in Alzheimer's disease: The
potential role of Beclin 1 interactome. Prog Neurobiol 106-107:33-54.
doi:S0301-0082(13)00051-8 [pii]
10.1016/j.pneurobio.2013.06.002
13. Garcia-Escudero V, Martin-Maestro P, Perry G, Avila J (2013) Deconstructing
mitochondrial dysfunction in Alzheimer disease. Oxid Med Cell Longev 2013:162152.
doi:10.1155/2013/162152
14. Dubois B, Feldman HH, Jacova C, Hampel H, Molinuevo JL, Blennow K, DeKosky
ST, Gauthier S, Selkoe D, Bateman R, Cappa S, Crutch S, Engelborghs S, Frisoni GB,
Fox NC, Galasko D, Habert MO, Jicha GA, Nordberg A, Pasquier F, Rabinovici G,
Robert P, Rowe C, Salloway S, Sarazin M, Epelbaum S, de Souza LC, Vellas B, Visser
PJ, Schneider L, Stern Y, Scheltens P, Cummings JL (2014) Advancing research
diagnostic criteria for Alzheimer's disease: the IWG-2 criteria. Lancet Neurol 13
(6):614-629. doi:S1474-4422(14)70090-0 [pii]
10.1016/S1474-4422(14)70090-0
15. Antonell A, Fortea J, Rami L, Bosch B, Balasa M, Sanchez-Valle R, Iranzo A,
Molinuevo JL, Llado A (2011) Different profiles of Alzheimer's disease cerebrospinal
13
fluid biomarkers in controls and subjects with subjective memory complaints. J Neural
Transm 118 (2):259-262. doi:10.1007/s00702-010-0534-0
16. Falkenberg VR, Whistler T, Murray JR, Unger ER, Rajeevan MS (2011)
Identification of Phosphoglycerate Kinase 1 (PGK1) as a reference gene for quantitative
gene expression measurements in human blood RNA. BMC Res Notes 4:324.
doi:1756-0500-4-324 [pii]
10.1186/1756-0500-4-324
17. Shannon P, Markiel A, Ozier O, Baliga NS, Wang JT, Ramage D, Amin N,
Schwikowski B, Ideker T (2003) Cytoscape: a software environment for integrated
models of biomolecular interaction networks. Genome Res 13 (11):2498-2504.
doi:10.1101/gr.1239303
13/11/2498 [pii]
18. Patergnani S, Marchi S, Rimessi A, Bonora M, Giorgi C, Mehta KD, Pinton P
(2013) PRKCB/protein kinase C, beta and the mitochondrial axis as key regulators of
autophagy. Autophagy 9 (9):1367-1385. doi:25239 [pii]
10.4161/auto.25239
19. Li JM, Liu C, Hu X, Cai Y, Ma C, Luo XG, Yan XX (2014) Inverse correlation
between Alzheimer inverted question marks disease and cancer: implication for a strong
impact of regenerative propensity on neurodegeneration? BMC Neurol 14 (1):211.
doi:s12883-014-0211-2 [pii]
10.1186/s12883-014-0211-2
20. Behrens MI, Lendon C, Roe CM (2009) A common biological mechanism in cancer
and Alzheimer's disease? Curr Alzheimer Res 6 (3):196-204
21. Arendt T (2012) Cell cycle activation and aneuploid neurons in Alzheimer's disease.
Mol Neurobiol 46 (1):125-135. doi:10.1007/s12035-012-8262-0
22. Herrup K, Arendt T (2002) Re-expression of cell cycle proteins induces neuronal
cell death during Alzheimer's disease. J Alzheimers Dis 4 (3):243-247
23. Arendt T, Bruckner MK (2007) Linking cell-cycle dysfunction in Alzheimer's
disease to a failure of synaptic plasticity. Biochim Biophys Acta 1772 (4):413-421.
doi:S0925-4439(06)00269-9 [pii]
10.1016/j.bbadis.2006.12.005
24. Yang Y, Mufson EJ, Herrup K (2003) Neuronal cell death is preceded by cell cycle
events at all stages of Alzheimer's disease. J Neurosci 23 (7):2557-2563. doi:23/7/2557
[pii]
25. McShea A, Harris PL, Webster KR, Wahl AF, Smith MA (1997) Abnormal
expression of the cell cycle regulators P16 and CDK4 in Alzheimer's disease. Am J
Pathol 150 (6):1933-1939
26. Esteras N, Bartolome F, Alquezar C, Antequera D, Munoz U, Carro E,
Martin-Requero A (2012) Altered cell cycle-related gene expression in brain and lymphocytes
from a transgenic mouse model of Alzheimer's disease [amyloid precursor
protein/presenilin 1 (PS1)]. Eur J Neurosci 36 (5):2609-2618.
doi:10.1111/j.1460-9568.2012.08178.x
27. Tan M, Wang S, Song J, Jia J (2012) Combination of p53(ser15) and
p21/p21(thr145) in peripheral blood lymphocytes as potential Alzheimer's disease
biomarkers. Neurosci Lett 516 (2):226-231. doi:S0304-3940(12)00491-0 [pii]
10.1016/j.neulet.2012.03.093
28. Song J, Wang S, Tan M, Jia J (2012) G1/S checkpoint proteins in peripheral blood
lymphocytes are potentially diagnostic biomarkers for Alzheimer's disease. Neurosci
Lett 526 (2):144-149. doi:S0304-3940(12)01086-5 [pii]
14
29. de las Cuevas N, Urcelay E, Hermida OG, Saiz-Diaz RA, Bermejo F, Ayuso MS,
Martin-Requero A (2003) Ca2+/calmodulin-dependent modulation of cell cycle
elements pRb and p27kip1 involved in the enhanced proliferation of lymphoblasts from
patients with Alzheimer dementia. Neurobiol Dis 13 (3):254-263.
doi:S0969996103000408 [pii]
30. Martiny-Baron G, Fabbro D (2007) Classical PKC isoforms in cancer. Pharmacol
Res 55 (6):477-486. doi:S1043-6618(07)00079-5 [pii]
10.1016/j.phrs.2007.04.001
31. Masliah E, Cole G, Shimohama S, Hansen L, DeTeresa R, Terry RD, Saitoh T
(1990) Differential involvement of protein kinase C isozymes in Alzheimer's disease. J
Neurosci 10 (7):2113-2124
32. Alldred MJ, Duff KE, Ginsberg SD (2012) Microarray analysis of CA1 pyramidal
neurons in a mouse model of tauopathy reveals progressive synaptic dysfunction.
Neurobiol Dis 45 (2):751-762. doi:S0969-9961(11)00354-8 [pii]
10.1016/j.nbd.2011.10.022
33. Gerschutz A, Heinsen H, Grunblatt E, Wagner AK, Bartl J, Meissner C, Fallgatter
AJ, Al-Sarraj S, Troakes C, Ferrer I, Arzberger T, Deckert J, Riederer P, Fischer M,
Tatschner T, Monoranu CM (2014) Neuron-specific alterations in signal transduction
pathways associated with Alzheimer's disease. J Alzheimers Dis 40 (1):135-142.
doi:M330NL5304413834 [pii]
10.3233/JAD-131280
34. Boya P, Reggiori F, Codogno P (2013) Emerging regulation and functions of
autophagy. Nat Cell Biol 15 (7):713-720. doi:ncb2788 [pii]
10.1038/ncb2788
35. Zhong Y, Wang QJ, Li X, Yan Y, Backer JM, Chait BT, Heintz N, Yue Z (2009)
Distinct regulation of autophagic activity by Atg14L and Rubicon associated with
Beclin 1-phosphatidylinositol-3-kinase complex. Nat Cell Biol 11 (4):468-476.
doi:ncb1854 [pii]
10.1038/ncb1854
36. Pickford F, Masliah E, Britschgi M, Lucin K, Narasimhan R, Jaeger PA, Small S,
Spencer B, Rockenstein E, Levine B, Wyss-Coray T (2008) The autophagy-related
protein beclin 1 shows reduced expression in early Alzheimer disease and regulates
amyloid beta accumulation in mice. J Clin Invest 118 (6):2190-2199.
doi:10.1172/JCI33585
37. Lidstrom AM, Bogdanovic N, Hesse C, Volkman I, Davidsson P, Blennow K
(1998) Clusterin (apolipoprotein J) protein levels are increased in hippocampus and in
frontal cortex in Alzheimer's disease. Exp Neurol 154 (2):511-521.
doi:S0014-4886(98)96892-3 [pii]
10.1006/exnr.1998.6892
38. Bertrand P, Poirier J, Oda T, Finch CE, Pasinetti GM (1995) Association of
apolipoprotein E genotype with brain levels of apolipoprotein E and apolipoprotein J
(clusterin) in Alzheimer disease. Brain Res Mol Brain Res 33 (1):174-178.
doi:0169328X9500097C [pii]
39. Harr SD, Uint L, Hollister R, Hyman BT, Mendez AJ (1996) Brain expression of
apolipoproteins E, J, and A-I in Alzheimer's disease. J Neurochem 66 (6):2429-2435
40. Baig S, Palmer LE, Owen MJ, Williams J, Kehoe PG, Love S (2012) Clusterin
mRNA and protein in Alzheimer's disease. J Alzheimers Dis 28 (2):337-344.
doi:76N6N165XL685831 [pii]
15
41. Thambisetty M, Simmons A, Velayudhan L, Hye A, Campbell J, Zhang Y,
Wahlund LO, Westman E, Kinsey A, Guntert A, Proitsi P, Powell J, Causevic M,
Killick R, Lunnon K, Lynham S, Broadstock M, Choudhry F, Howlett DR, Williams
RJ, Sharp SI, Mitchelmore C, Tunnard C, Leung R, Foy C, O'Brien D, Breen G, Furney
SJ, Ward M, Kloszewska I, Mecocci P, Soininen H, Tsolaki M, Vellas B, Hodges A,
Murphy DG, Parkins S, Richardson JC, Resnick SM, Ferrucci L, Wong DF, Zhou Y,
Muehlboeck S, Evans A, Francis PT, Spenger C, Lovestone S (2010) Association of
plasma clusterin concentration with severity, pathology, and progression in Alzheimer
disease. Arch Gen Psychiatry 67 (7):739-748. doi:67/7/739 [pii]
10.1001/archgenpsychiatry.2010.78
42. Thambisetty M, An Y, Kinsey A, Koka D, Saleem M, Guntert A, Kraut M, Ferrucci
L, Davatzikos C, Lovestone S, Resnick SM (2012) Plasma clusterin concentration is
associated with longitudinal brain atrophy in mild cognitive impairment. Neuroimage
59 (1):212-217. doi:S1053-8119(11)00833-0 [pii]
16
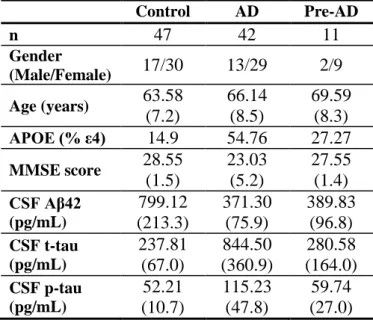
TABLESTable 1. Demographic and clinical/biochemical characteristics of participants, divided in the main three groups: Controls, AD (Alzheimer’s disease patients) and Pre-AD (Preclinical AD)
Control
AD
Pre-AD
n
47
42
11
Gender
(Male/Female)
17/30
13/29
2/9
Age (years)
63.58
(7.2)
66.14
(8.5)
69.59
(8.3)
APOE (% ε4)
14.9
54.76
27.27
MMSE score
28.55
(1.5)
23.03
(5.2)
27.55
(1.4)
CSF Aβ42
(pg/mL)
799.12
(213.3)
371.30
(75.9)
389.83
(96.8)
CSF t-tau
(pg/mL)
237.81
(67.0)
844.50
(360.9)
280.58
(164.0)
CSF p-tau
(pg/mL)
52.21
(10.7)
115.23
(47.8)
59.74
(27.0)
Values are shown as mean (± SD) for age, MMSE score, and CSF AD biomarkers. APOE genotype is given as the percentage of ε4 allele carriers (% ε4). Key: CSF, cerebrospinal fluid
17
Table 2. Details of the selected genesGene symbol
Description
Group
classification
Life technologies
assay number
CALM3
Calmodulin 3
(phosphorylase kinase,
delta)
Calcium signaling
Hs00968732_g1
CACNA1B
Calcium Channel, Voltage-
Dependent, N Type, Alpha
1B Subunit
Calcium signaling
Hs01053090_m1
PPP3R1
Protein Phosphatase 3,
Regulatory Subunit B, Alpha
Calcium signaling
Hs01547793_m1
ATP2B1
ATPase, Ca++ Transporting,
Plasma Membrane
Calcium signaling
Hs00155949_m1
PRKCB
Protein Kinase C, Beta
Calcium signaling
Hs00176998_m1
CAPN1
Calpain 1
Calcium signaling
Hs00559804_m1
S100A6
S100 calcium binding
protein A6
Calcium signaling
Hs00170953_m1
BECN1
Beclin-1, autophagy related
Senescence and
autophagy
Hs00186838_m1
ATG5
Autophagy related 5
Senescence and
autophagy
Hs00169468_m1
CDKN2A
Cyclin-dependent kinase
inhibitor 2A
Senescence and
autophagy
Hs02902543_mH
CLU
Clusterin
AD risk factor gene
Hs00971656_m1
BIN1
Bridging Integrator 1
AD risk factor gene
Hs00184913_m1
HSD17B10
Hydroxysteroid (17-beta)
dehydrogenase 10
Mitochondria and
oxidative stress
Hs00189576_m1
POLG
Polymerase (DNA directed),
gamma
Mitochondria and
oxidative stress
Hs01018668_m1
MAP1S
Microtubule-associated
protein 1S
Mitochondria and
oxidative stress
Hs00430193_m1
COX6B1
Cytochrome c oxidase
subunit VIb polypeptide 1
(ubiquitous)
Mitochondria and
oxidative stress
Hs00266375_m1
GPX3
glutathione peroxidase 3
Mitochondria and
oxidative stress
Hs01078668_m1
SOD1
Superoxide dismutase 1,
soluble
Mitochondria and
oxidative stress
Hs00533490_m1
TOMM40
Translocase of outer
mitochondrial membrane 40
homolog
Mitochondria and
oxidative stress
Hs00746704_s1
PPARGC1A
Peroxisome
proliferator-activated receptor gamma,
coactivator one alpha
Mitochondria and
oxidative stress
Hs01016719_m1
POLR2A
Polymerase (RNA) II (DNA
directed) polypeptide A
Reference gene
Hs01108291_m1
PPIB
Peptidylpropyl isomerase B
Reference gene
Hs00168719_m1
18
Table 3. Correlations between the control and AD groupsCorrelation
R Controls
p-value
Controls
R AD
p-value AD
Largest different correlations (|R| > 0.7)
ATP2B1-MAP1S
0.73
3.18E-09
-0.08
0.59
ATP2B1-PPP3R1
0.82
3.91E-13
0.39
0.007
BECN1-S100A6
0.38
0.007
0.71
1.96E-08
BECN1 and PRKCB different correlations (|R| > 0.5)
BECN1-ATP2B1
-0.21
0.14
-0.6
0.00044
PRKCB-MAP1S
0.55
3.51E-05
0.06
0.7
BECN1 and PRKCB common correlations (|R| > 0.5)
BECN1-CLU
0.51
0.00019
0.5
0.00036
PRKCB-COX6B1
0.63
1.18E-06
0.45
0.0013
PRKCB-POLG
0.61
2.13E-06
0.61
5.26E-06
PRKCB-GPX3
0.78
2.63E-11
0.66
3.99E-07
PRKCB-S100A6
-0.59
7.81E-06
-0.62
2.27E-06
PRKCB-PPP3R1
0.66
2.51E-07
0.51
0.00024
PRKCB-ATP2B1
0.69
2.78E-08
0.62
2.72E-06
Strong correlations (|R| > 0.7) are shown between controls and AD groups. Correlations between PRKCB and BECN1 genes, with p < 0.001 and |R| > 0.5, were common (present in both groups) or different (present only in controls or AD). |R| value and p-value are shown per group. Abbreviations: AD: Alzheimer’s disease.
19
FIGURE LEGENDSFig. 1 Gene expression levels in peripheral blood (a.u.: arbitrary units; 2-Ct*1000) of the three
significantly different genes: A) BECN1; B) PRKCB; C) CDKN2A. Mean ± 95% confidence intervals (CI) and significant p-values are shown. Key: CTRLs, Controls (N = 47 for BECN1 and PRKCB; N = 11 for CDKN2A); Pre-AD, patients with preclinical AD (N = 11); AD, patients with Alzheimer’s disease (N = 42)
Fig. 2 Fold-change (2-Ct) of the 20 genes that were studied. A) Comparison of AD (N = 42) and controls
(N = 47). B) Comparison of pre-AD and controls (N = 11). Key, CTRLs, Controls; AD, Alzheimer’s disease
Fig. 3 Cytoscape networks representing significant correlations for gene-gene expression. Continuous lines represent positive correlations and discontinuous lines represent negative correlations. The thickness of the line is proportional to the strength of the correlation. Colors represent the functional group
classification of a gene: yellow, calcium signaling; purple, mitochondria/oxidative stress; blue, senescence and autophagy; red, risk factor genes for Alzheimer’s disease
Figure 1
Figure 2
Figure 3