Francesca Mirizio
Supervisor
Academic Year
October 2014 (IX cycle) PhD in MANAGEMENT
University inventions:
an investigation into the factors affecting
patentability and licensing
Author
Francesca Mirizio
Supervisor
TABLE OF CONTENTS
INTRODUCTION
University Technology Transfer and licensing activity ... 1
Research design ... 2 I chapter ... 3 II chapter ... 4 III chapter ... 6 REFERENCES ... 7 CHAPTER I DO ITALIAN UNIVERSITIES PATENT “ENOUGH”? Abstract... 11
1.Introduction ... 11
2.Research objective and background ... 18
3.The analysis ... 22
4.Does the ranking differ when adding government research centers such as CNR? ... 24
5.Academic patenting. Is the ownership of Academic patenting somewhere else? Methodology Clarifications ... 32
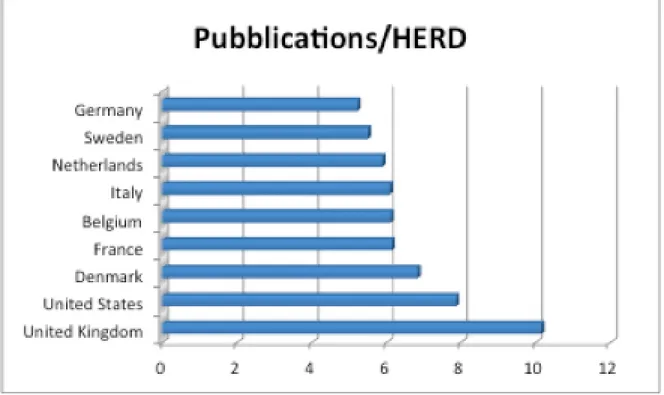
6.Scientific publications.Is a shortage in patenting due to a lack of knowledge?37 7.R&D expenditure. Is a shortage in patenting due to a lack of resources? ... 41
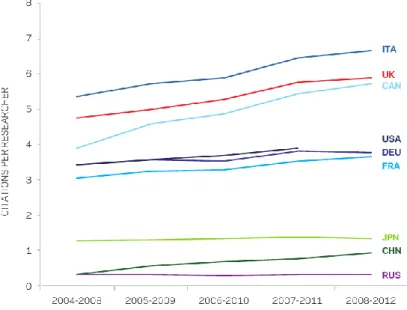
8.Forward citations. Is a shortage in patenting index of a lack of quality? ... 44
Conclusions ... 47
REFERENCES ... 50
CHAPTER II LICENSING STRATEGY AND POLICIES IN ITALIAN UNIVERSITIES: A QUALITATIVE RESEARCH ON THE BEST PERFORMERS Abstract... 60
1. Introduction ... 61
2. European university license activity, a comparison between countries ... 66
3. Factors that affect the licensing process. A literature review ... 70
4. Data and Methodology ... 73
5. The best Italian Universities in licensing. Analyzing the results ... 76
i) Commitment decision to file a patent ... 76
ii) Exploitation and commercialisation practice ... 78
iii) Case studies – successful license agreement ... 82
vi) TTO Staffs ... 85
v) Basic patent’s conditions / requirements to be licensed ... 86
vi) Recommendations ... 88
Conclusions ... 91
REFERENCES ... 93
CHAPTER III
KNOWLEDGE TRANSFER COMPANIES: WHICH ARE THE SUCCESS FACTORS?
Abstract ...102
1.Introduction ...102
2. Technology Transfer Office and Company. Contextual factors and literature condition for a good intermediation support ...107
3. Methodology ...109
4. Case studies ...112
United Kingdom Ecosystem ...113
a. Case study_UCLB ...114
b. Case study_IMPERIAL INNOVATION GROUP PLC ...114
Israel Ecosystem ...115
c. Case study_YISSUM RESEARCH DEVELOPMENT COMPANY LTD ...117
d. Case study_YEDA RESEARCH AND DEVELOPMENT CO ...118
5. Interviews evidences ...119
i. IP rules and revenue distribution policy...120
ii. The Business Manager ...123
iii. The legal form and business model ...124
iv. The influence of the external context ...126
Conclusion ...127 REFERENCES ...130 ANNEX 1 ...137 ANNEX 2 ...138 CONCLUSION ...141 Acknowledgements
INTRODUCTION
University Technology Transfer and licensing activity
Global competition requires continuous improvement in product processes, technologies, markets, and organizations. Collaboration and outsourcing increase the know-how and the number of technologies in-house that allow companies to compete and innovate.
In these last years, Technology Transfer (TT) has been identifying by the Governments as a way to innovate and generate economic benefits to the surrounding ecosystem. (J. Bercovitz, M. Feldman 2006).
Technology1 and Technology Transfer2 are concepts with boundaries that we cannot easily define. In fact, the technology transfer mechanisms have different form and levels of collaboration: contract research (consultancy or feasibility studies, prototyping), collaboration research, and licensing agreements between the university and private firms, science parks, incubators, and university-based start-ups. (J.G., Thursby, M.C., Thursby, 2000).
On one hand, effective and efficient collaborations Science – Industry create shareholder value, fulfill customer needs, increase global competition, ameliorate the product and process complexity, reduce research and development costs. On the other hand, universities and research institutes can have a gatekeeping and stay at the forefront of innovation as an increased importance of the third income stream. This collaboration also produces benefit and innovation for society as a whole. Technology transfer becomes the third mission alongside education and research, although not mutually integrated with those activities. (J.G. Thursby, S. Kemp, 1998): An extensive literature has investigated the impact of third mission activities on the society and the correlation between university licensing performance and factors that could influence the results (e.g. quality of research, TTO, university reputation). Only
1 “Technology can be regarded as a combination of codified information and tacit knowledge. Whereas the former can be written
down in a fairly precise way and therefor transmitted and used by others with the understanding of it, the latter is often embodied and specific and much less easily transferred to others” OECD an empirical study of THE UK INNOVATION SYSTEM prepared by
the Department of Trade and Industry.
2 In management, technology transfer refers to “intentional, goal oriented interaction” (Autio and Laamanen, 1995) between two
or more persons, groups or organizations in order to exchange technological knowledge and/or artefacts and rights. (Autio and Laamanen, 1995).
a few studies have addressed the reason why some universities that produce high-cited research are not good performers also in the transfer of it. Our research tries to investigate the determinants of this gap in the transmission and commercialization of university research results.
The thesis unfolds in three main chapters with the aims at exploring one little part of the Technology Transfer activities.
The selection of these topics has been mainly driven by the idea to deepen the main points of one of the aspects of the technology transfer mechanism: the efficiency of patents license.
We analysing three key aspects in different contexts and states in order to show the causes and factors affecting university licensing:
Patentability
Best practices on licensing
Technology - Knowledge transfer office/companies
We had chosen to analyse these topics because the daily work experience has been suggested as the main critical issues.
The Technology Transfer mechanisms are influenced by the regional context, national legislation and the transfer strategy of each university (P.Phan; D.Siegel 2006). Considering the elevated number of variables that could influence Technology Transfer, we had started with a general framework of analysis of a global university patent filing (I chapter), drill down to the Italian case of licensing (II chapter), and deepen the strategy and structure of the best internationally Technology Transfer Companies (III chapter), as intermediate office to support the effectiveness of technology transfer. Technology Transfer Companies facilitate technological diffusion through the licensing to industry of inventions or intellectual property resulting from university research.
Research design
The thesis investigates the role of University in patent filing and licensing activities by addressing three main research questions:
RQ1. What is the performance of Italy within the International context in terms of the development of University patent applications?
RQ2. How TTO may affect the probability of a patent being licensed?
RQ3. Which are the success factors of Knowledge Transfer Company?
I paper II paper III paper
Do Italian universities
patent “enough”? Licensing strategy and policies in Italian universities: a qualitative
research on the best performers
Knowledge Transfer Companies: which are
the success factors? RQ What is the performance of
Italy within the International context in terms of the development of University
patent applications
How TTO may affect the probability of a patent being
licensed?
Which are the success factors of Knowledge Transfer Company?
TOPIC Patent filing Licensing activity Knowledge Transfer Companies
METHODOLOGY Quantitative Qualitative and Quantitative Qualitative and Case Study
DATA/CASES Patstat dataset 2000-2012 Report European Universities- Merit, European Knowledge transfer indicator survey EKTIS
(2011-2012) Netval survey and interviews to
Managers of Italian TTO
Case study (Internal and public document), interviews to Managers of
KTCs
FINDINGS The patent activity of Italian Universities results not very numerous in comparison
with other countries but Italian University patents are
highly cited, thereby representing quality patents.
Three key determinants of TTO efficiency:
TTO resources, competency in identifying licensees, and
participation of faculty-inventors in the
licensing process.
The critical success factors are:
Context, organizational structure and autonomy for University, Staff and IP regulation and incentives.
IMPLICATIONS Focus on a different approach of patent filing of
Italian University
Share of best practices Definition and diffusion of procedures and strategy of
the best performers Fig. 1: The structure of the papers.
The research adopts a quantitative approach for the first question, identifying the position of Italian universities in terms of the number of patents filed. The second and third chapter adopts a qualitative approach, using the interview and case study method of research.
I chapter
The first research study involves the collection of the number of patents filed from University per country until 2012, deepening the results for European university patent.
Our analysis departs from previous studies conducted in this field, aims at analysing the performance of Italian Universities within the International context in terms of innovation contribution. We had measured this contribution only in term of European paten applications.
We had chosen to study the Italian case because in front of an excellent scientific production the transfer results –counted by Epo patent- Italian universities are not brilliant at the same level, also compared with other European Universities.
After had counting University and Government Research Centre patent filing from 2000-2012, we wondered how many patents, generated in the university are not university owned, because of the professor privilege.
To answer this question, we used the results of Lissoni studies (Lissoni et al 2009) about the professor's privilege and the evidence based on the Database KEINS on Academic Inventors.
Lissoni verified the academic contribution (academic invented patents) in terms of innovation, also for those patents implying the engagement of professors, in spite of not being university owned.
Our analysed data on EPO patens filing reveals that in quantitative terms Italy is low ranked, especially if the observed values are normalized per capita, per researcher or per GDP, in relation with the great part of the considered countries. But the Italian patents are the most cited so we can conclude that the strategies of Italian universities are to file at EPO only the very best patents and the most promising, probably due to a scarcely of resources the main applications are made at the Italian Patent office. For further research could be very interesting investigate how many patents born in the collaborative research are companies owned.
II chapter
In the second and third chapter, the analysis draws also the procedure and strategy of the best Italian Technology Transfer Office (TTO) and Knowledge Transfer company (KTC).
We have started with an analysis of literature, comparative report, and websites information, adopting semi-structure interviews that are useful to support our
theoretical arguments.
The TTO is the part of a university that is responsible for protecting and commercializing intellectual property, developed at the University, implementing the social and economic benefit. Each university develops its own organisational structures for managing research and technology commercialisation. TTOs can be part of the university administration or to be a wholly owned subsidiary company or rarely a contracted out service. We had selected and interviewed the Manager of the best ten Italian TTO, considering the number and amount of licensing agreements of all Italian Universities associated to Netval (in 2015 and the medium rate from 2002 to 2015).
The second chapter provides an overview of the licensing practices and process across Italian Universities. Established that Italian universities patent numerically less but qualitatively better, we asked what are the best practices of the first ten Italian universities in number and sum of license contracts stipulated?
Our primary data source is a comprehensive survey conducted by European Commission for the report European Universities- Merit, European Knowledge transfer indicator survey EKTIS (2011-2012), considering the performance in licensing of the European TTO.
We used the Netval3 survey data to examine the best performer of the Italian TTO. Netval collected data for the monitoring of the third university mission, in fact, Netval sends to all its associates an annual survey since 2002.
We assessed the number of licensed contracts and the economic value of them for the year 2015 and by aggregation from 2002 to 2015.
We selected the best ten TTO and we interviewed their Transfer Manger.
On the base of interviews given by TTO Managers of the best Universities in term of licensing performance, we found that the likelihood of licensing is affected more or less by the same factors.
To understand the factors and policies that could influence the licensing of a university patent we briefly analysed the way in which a university invention can be developed.
3 Netval was founded in November 2002 as a network of universities and public research organizations in Italy; it then became an association in September 2007. It has more than 60 members that represent over 80% of the Italian public research system.
III chapter
For the third paper, we have analysed the websites of about fifteen internationally Knowledge Transfer Company, and we sum up the technology transfer results and organizational structure. We have selected a sample of four based in England and Israel to conduct semi structured interviews to describe the case studies.
The ambition of the research is to give an instrument to the Universities political part to select the best approach to the Technology Transfer, considering the limits and constraints of each country and context. This comparative analysis in different dimension could be useful to update procedures, priority and strategy according to every specific University’s Third Mission and the reference context.
We explore the efficiency of the intermediation support office/companies. We had examined the Technology transfer indicators for best internationally Knowledge Transfer Companies (KTC). We had found that the best performers for numbers of licensing agreements, patents filing and spin-offs creation are private companies working predominantly for University.
We used an inductive, and qualitative method to identify the determinants of their success, comparing organizational practices, the intellectual property regulation and incentives and the human resources administration.
We had analysed the results in term of turnover of fifteen KTC, later we had chosen a sample selection of four KTC to conduct descriptive and comparative case studies. The study is limited only to two KTC based in the United Kingdom and two in Israel. We had wanted isolate the result of interviews to the reference context and the relative ecosystem because there exists a strong correlation between the performance of a TTO/KTC and its context (Phan; Siegel 2006).
Conclusions and implications of the overall research are broadly discussed in the last section of the thesis that draws the main contributions and points out some ideas for future studies.
REFERENCES
Amesse, F., & Cohendet, P. 2001. Technology transfer revisited from the perspective of the knowledge-based economy. Research policy, 30(9), 1459-1478.
Arundel, A., Es-Sadki, N., Barjak, F., Perrett, P., Samuel, O., & Lilschkis, S. 2013. Knowledge Transfer Study 2010-2012.
Autio, E., & Laamanen, T. 1995. Measurement and evaluation of technology transfer: review of technology transfer mechanisms and indicators. International Journal of Technology Management, 10(7-8), 643-664.
Bercovitz, J., & Feldman, M. 2006. Entrepreneurial universities and technology transfer: A conceptual framework for understanding knowledge-based economic development. The Journal of Technology Transfer, 31(1), 175-188.
Bercovitz, J., Feldman, M., Feller, I., & Burton, R. 2001. Organizational structure as a determinant of academic patent and licensing behavior: An exploratory study of Duke, Johns Hopkins, and Pennsylvania State Universities. The Journal of Technology Transfer, 26(1), 21-35.
Cohen, W. M., & Levinthal, D. A. 1989. Innovation and learning: the two faces of R & D. The economic journal, 99(397), 569-596.
Debackere, K., & Veugelers, R. 2005. The role of academic technology transfer organizations in improving industry science links. Research policy, 34(3), 321-342.
Friedman, J., & Silberman, J. 2003. University technology transfer: do incentives, management, and location matter? The Journal of Technology Transfer, 28(1), 17-30.
Geroski, P., 2000. Models of technology diffusion. Research Policy 29 (4/5), 603–626. Hsu, D., & Bernstein, T. 1997. Managing the university technology licensing process:
Findings from case studies. Journal of the Association of University Technology Managers, 9(9), 1-33.
Lissoni, F., Lotz, P., Schovsbo, J., Treccani, A. 2009. Academic patenting and the professor's privilege: evidence on Denmark from the KEINS database. Science and Public
Policy, 36 (8), 595-607.
Lissoni, F., Montobbio, F., Seri, R. 2010. Ownership and impact of European University Patents, paper presented at the third DIME-BRICK Conference, Torino.
Lissoni, F., Sanditov, B., Tarasconi, G. 2008 (b). The Keins Database on Academic Inventors: Methodology and Contents Research Evaluation, 17(2), 87–102
Lissoni, L., Pezzoni, M., Poti, B., Romagnosi, S. 2013. University Autonomy, the professor privilege and academic Patenting: Italy, 1996 -2007. Industry and Innovation, 20(5), 399-421.
Phan, P. H., & Siegel, D. S. 2006. The effectiveness of university technology transfer. Foundations and Trends® in Entrepreneurship, 2(2), 77-144.
Radosevic, S. 1999. International technology transfer and catch-up in economic development. Edward Elgar Publishing.
Siegel, D. S., Veugelers, R., & Wright, M. 2007. Technology transfer offices and commercialization of university intellectual property: performance and policy implications. Oxford review of economic policy, 23(4), 640-660.
Siegel, D., Waldman, D., & Link, A. 1999. Assessing the impact of organizational practices on the productivity of university technology transfer offices: An exploratory study (No. w7256). National bureau of economic research.
Siegel, D.S., Waldman, D., Atwater, L., Link, A., 2001. Toward a Theory of the Effective Transfer of Scientific Knowledge from Academicians to Practitioners: Qualitative Evidence from the Commercialization of University Technologies. Mimeo, University of Nottingham, Nottingham, August 2001
Thursby, J.G., Kemp, S., 1998. An Analysis of Productive Efficiency of University Commercialization Activities. Mimeo, Purdue University, Purdue, May 1998. Thursby, J.G., Thursby, M.C., 2000. Who is Selling the Ivory Tower? Sources of Growth in
CHAPTER I
DO ITALIAN UNIVERSITIES PATENT “ENOUGH”?
Performance of Italian Universities in comparison with other Countries
Abstract
The present research aims at analysing the performance of Italy within the International context in terms of the development of University patent applications and factors affecting the mechanisms of patenting in Italy, mainly through the evaluation of the innovation indicators represented by patents. Such an analysis is carried on taking into account possible variables having an influence on this process and that may be reflected by the obtained results. Our analysis departs from previous studies conducted in this field, both in the comparison between patenting activities of researchers operating within University or Research Centres in different European countries, and in the influence of legislation and strategy related choices on the effectiveness of technological transfer.
The patent activity of Italian Universities results not very numerous in comparison with other countries but Italian University patents are highly cited, thereby representing quality patents.
A critical final consideration is addressed to the results achieved in terms of academic patenting, hypothesizing the causes leading to the Italian position within the European context.
1. Introduction
Together with traditional teaching and research activities, university undertakes the so-called third mission with the aim of supporting economic growth, through the transformation of knowledge produced by research into knowledge for production purposes. Due to the centrality of such mission, scientific structures play a relevant role in the economic development process and become effective partners in
supporting the competitiveness of the industrial system, contributing to the improvement of economic and social conditions.
The principal indicator of compliance of the third university mission and the Universities transfer knowledge to the industry are graduates and Ph.D. students, the coding of knowledge in scientific publications, the activity of collaboration with projects directly funded by enterprises, the entrepreneurship of the student through the spin-off creation and the patent applications and licensing.
Patents represent a valuable source of information, unique in its nature, on the development of technological progress in time and space. However, during more recent years debate on the use of statistics on patents as a measure of the invention and innovation activity and, more in general, of technological progress, as an alternative or additional indicator (Earl, 2006) has been broadened and further developed. In the past years, several researchers have investigated the issues concerning the use of patents as innovation indicators (Pavitt 1984, Griliches 1998, Lanjouw 1998).
The only counting of patents could be misleading on the estimate of the innovative activity. For a correct use of patents as an indicator is important considering the patents in respect to the breadth of the patent family4 and the claims, indeed patents greatly differ in their technical and economic significance. While many of them reflect minor improvements of little economic value, others are extremely valuable and it is not easy to sufficiently ponder their value. Therefore, only patents represent an imperfect measurement of the innovation output.
To compensate for the limitations of patents as innovation indicators, the European Commission proposed, in 2013, a new criterion based on four components selected for their policy relevance:
Technological innovation, as measured by patents.
Employment in knowledge-intensive activities, as a percentage of total employment.
Competitiveness of knowledge-intensive goods and services.
Employment in fast-growing firms of innovative sectors.
4 A patent family is a collection of patent applications covering the same or similar technical content. The applications in a family are related to each other through priority claims.
However, despite these premises, patents are an extremely useful indicator of the technology development output, although we must consider them together with other components and take into account the following clarifications, in order to obtain a complete and detailed representation of the analysed context.
The value of the patent defined by its industrial application. The number of patents is an indicator of inventive activity, if it is considered together with the value of the single patent; therefore, for a realistic representation of the technological progress level, is important to use both indicators. Due to the high heterogeneity of patent values, it is not simple to measure the utility of a patent for its economic value. The average value of patents changes according to industrial/technological sectors, and it is, for instance, very high in the pharmaceutical field.
Another element to evaluate the economic importance of a patent is represented by its territorial extension. EPO or jointly granted EPO/USPTO patents are clearly more important than national patents.
For an analysis based on the patents’ value in terms of quality, the number of forwarded citations of a patent is counted5. In patent documents, examiners and applicants to qualify the degree of novelty and inventive steps of the patent claims, and represent an indicator of flows of knowledge from an inventor to another use citation. Correlation with the company market value is stronger for high-quality patents (highly cited). However also this method presents some limits, since several studies have highlighted that inventors from a specific country are more likely to cite other inventors from their same country rather than those from other countries; and that examiners tend to cite USPTO documents, implying the presence of more US firms and inventors (Jaffe and Trajtenberg 1999).
Therefore, the use of patents as an indicator of technology and innovation competitiveness of a country requires a general cross-interpretation of the different features of the patent, in order not to run into a superficial measure.
Furthermore not necessarily the number of patents is an indicator of high technological quality, instead, the contrary has been stated by some authors (Thursby; Thursby 2000), who came to the conclusion that the increase in the number
5 For more information for value of patent by citation in EU countries see Veugelers, R. et al, Callaert, J., Song, X., Van Looy, B.
2012. The participation of entrepreneurial universities in technology development: Do creation and use coincide? An empirical investigation on the level of national innovation systems. Economics of Innovation and New Technologies, 21, 5-6, 445-472.
of patents is not directly proportional to their quality. Henderson, Jaffe and Trjtenberg summarized such a phenomenon with the aphorism quantity up quality down to represent the phenomenon that has taken place in US, where the increase in the number of patents after the introduction of the Bayh Dole Act (1980) has not been supported by a similar citation growth, symptom of their lower quality.
Moreover, not all inventions are patented, several factors could influence the decision to file a patent despite the presence of an innovative output. Some authors (Arundel; Kabla 1998) have introduced the concept of patent propensity rates to explain the factors that may affect patent propensity (higher in big firms6). Certain legal requirements for an invention (novelty, nonobviousness and industrial application criteria) are required.
Not necessarily, innovations launched in the market have an intellectual property protection, since in some cases they may be lacking in one of the requirements and this prevents them from patenting. For instance, for European patents, a previous divulgation is enough to invalidate the novelty requirement. In the University context some researchers could prefer to publish quickly before to patent their invention, the "publish or perish” situation could be the cause of a lack of patenting activity in some. Furthermore, there may be reasons for the decision of not patenting an invention related to other patenting strategy aspects. Before requesting a patent grant it is essential to proceed with the strategic evaluation of costs/benefits of possible options. A patent may be difficult and costly to obtain, administer and protect.
Different legislation and changes in legislation and procedures is another variable that could influence the patent activity of a country. The mechanism of patenting may be influenced by the applicable legislation, which could guide or affect the choice of inventors, the filing policies and results of the analysis, through a series of regulations. An example of how patents regulation has to be considered in the comparison and evaluation of the different countries at a patent level is represented by the existing differences in Europe and United Stated regarding the patenting of certain intellectual property inventions, such as software and genetic sequences. Generally, in Europe, the patenting of software is considered admissible only where related to an industrial process, while in the United States, where the incidence of software patent filing is
6 Large firms are more likely than small firms to patent routinely, rather than carefully evaluating the need to patent each
innovation, as suggested in a study of patenting among Dutch firms (Arundel et al., 1997). This effect was linked to the presence of in-house patent expertise which reduced the cost of applying for a patent.
extremely high, it is not subject to such type of restriction. Similarly, genetic sequences tend to be considered not patentable in Europe.
Another clear example of how legislation may affect mechanisms of Innovation is represented by the case of United States, where the known Bayh-Dole Act, adopted in United States in 1980, is identified as a catalyst of the process of evolution of the mission of Public Research Institutes (Universities and Public Research Bodies), which have gradually assumed an increasingly direct and incisive role in the innovation and industrial development dynamics (Cohen, Nelson e Walsh, 2002; Gallini, 2002; Jaffe, 2000; Mowery et al., 2001). This provision, which substantially allowed universities to retain intellectual property rights (IPR) over inventions coming out of federally funded research, is considered responsible of the high increase in the American University patenting activity observed in the last 20 years (Siepmann, 2004).
Analyses on most recent US patenting investigate the effects of such a measure on the system of university patenting and more in general on the technology transfer system within the academic research.
It is evident that one of the main actors in the field of research is represented by the academic world, from which more and more often industry tends to glean, outsourcing the research and development stage, increasing and favouring technological transfer process through means such as licensing and patent assignment or the conclusion of research contracts.
Therefore, the analysis of patents represents a fundamental criterion of evaluation of the level of innovation and quality of Universities themselves, together with other indicators, such as the number of the spin-off, research contracts, incubators, connected with the university, scientific publications and technology transfer structures.
Furthermore, these indexes have become part of university performance evaluation. Some clarifications should be made about the Italian case. Until 2010 the overseas filing for the invention was subject to the release of an authorization by the Ministry of Economic Development, in accordance with such regulation, upon permit of the Ministry of Defence or at least at the effective date of ninety days from the filing date in Italy or the date of the authorization request. It was a regulation preserving the
interest of military authority towards such inventions, according to a criterion of “utility for the national defense”, aimed at avoiding that such type of inventions could be directly transferred abroad. In 2010 a modification introduced by the D. Lgs n.131/2010 has limited such restriction to the patents, which could be beneficial for the defense of the nation, abolishing it for patents result of international agreements validated with national law.
However, until that date, the adopted strategy in the patent filing had been certainly influenced by the existence of such prescription, inducing the owner of the invention to choose for the prior Italian filing, with clear consequences in terms of the position of Italy in the evaluation of the number of patents at a European level.
Regarding the IP legislation at a University level must be taken into account, since most European countries, from the end of the 1990s, have to change the legislation on IP moving from the inventor’s ownership of patent rights towards different systems of institutional ownership. The effect of such regulation regimes on the ownership of inventions, that will be further developed during this work, represents another factor to be taken in consideration when observing, describing and examining the mechanisms of patent filing, and when trying to understand and trace patents.
Contrary to the choices made by most European countries, in 2001 Italy change its legislation giving academic inventors the right to be patent holders, which so-called “professor privilege”.
This new law has had at least two effects. First, industries or inventors could own some Patents University invented. Second, the creation of TTO that offers specialised services leaving to the inventors a large share of revenues from the exploitation of IPRs in case they chose to give them to the university. Furthermore, there is not any evidence that the number of patent applications by inventors has increased (Cesaroni,
Piccaluga, 2005)neither encouraged academic patenting (Lissoni et al, 2013).
To conclude and confirm the importance of a relevant university patent activity we can see - fig. 1 – that the most renowned universities in the world (MIT, HARVARD, CALTECH, University of California) have a patent portfolio (years 2000-2012) higher than the average. This result is indicative of how a considerable patent portfolio may be an indicator of university participation to innovation, holding potentially transferable and market adoptable knowledge.
Fig.1 University Patent portfolio (year 2000-2012) by size
Data source World University Rankings
University*of* Califorinia* 0* 20* 40* 60* 80* 100* 0* 500* 1000* 1500* 2000* O ve ra ll' sc o re ' Number'of'patents' XL'universi6es' Caltech( 0,0( 20,0( 40,0( 60,0( 80,0( 100,0( 0( 50( 100( 150( 200( 250( 300( 350( 400( 450( O ve ra ll' Sc o re ' Number'of'patents' Small'Universi6es' MIT$ 0,0$ 20,0$ 40,0$ 60,0$ 80,0$ 100,0$ 0$ 100$ 200$ 300$ 400$ 500$ 600$ 700$ O ve ra ll' sc o re ' Number'of'patents' Medium'Universi7es' Harvard& 0,0& 20,0& 40,0& 60,0& 80,0& 100,0&
0& 200& 400& 600& 800& 1000& 1200& 1400& 1600&
O ve ra l's co re ' Number'of'patents' Large'Universi7es' Universities Universities Universities Universities
2. Research objective and background
Given the meaning and the importance of the innovation indicator represented by patents, we have asked ourselves whether Italian universities patent “enough” compared with those of other countries. Behind this research question, there is the will and intention of investigating to what extent Italian universities contribute to Italian Innovation: the analyses carried out on this issue attest that these have lower performances compared with Universities of other countries (Lissoni et al. 2013). In our research we don’t analyse the university patent performance in absolute term but only in comparison with other countries trying to normalize the result for the same factors that could influence them. The number of patents for Italian Universities could be already “enough” for the Italian context and adequate for supporting the country innovation activity but we don’t deal with this aspect and considerations in our research.
Starting from results achieved by the above mentioned work, we attempted to provide a wider interpretation of university patenting activity, trying to normalize previous results with certain variables such as the heterogeneity of scientific areas and any other factors that may influence results of the analysis, asking ourselves which could be the factors having an impact on the above mentioned activity.
Our research necessarily moves from the number of University-owned EPO Patent applications. The choice of analysing EPO patents is based on the consideration that such patents have a higher economic value than national patents and that comparison with the activity of other countries in terms of patenting is more reliable.
However results achieved by a considerable number of empirical studies have shown that university owned patents do not give a complete picture of university engagement in innovation. In years 1994-2001 research groups in several European countries7 have attested indeed that professors or academic researchers have
7http://www.esf-ape-inv.eu/index.php AUSTRIA (University of Vienna, Markus Guenther); BELGIUM (Katholieke Universiteit, Leuven, Bart Van Looy, Universitè Libre de Bruxelles, Bruno van Pottelsberghe de la Potterie, Malwina Majer); CROATIA (The Institute of Economics, Zagreb, Sonja Rada); DENMARK (Copenaghen Business School, Peter Lotz); FRANCE (Bureau d’Economie Théorique et Apliquée (BETA), Strasbourg, Patrick Llerena, Christian Martinez Diaz, Centre Economie De la Sorbonne (CES), Paris, Lorenzo Cassi, L'Oreal, Paris, Anne Mazzucotelli, Organisation for Economic Co-operation and Development (OECD), Paris, Helene Dernis Observatoire des Sciences et techniques (OST), Paris, Ghislaine Filliatreau, Jacques Mairesse, Valerie Merindol, Thierry Weil, Michel Zitt, Gretha – Université Bordeaux IV, Nicolas Carayol); GERMANY,Bielefeld University, Christian Stummer, Fraunhofer Institute Systems and Innovation Research, Karlsruhe, Rainer Fritsch, Ulrich Schmoch, Nicole Schulze, Institute of Innovation Research, München, Karin Hoisl, Technische Universität München, Anja Shon, University of Kassel, Guido Buenstorf); ISRAEL, Tel Aviv University, Gil Schift); ITALY Istituto di ricerca sull’impresa e lo sviluppo (CNR/CERIS), Torino/Roma, Bianca Poti, Secondo Rolfo, Sandra Romagnosi, Università Bocconi (KITES), Milano, Monica Coffano, Francesco Lissoni, Michele Pezzoni, Gianluca Tarasconi, University of Camerino, Grid Thoma, University Milano-Bicocca, Andrea Maurino); NETHERLANDS
contributed to patents filed in those years although assignees were firms and not university. Such investigation aimed at verifying the academic contribution (academic invented patents) in terms of Innovation, also for those patents implying the engagement of professors, in spite of not being university owned. Patents have therefore been re-classified patents by inventor, and the inventor’s names have been matched with those from university faculties, producing the first estimates of academic patenting in several European countries. The main objective of this project was to produce a freely available Database on Academic Patenting in Europe (APE-INV Database), containing reliable and comparable information on the contribution of European academic scientists to technology transfer via patenting, and that researchers will be able to update in the future. However, such analysis has been so far developed only by certain countries and is at present updated to 2001.
For further details regarding APE-INV 1994-2001 methodology and realization of the Database, see “University autonomy, the professor privilege and academic patenting:
Italy, 1996-2007” by Lissoni et Al. 2013.
Another research project followed the previous one, starting from the APE-INV database and producing the KEINS database on academic inventors, which contains detailed information on university professors from France, Italy, and Sweden. These appear as designated inventors on one or more patent applications registered at the European Patent Office (EPO), in the period 1978-2004. For the methodology, refer to Lissoni, Sanditov and Tarasconi (2006).
The results of this analysis show that Professor’s Privilege doesn’t encourage patent applications.
The researchers working on this project in their results did not achieve a clear and univocal explanation and conclusion on the emerged trend, although they hypothesized that:
(Maastricht University, Mei Ho, Bart Verspagen); SPAIN Carlos III University, Madrid, Carlos Olmeda Gomez, Neus Palomeras, Centro de Ciencias Humanas y Sociales Instituto de Polticas y Bienes Publicos (IPP) – CSIC, Madrid, Kenedy Pedro Alva Chavez, Elena Corera Alvarez, Gemma Derrick, Catalina Martinez Garcia, Natalia Zinovyeva.
INGENIO (CSIC-UUPV), Valencia, Joaquin M. Azagra-Caro, Institute Documentary Studies about Science and Technology, Madrid, Borja Gonzalez-Albo, Antonio Gonzalez-Molina, University of Barcelona, Ernest Miguele, University of Leon, Liliana Herrera, Universitat Pompeu Fabra, Barcelona, Christian Fons-Rosen); SWEDEN, Institute of Innovation and Entrepeneurship of Gotheburg, Evangelos Bourelos, Maureen McKelvey); SWITZERLAND, École Polytechnique Fédérale de Lausanne, Stephane Lhuillery, Julio Raffo; TAIWAN( National applied research Laboratories, Taipei, Chin-Yuan Fan); USA Georgia Institute of Technology, Hsini Huang Harvard Businnes School, Ronald Lai, Amy Yu).
It is not due to lack of funds, since there has not been any R&D decline in higher education and public laboratories.
Reduction of collaborations university-industry.
University ownership depends firstly and foremost on the nature of research funds (public vs. private), followed by university strategies (as measured by the adoption of IP statutes and a few, significant university dummies).
The introduction of dedicated Technology Transfer Offices (TTOs) seems not to have exerted any positive influence, with the specification that the available TTO data hide a great heterogeneity in terms of size, experience, and, possibly, IP strategies.
The professor’s privilege has failed to increase academic patenting and has not even increased individual ownership.
Universities in France, Italy and Sweden do not contribute less than their US counterparts to national patenting activity. Instead, these are less likely to reclaim the property of the patents they produced. One reason for this lower propensity has certainly to do with the different IPR arrangements that regulate the relationship between funding agencies (such as the CNR in Italy and the CNRS in France) and the University, whereas the Bayh-Dole Act allows US universities that received funds from the National Institute of Health or the National Science Foundation to retain such IPR. (Lissoni ed al., 2013).
Regarding the financing of R&D at University is useful to introduce a framework of Italy and some key data in the years of the analysis8. The gross domestic expenditure on research and development (GERD) was nearly 21 billion euro 1.26 percent of Italy's GDP less than half of Europe 2020 targets (3%). (R&D intensity in Italy increased around 2.3 % annually over the 2000-2009 period, passing from 1.05 % of GDP in 2000 to 1.27 % in 2009). In 2009, public R&D intensity was 0.57% and private R&D intensity was 0.64%. The difference between Italy's R&D intensity and the EU-average (1.90 %) is mainly due to lower industrial R&D (0.64 % versus to an EU-27 average of 1.23 % of GDP). The problem of very low business investment in R&D is
8 Source: DG Research and Innovation - Economic Analysis Unit. Data: Eurostat, DG JRC - ISPRA, DG ECFIN, OECD, Science Metrix
partly linked to the structural composition of the economy which has a low share of high-tech industries in total manufacturing, and the small size of Italian firms, 95% of which are small or micro-enterprises, that aggravates this situation (bearing in mind also the large differences between the North and the South of the country). There is also a low presence of foreign-owned firms, which has remained unchanged over the period 2001-2008. In fact, for the same level of public investment some countries excel more than Italy at science and technology (S&T), the R&D intensity increased a trend towards a specialisation in low technology-intensive products but only to reach levels that remain very far from those of the countries at the technology frontier, thus suggesting in particular measures to support innovation and more specifically SMEs. The economic structure of Italy has a relatively low concentration of intensive sectors. In particular technology production and the share of knowledge-intensive services in total service, export is clearly lower than the EU average. This effect concerns mainly the R&D-based innovation, as the Italian economy consists to a large extent of low knowledge-intensity sectors: e.g. footwear, textiles and clothing and mainstream manufacturing industries such as fabricated metal products, domestic appliances, and bicycles. However, Italy also has some specializations in technology-intensive sectors such as machinery, automotive and aerospace.
Also the economic impact of innovation -composed of five of the Innovation Union Scoreboard's indicators -shows this gap equal to 0.556 for Italy and 0.612 EU average. Between 2000 and 2010, the total number of researchers (FTE) per thousand labour force has grown at an average annual rate of 4.2% but is still well below the EU average highlighting the need to enhance the quality of the higher education system and to improve the correspondence between curricula and labour market needs. However, Italy is suffering a net outflow of students and engineers to the United States but together with Germany, France and the United Kingdom, Italy is among the highest producers of cross-border scientific co-publications (in absolute numbers). Italy has registered good progress on all the Europe 2020 targets with the exception of a slightly falling employment rate, evident since the start of the economic crisis in 2007.
3. The analysis
Starting from these results, we could define the position of Italy from 2000 to 20129 attempting to develop the following analyses, hypotheses and conclusions.
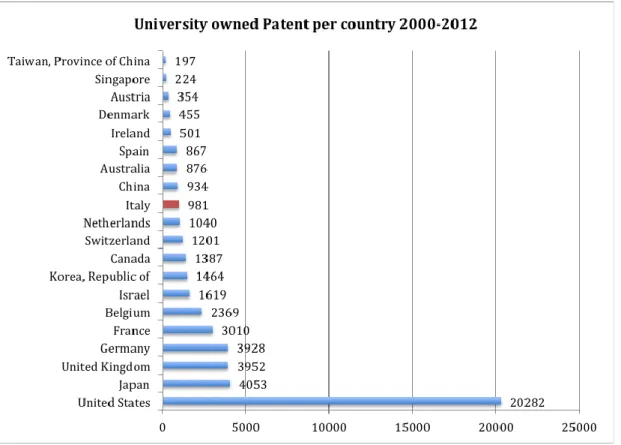
First, we analysed the number of Italian University owned Epo patents (where universities are assignee/owner) in comparison with other countries. Patent data have been extracted from PATSTAT DATABASE on September 2014, corresponding to the following application years 2000-2012.
Fig. 2 University owned Epo patents per country 2000-2012 Source PATSTAT DATABASE
Italy is positioned 12th in the worldwide ranking, quite far to the medium of 2484 following all countries, which are much smaller in terms of size, economy, and population, as Switzerland and Denmark, Belgium Israel in this respect – and Canada is smaller in terms of population.
When analysing university patent performance, several control variables should be taken into account, especially in order to normalize the different legislation and
9 The source of data is PATSTAT DATABASE and the data were extracted on November 2014, we decide to analyse the period 2000-2012 because is really representative of the patent applications for year, considering the secret period of a patent (18 months from filing).
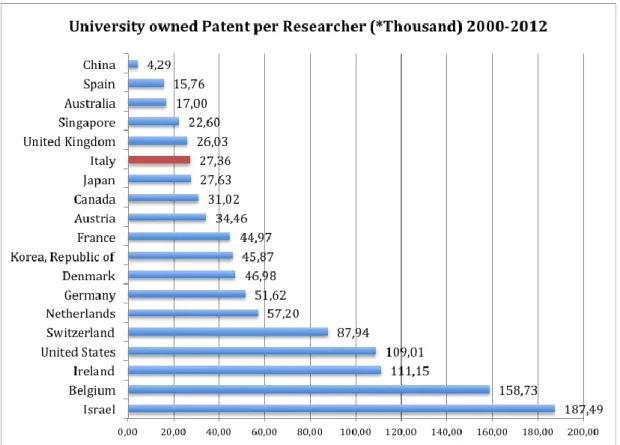
patent procedures that may influence the results in the different countries. These data were thus normalized by Researcher10 and GDP but the position of Italy in the ranking results to be even worst (14th per Researcher and 22nd per GDP).
Fig. 3 University owned Epo patents per Researcher 2002-2012 Source: Patent PATSTAT DATABASE
Researcher dataset Unesco Science, technology and innovation Researchers (FTE) - Higher education
Average 58,27 Median 39,72
First of all, observing Italian data, the portion of overall patents attributed to Universities, the relation between the number of patents and the researcher reveals serious gaps compared with other countries. Such empiric evidence confirms the modest capacity of the university to patent inventions and to translate the results of research in a mean potentially transferable to the market.
Clearly Italian universities have contributed, in the last ten years, to the Innovation output to a significantly lesser extent than their counterparts in other advanced economies. Therefore, Italian university has a lower propensity to patent compared
10 Researcher dataset Unesco Science, technology and innovation Researchers (FTE) - Higher education. The number of
with technologically more economically developed countries. Although we have not focused on the average value of patents, this first numerical result already appears to be symptomatic of a weakness of Italian Universities in terms of support to Innovation and knowledge transfer. We thus attempt to investigate the reliability of these results, the causes, correlations and variables.
4. Does the ranking differ when adding government research centers such as CNR?
Data Source:
Application University owned patent_ Patent owned by Gov: Ecoom data- Patstat 2000-2012 Population: OECD data average 2000-2012
Attempting to answer our main research question, we investigated if patent ownership is on the head of applied research Public Research Institutions (PRIs11) instead or more than University.
Generally, in Europe, universities and public research institutions (where PRIs include government research laboratories and establishments engaged in activities such as administration, health, defence, and cultural services, public hospitals and clinics12) represent the two main actors in the public research system.
PRIs substantially constitute that part of public research not identifiable with university, having the task of developing research activities in the main sectors of knowledge and applying them in technological and scientific fields. Public research institutions are a primary tool for governments seeking to spur research and innovation in their economies. PRIs remain critical for innovation and economic performance of countries through their activities in creating, discovering, using and diffusing knowledge. Their structures, functions and performance are diverse across countries, and their activities vary according to their mission and type.
11 As Universities, these are: - juridical Institutions through which Public administration carries pout its administrative function
to pursue public interest. - have access to public funding- are usually monitored by the Ministry of Education
12 OECD (2011), Public Research Institutions: Mapping Sector Trends, OECD Publishing.
We believe that PRIs should be included again within the activities of university patenting since both connections and collaborations with university research are intense and frequent.
An empirical demonstration of this synergy has been presented by the research carried out by Balconi, Breschi and Lissoni (2003) on Institute owned patents signed by professors between 1979 and 1999, revealing that 86 CNR patents on a total number of 151, were signed by University Professors
For these reasons, the number of University patents has been summed up to the complete patent portfolio of public research institutes– per capita for the same years: 2000-2012.
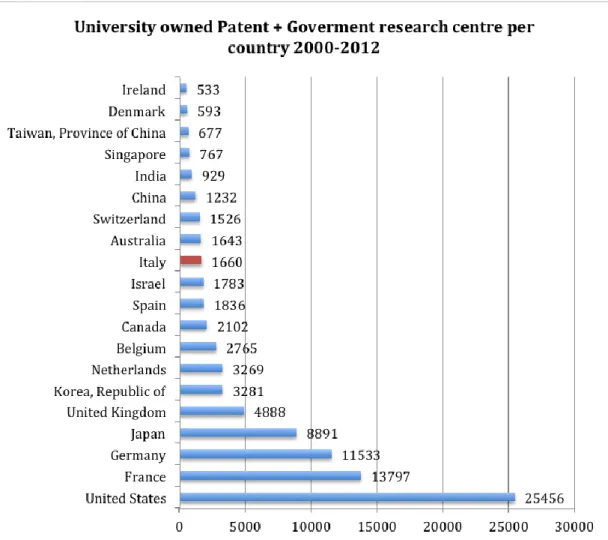
Fig. 4 University owned Patent + Government research centre per country 2000-2012 Source: Patent Ecoom data- Patstat
average 4.458,05- 5% median 1.809,5 - 2,3%
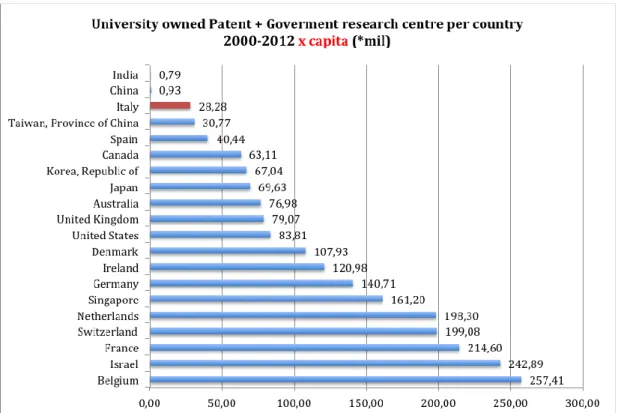
Fig. 5 University owned Patent + Government research centre per capita 2000-2012 Source: Patent Ecoom data- Patstat - Population: OECD data average 2000-2012
The analysed data reveal that central, northern European and Mediterranean countries (Italy, France, Germany and Spain) attribute to research Institutes a relevant role, while in other countries, of primary importance in the field of research at a European level (United Kingdom, Sweden, Switzerland), public research is mainly exclusive prerogative of University Institutions.
Providing for comparison between the total ranking based on all the patents owned by Universities and Research Institutes and the ranking based on the solely University-owned patents, a worsening in the positioning of Ireland, Denmark, USA and UK may be observed. France, on the contrary, improves its position of 8 points, being placed at the third position in the ranking of the analysed countries, whereas adding the patent activity of Research centres to German and Spanish University patents contributes to an escalation of only two positions.
In spite of the undeniable contribution of research centres in France, Germany, Spain, and Italy, combining the Italian PRIs patent portfolio with University patents, Italian placement does not register any relevant increase, remaining at the 18th place (per
Analysing the specific Italian case, it may be observed that CNR is the EPR owner of the great part of the patents (187, and to these 15 patents owned by the INFM, the National Institute for the Physics of Matter, could be added), followed by the National Institute of Health (39), the Italian National Agency for New Technologies, Energy and Sustainable Economic Development, ENEA (33) and by the IRCCS, the National Cancer Institute (22).
Furthermore, it must be taken into account that CNR plays the role of coordinator of Italian scientific and technological policy, managing the main means of the oriented research (mission-oriented), such as the projects aimed at guiding the public research developed in Universities and public laboratories towards a practical application, and National Research Programs aimed at supporting Industrial Innovation. It has also introduced a constant promotion of the commercial exploitation of the patent patrimony.
However, despite the relevant contribution of CNR to Italian patenting, since this Italian Public Research Institution owns the higher number of European and American patents and has constantly promoted the commercial exploitation of the patent patrimony, its activity does still not make Italy competitive enough. Other countries included in our research, present a high increase of their patenting activity, thanks to the inclusion of such research centres, with specific PRI groups with a clear industry orientation, such as Belgium, with its Excellence Centres, Innovation Networks and Collective Research Centres aimed at the industrial application, or France, where over 58% of Government intramural expenditure on R&D (GOVERD) activity has been in applied research (2007). In this latter country, basic research also increased, while Italy has reduced its basic research activity in the government sector, falling from 46% in 1998 to 40% in 2006.
5. Academic patenting. Is the ownership of Academic patenting somewhere else?
Application University owned patent_ Patent owned by Gov: Ecoom data- Patstat Academic invented: % KEINS DATABASE_ Lissoni 1994-2001 and EPO-INV
After the normalization of data and reassessment of the results on the basis of the researcher and the GDP, adding the data related to research centres, we wondered which could be the other factors that may affect the results of the analyses on the number of patents, starting from the distinctive features of the regulatory systems in force.
The issue on the subsistence of different legal regimes in the distribution of University and PRIs’ research related IPR has been already introduced. Since the end of the 1990s, most European countries have changed the IP legislation, moving from the inventor’s ownership of patent rights (Professor’s privilege) towards different systems of institutional ownership. This shift was mainly based on the objectives of policymakers to create conditions similar to US, where the 1980 Bayh–Dole Act allows universities to retain intellectual property rights (IPR) over inventions coming out from federally funded research. Only in Italy and Sweden the current legislation provides a professor’s privilege regime since 2001/2005 and 1949 respectively. The Professor’s privilege is the regime implies that the results of publicly-funded research created or developed by researchers (professors) are owned by the researcher (professor) himself and not by the institution where the research has been carried out.
On the contrary institutional ownership entails that the results of publicly-funded research are owned by the institution employing the researcher/professor responsible for the work, and not the individual(s) directly.
In Europe, the professor’s privilege, prevailing in the German-speaking and Scandinavian countries, allowed university professors to retain patent and utility model rights over their research results, while the inventions of scientists employed in public research laboratories or private industry belonged by default to their
employer. Denmark was the first country to decide in 2000 to abolish the professor’s privilege in favour of institutional ownership, followed by Germany, Austria, Norway and Finland, in the period 2001-2007 (Kilger and Bartenbach, 2002; PVA-MV, 2003; Iversen, Gulbrandsen and Klitkou, 2007, Lissoni et al., 2009).
Many academics studying the research and development dynamics have investigated the type of repercussions that the legislation on the ownership of industrial finds could have both in terms of strategies and effectiveness of strategies in technology transfer mechanisms and on data and patenting data analysis. It is not easy to assess the impact of regulation changes and policy interventions on the patenting output of European universities.
The need to count patents originating from university research, the ownership of which is attributed, due to the legislation in force, by University to third parties, such as the researcher himself, or in the great part of cases, firms, arose. Such need has been primarily perceived in those countries, such as Italy, where the ownership of the patent remains with the researcher, according to the Professor’s Privilege mechanism.
A complicated operation led several research groups13 to define a methodology and elaborate patenting data in order to create a database of the so-called “invented” patents, i.e. of those patents originated within University, where the inventor is a University researcher.
The identification of academic patents requires first and foremost the reclassification of all patents by inventor names. To this purpose we availed ourselves of results achieved by the researchers led by Francesco Lissoni who could enumerate academic patents for years 1994-2001 for certain countries (Austria, Belgium, Croatia, Denmark, France, Germany, Israel, Italy, Netherlands, Spain, Sweden, Switzerland, Taiwan, US), among which those with the Professor’s Privilege.
As a result of this analysis of the EP- INV database, allowing to extract the number of university professors owning a patent, has been created. More specifically, the EP‐INV dataset is part of the broader EP‐CESPRI database, containing information on over 1500,000 patent applications at the European Patent Office (EPO) from 1978 to 2002. The methodology followed to enumerate the invented patents is extensively described by Lissoni et al. (2006).
Following the EP-INV database another dataset has been created: the KEINS, which contains all EPO applications (1996/2007), reclassified by applicant and inventor, and from several lists (PROFLISTs) of university professors of all ranks (from assistant to full professors), one for each of the included countries. Academic inventors have been identified by matching inventors’ names and surnames in the EP‐ INV database with those in the PROFLISTs, and by checking the identity of the matches through e‐mail addresses and phone numbers, in order to exclude homonyms (Lissoni et al., 2006). The KEINS database contains detailed information on university professors from France, Italy, Netherlands and Sweden, and it was extended to Denmark.
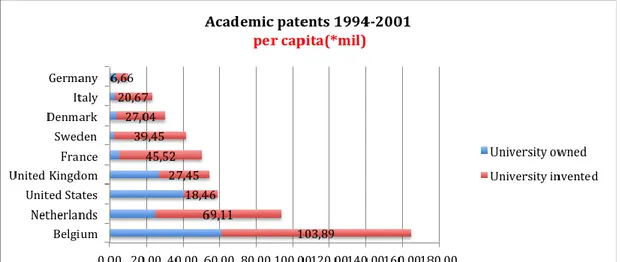
Fig. 6 Academic patents 1994-2001 per capita (*mil) Source: University owned Ecoom data- Patstat
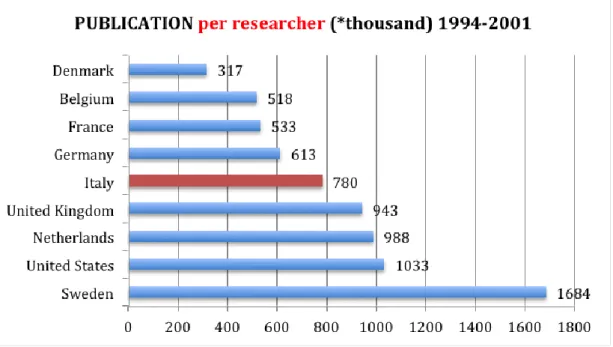
Fig. 6 a Academic patents 1994-2001 per researcher (*thousand) Source: University owned Ecoom data- Patstat
Academic invented: % KEINS DATABASE_ Lissoni 1994-2001 and EPO-INV
Researcher: Unesco Science, technology and innovation Researchers (FTE) - Higher education
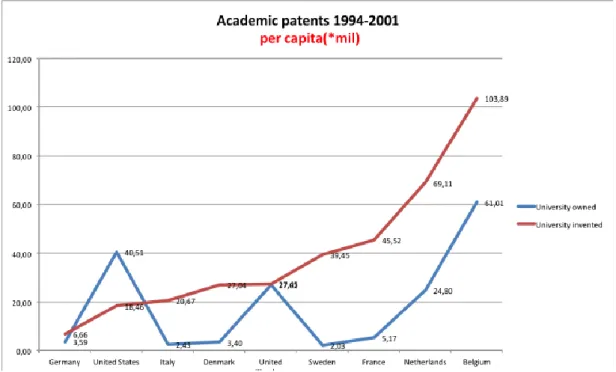
Fig. 7 Academic patents 1994-2001 per Capita (*mil) Source: University owned Ecoom data- Patstat
Methodology Clarifications
For methodology reasons and due to the data availability, our comparative analysis is circumscribed to 9 countries (US, UK, Belgium, Netherlands, France, Germany, Italy, Denmark and Sweden). Extracting university owned patent percentages from analyses previously carried on in the mentioned literature, it has been possible to derive the number of academic invented patents for the mentioned countries.
For countries as Italy, Netherlands, Sweden and France we have included data originating from analyses carried out by Lissoni et al (2008) in years 1994-2001. As regards Belgium, basing on the available data, we calculated that the 37% of academic invented patents are university owned. This percentage results from the analysis of data obtained for the Flemish and French parts; more specifically, from affiliation results of ECOOM – Patstat emerges that 140 patents are owned by Universities of Wallon. Using data provided by the analysis carried out by Malvina Mejer (2013), indicating that in years 1994-2002 (one year more than our analysis) the 33,2% of the invented patents in French Universities of Belgium are owned by those Universities, we obtained the total percentage for Belgium.
For Germany, we used data made available by Beunstorf (2008), including all University invented patents until 2002 and showing University ownership at 33% of the academic patents in that country.
For Denmark, the KEINS database has been extended to academic patenting for years 1994-2003.
For the US we included data for patent/inventor pair from Thursby et al 2009, which include in the count no profit organization and unassigned patents.
For the UK we considered data collected by Guarisco (2009) who states that UK Universities retain over one-quarter of their scientists’ patented inventions, more than the double of any other European country here considered.
However, it is necessary to notice that, for each country, in the KEINS database the PROFLIST comes from different sources, a mix creating some problems in the comparison among countries (see Lissoni et al. 2008). In particular, for Italy there are professors, assistants, associates and full active in 2000; for Germany junior researchers (doctoral students and postdocs, etc) and technical staff are excluded, as well as professors working in PRIs and individuals employed in teaching positions (such as lecturers); Denmark covers all teaching staff definable as academic in two different years (2001-2005) excluding doctoral students. In UK “professors” are individual scientists, but also non tenured scientists (such as research fellows, readers, lecturers) are considered; as regards Sweden, academic staff including nontenured staff, such as professors, senior lecturers, associate professors, junior lecturers or assistant professors. In France, tenured academic staff as well as maitres
de conference have been included in the ranking as professor’s active in 2005.
Generally speaking, the PROF list does not include Ph.D. Students or Postdoc researchers. Therefore, scientific activity in terms of patenting could be underestimated and there could be relevant differences among the investigated countries in terms of performance.
The results from the data comparison for University owned and University invented patents show that, indeed, in absolute terms, especially in countries as Sweden, France and Denmark, the percentage of patents attributable to University research, but owned by other subjects than University, is extremely high, reaching the 90/95%. However, when comparing with other countries and normalizing per capita, Italian contribution does not turn out to be so performing compared to the other countries presenting an average number of 28 patents per million inhabitants. In contrast with countries as Belgium, where the overall patenting activity in the field of institutional research appears clearly higher, with an average number of 180 patents per million inhabitants.
In any case, in general terms, researchers in the field, who in the latest works have redimensioned the entity of the legislative factor, are still evaluating the influence of legislation on patenting activity and subsequently on University Innovation capacity. Basing on the analysis of the US experience and on the study of the effects of the Bayh
Dole Act on patenting activity of northern American Universities, although most European policymakers appear to be convinced that there is a strong causal link between these phenomena (OECD, 2003), using this evidence to justify changes to IP regulations in several European countries.
Several empirical studies have recently suggested that the increase in patenting by US universities in the 1990s was only partially due to this piece of legislation (Mowery et al., 2001; Rafferty, 2008).
In their study Aldo Geuna and Federica Rossi (2011) find that in spite of a cross-country evidence for an overall increase of university-owned patents, we cannot ascribe this phenomenon only to changes in IPR legislation, since the switch to university-ownership systems has been accompanied by other changes. These are mostly related to the construction of a knowledge transfer infrastructure based on universities and TTOs, but include bodies such as competence centres and regional patent support offices, and to a cultural change towards an “entrepreneurial” university model, which considers the engagement of academics in commercially-oriented transactions as “acceptable” (Clark, 1998; Etzkowitz, 2002). It is extremely difficult to disentangle the impacts of these processes. The greater relevance of policy incentives and cultural change compared with the switch to institutional IPR ownership is supported by the evidence of Italian increase in university-owned patents, although Italian legislation had moved towards the professor’s privilege (Baldini, Grimaldi and Sobrero, 2006).
More generally, empirical studies on European countries agree that the increase in university patent ownership is due to a complex set of interrelated causes, among which a formal patent rights regime plays a limited role, while the activities of TTOs, the changes in attitudes and the entrepreneurial culture at universities play extremely important roles (Geuna and Muscio, 2009). Klitkou and Gulbrandsen (2010), as well as Baldini, Grimaldi and Sobrero (2006) suggest that university bylaws are important determinants of the patenting activity, since even in the countries with professor’s privilege. it is possible to override national regulations in order to negotiate different IPR arrangements with third parties, for example, in case of research conducted jointly with external partners such as private companies. These