Volume 2013, Article ID 368529,7pages http://dx.doi.org/10.1155/2013/368529
Research Article
A Structural Equation Model for Analysis of
Factors Associated with the Choice of Engineering Degrees in
a Technical University
Antonio Hervás,
1,2Joan Guàrdia Olmos,
3Maribel Peró Cebollero,
3Roberto Capilla Lladró,
1and Pedro Pablo Soriano Jiménez
11Universitat Polit`ecnica de Val`encia, 46022 Valencia, Spain
2Instituto Universitario de Matem´atica Multidisciplinar (IMM), 46022 Valencia, Spain
3Institut de Recerca en Cervell, Cognici´o i Conducta (IR3C), Facultat de Psicologia, Universitat de Barcelona, 08035 Barcelona, Spain
Correspondence should be addressed to Antonio Herv´as; [email protected] Received 21 May 2013; Accepted 2 July 2013
Academic Editor: Rafael Jacinto Villanueva Mic´o
Copyright © 2013 Antonio Herv´as et al. This is an open access article distributed under the Creative Commons Attribution License, which permits unrestricted use, distribution, and reproduction in any medium, provided the original work is properly cited. Many different factors are taken into account by students when choosing a degree and university. Some of these are general considerations, such as the quality of the degree course (ratio of available places/places in first choice, cut-off mark, etc.), while others are subjective factors (e.g., friends doing the same course). This paper presents a partial multivariate model that considers the weight of the different variables linked to this decision, as identified in the bibliography. We analyzed four samples of first-year students (total𝑛 = 1790) from different engineering degree courses at the Universitat Polit`ecnica de Val`encia (UPV) in the 2010-2011 and 2010-2011-2012 academic years. All the students involved in the study had chosen this university and their courses as their first option. The overall effect shows that the structural model adjusts reasonably well to the different engineering courses analyzed. Similarly, the individual models for each engineering degree manage to identify the different effects involved. In the case of the engineering degree based on new technologies (ICT), the statistical effects are much greater and more statistically significant than in the other three branches of engineering considered. Social and individual factors were seen to have more impact on the choice of ICT degrees at the UPV.
1. Introduction
The question of which factors determine a student’s selection of university and degree course has been the subject of debate for some time. Many specialists have opined on the subject with more or less structured inputs and empirical contributions to justify their positions.
It is easy to obtain questionable but often-repeated evidence on the criteria used in selecting a university and study course. Arguments such as “my friends are also going,” “It’s close to home,” or the well-known “the cut-off is low” are often cited. Studies such as those pub-lished by the Universidad Antonio de Nebrija (2001) (http:// www.nebrija.com/servicios/publicaciones.php) or the Uni-versitat Oberta de Catalunya (2001) (http://elcrps.uoc.edu/ ojs/index.php/elcrps) show how most students use this type
of argument at the expense of those that academic special-ists would prefer them to use. These arguments must be understood in the Spanish social context, in which the family relationship is very strong, and usually university student, over 76.6% at UPV, live with their parents, and the homes and apartments for rent are used by students whose families live far from the university.
This issue has also been raised in Europe, where the universities (and even more so the universities of our immediate environment) have found that new students are highly motivated but are somewhat lacking in the nec-essary capacities. The European Access Network (EAN) (http://www.ean-edu.org/), for example, has been very active in this field. In the USA the tradition is very similar with the “slight” difference that recruitment systems are suppos-edly competitive but are ultimately based on the financial
resources of prospective students, very different from our policy of scholarships and student grants. In our system grants play a social role, while in the USA there is a policy of recruiting talent, as has been shown by Murphy and McGarrity [1] in a descriptive study of 350 American colleges. Their conclusions have been verified by other authors, who also found this vision of college selection as the key to the future of students. Supporting evidence for this position can be found in the Hispanic Association of Colleges and Uni-versities (http://www.hacu.net/), whose aim is to incorporate Hispanic minorities in the American university system, based on the quality of the system and the “trust” in the university. The situation described by Murphy and McGarrity is similar to the present situation in Spain and, as we have already said, can be clearly seen in some proven schemes, as in the case of Engineering [2] or that of women in certain degrees [3] or in exclusion-prone groups such as ethnic minorities [4].
Most authors agree on the relationship of the factors that determine the selection of a college or university and these are clearly identified in some of the works cited, as in [4]. In fact, they are consistent with many of those proposed some time ago in various forums and have even been included in the general documents of the European Students Union (http://www.esib.org/) to establish unsys-tematic models, somewhat more phenomenological than demonstrable. Many of the proposals are similar in type. First, it is considered that the demand for a degree and a university has a direct relationship with a factor generated from the subjective perception of this degree by students and their environment. The ratio between places and the demand for first choice is established from indirect indicators, as shown by the consolidation of the faculties and degrees most in demand. In more specific models, a certain longitudinal effect is admitted, so that the ratio between supply and demand in previous years is taken into account in the subjective perception of the present situation.
The Spanish public university admittance system is a relatively simple one. Prospective students range from those who have obtained the highest to those with the lowest acceptable grades. The condition is that there is a minimum requirement to access the system, so that only those who have successfully passed the preuniversity (high school or Baccalaureate) stage are eligible for consideration in the place allocation process. Those who have successfully passed high school and also a common university entrance exam, known as the Prueba de Acceso a la Universidad (PAU), can apply for a place at any university in the public system. The access grades of students considered for admittance consist of a weighted linear combination of the average grade of all high school subjects and the average marks of subjects taken in the PAU. The system of access grades means that all students seeking a place at a public university can be ranked from the highest rating to the lowest and that places can be systematically assigned according to the preferences of the students. This ensures that no student gets a place in the public system with a lower entrance grade than another student who would not have been admitted to the same degree course. It sometimes happens that when the time comes to assign a place to a student and due to his/her
access grade there are no vacancies for the specified course or university. In such cases of students they are assigned their second option, or third if the second is not feasible due to lack of capacity. However, recent data from the Spanish universities admittance system shows that more than 92% are assigned their first choice and 98% one of their first three options. Finally, the access grade of the last student admitted to a given degree course establishes what is known as the cut-off mark, that is, the qualification below which a place cannot be obtained in the public system for that degree and university; fortunately, in Valencia, 80% of students are admitted to their first choice.
Obviously, the number of places available for the different degrees and universities and the applications received are the mechanisms that define the cut-off mark, so that a high demand coupled with limited places carries high cut-off marks, and likewise the degrees widely on offer with a low demand imply low cut-off marks. In no case does the level of the cut-off mark reflect the perceived difficulty of the degree or any other circumstance that is not strictly the relationship between supply and demand. Similarly, the number of first choice applications for a certain degree and university is a good indicator of these universities’ capacity to attract students.
Other studies, such as Capilla [5], Ting [6], Huang and Fang [7], and Veenstra et al. [8], also see the demand for a university course as a very nonspecific assessment of the “social value” given to the degree and also to the univer-sity. This more qualitative or more subjective perception is constructed from certain parameters such as the absolute value of the cut-off mark in the application process, since it is used socially as an indicator of quality in sought-after degree courses, but not in degrees with a low demand and cut-off mark. No one doubts the difficulty of a college course in mathematics, but few consider its cut-off mark. Only when the available places are scarce the cut-off mark is used as an indicator of quality. The relationship between both factors is clear and some authors, like the aforementioned Ford, [4], attribute most of the variance to it, focusing on aspects such as the perceived utility of the degree. Such a proposal coincides with some contextual data. For example, the utility data offered by the Quality Agency of the University System in Catalonia (http://www.aqu.cat/) indicate that most students and parents attribute utility to many degrees that are not in fact in great demand by employers (such as computer science, e.g.). These subjective perceptions, in the opinion of these authors and also in ours, are decisive when selecting a university and course of studies. Similarly, some unsystematic data that has appeared in forums and seminars points to the existence of personal factors in this process, such as geographical issues, transport, gender, vocation, and interest in the subject. These personal aspects, as could be expected, sometimes coincide with aspects of the student’s preuniversity academic history.
All these factors have certain similarities and links, occasionally spurious, which must be carefully analyzed, and which give rise to a complex network of effects which should be able to explain the variability observed in the university and degree course selection process. If we know
the weight of each factor, its effect, intensity, and direction, we can plan much more effectively university access guid-ance campaigns, generate strategies for the advguid-ancement of underrepresented groups, and, finally, make the transition between preuniversity and university much smoother. There are many who consider that the inadequate transition and lack of proper planning are largely responsible for drop-outs, absenteeism, and academic failure; however, this question is outside the scope of the present paper. Finally, we should point out that an analysis of the phenomenon dealt with here only acquires a realistic dimension in longitudinal terms and with a large sample of subjects that not only considers demographic variations due, for example, to immigration, but also takes into account the impact of new degrees in Spain and the perhaps excessively wide range of courses available. In view of the previously mentioned, the main objective of this work is to verify a multivariate model based on the principles of the structural equations model (SEM), which analyzes the impact of the different variables and factors identified by the bibliography as linked to the decision process on university degree courses, in the Universitat Polit`ecnica de Val`encia (UPV) as paradigmatic institution in this environment.
The study was carried out on various cohorts of freshmen students enrolled for the first time in the Spanish university system in the academic years 2010-2011 and 2011-2012 and formed part of a larger project which analyzed the decision process in other areas of knowledge.
2. Path Diagram
The structural relationships used in the analysis were based on the structural model (SEM) proposed by Gu`ardia et al. in [9], which obtained good fits of the structural model shown inFigure 1as applied to a psychology degree course. A further development of the model was applied to several other degrees and universities [10].
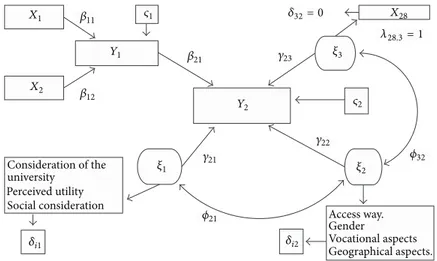
As can be seen, this model involves the simultaneous use of directly observable variables free of error (represented by rectangles in Figure 1) and latent variables (represented by ovals). This created certain difficulties of notation on translating the proposal into statistical terms specific to structural models, as shown inFigure 2.
The structural equations that can be specified from
Figure 2are as follows:
𝑌1= 𝛽11𝑋1+ 𝛽12𝑋2+ 𝜁1,
𝑌2= 𝛽21𝑌1+ 𝛾21𝜉1+ 𝛾22𝜉2+ 𝛾23𝜉3+ 𝜁2. (1) Finally, to conform to the general precepts and assumptions of structural equation models, we considered the following statistical assumptions for quantitative variables 𝐸(𝑋𝑖) = 𝐸(𝑌𝑖) = 𝐸(𝜉𝑖) = 0 and Var(𝑋𝑖) = Var(𝑌𝑖) = Var(𝜉𝑖) = 1. Consequently, all quantitative variables were transformed by reduction and standardization, and similarly 𝐸(𝜀𝑖𝜀𝑗) = 𝐸(𝛿𝑖𝛿𝑗) = 𝐸(𝜉𝛿) = 𝐸(𝜂𝜀) = 𝐸(𝜁𝑖𝜁𝑗) = 0, assuming initially that the errors of measurement were uncorrelated with each other, as in the case of the observable and latent variables. The categorical observable variables (type of baccalaureate and
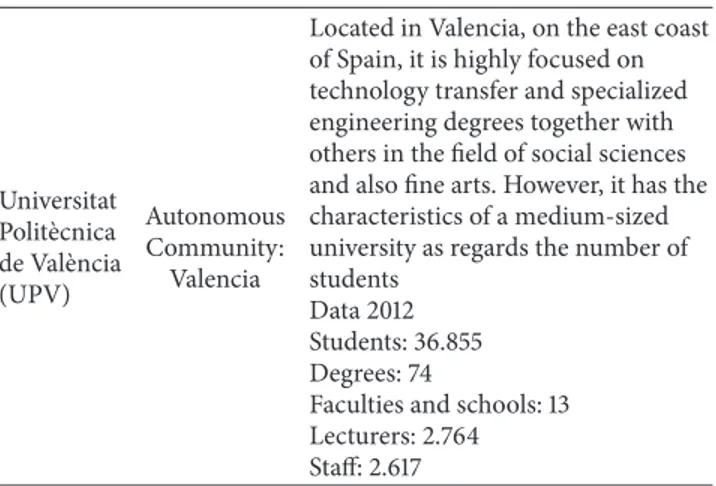
Table 1: General characteristics of the UPV.
Universitat Polit`ecnica de Val`encia (UPV) Autonomous Community: Valencia
Located in Valencia, on the east coast of Spain, it is highly focused on technology transfer and specialized engineering degrees together with others in the field of social sciences and also fine arts. However, it has the characteristics of a medium-sized university as regards the number of students
Data 2012 Students: 36.855 Degrees: 74
Faculties and schools: 13 Lecturers: 2.764 Staff: 2.617
gender) were considered separately and subjected to an own estimation process described in the following.
For the sake of brevity, the structures of exogenous mea-surement models (Λ𝑥) are not included here. We adopted the correlations between exogenous variables (both observable and latent) that had been shown to be significant in previous pilot studies. In all cases, the exogenous measurement models specified in the model comply with the conditions for apply-ing the usual order conditions. In addition, the proposed model meets the identification condition, since it presents positive degrees of freedom (degree of freedom df = 321).
3. Method
3.1. Participants. Four accidental samples were obtained (𝑛 =
2244) composed of undergraduate students doing different degree courses at the Universitat Polit´ecnica de Val`encia. The UPV is one of four polytechnic universities in Spain and offers a wide range of courses.Table 1shows some of its main features.
The UPV sample consisted of 265 students enrolled in social science degree programs (12%), 189 in experimental sciences and health (8%), and the rest (80%) were engaged in engineering studies, the fundamental faculty at the UPV. In engineering, the percentage of women is much lower than usual, ranging from 15% to 30%. This paper is focused exclusively on engineering students (𝑛 = 1790), whose basic variables are shown inTable 2.
Some subjects, aeronautical engineering, for example, were not included in the sample due to insufficient numbers. Ages ranged from 18 to 21 in all samples, so that there was wide homogeneity in the distribution (M = 18.77; SD = 0.38). The students tended to come from the technical areas of the Baccalaureate (98% from science and technology and the residual 2% from other branches). The cut-off mark ranged from 5 (minimum access) to 12.96 (maximum possible 14 points), reaching M = 8.12 and SD = 1.52, but with a very skewed distribution towards the tail on the right.
3.2. Questionnaire. Each student was administered the
Previous course registration
Offer of places last year
Perceived utility Social consideration
Social factors Offer of places
access year
Demand in his first option year access
Perception offer/demand
Cut-off mark Year before access
Mode of access. Gender Access mark Vocational aspects Geographical aspects. Individual factors Consideration of the university
Figure 1: Diagram of the proposed structural model.
X1 X2 𝛽11 𝛽12 Y1 𝜍1 𝛽21 Y2 𝜉1 𝛾21 𝜙21 𝛿i1 𝛿32= 0 X28 𝛾23 𝜉3 𝜍2 𝛾22 𝜆28.3= 1 𝜉2 𝛿i2 𝜙32 Perceived utility Social consideration Gender Access way. Vocational aspects Geographical aspects. Consideration of the university
Figure 2: Specification of proposed structural model with identification of the free parameters to be estimated.
showed good values for reliability and validity. The question-naire variables related to access was divided into two second-order factors (social and individual) defined by six primary factors: consideration of the university; perceived Utility and Social Considerations as social factors. The primary factors were vocational aspects; influence of geographical location for the individual factor, including the access grade, method of access, and gender. In the initial study, Cronbach’s𝛼 values ranged between .84 and .95 for all factors. The factorial validity analyses carried out with confirmatory factor analysis also showed a good fit that confirmed the structure of the factors described(𝜒2= 1234.74; 𝑃 = .18). The questionnaire consisted of a total of 25 items defined in a scale of ordinal response from 1 (maximum disagreement) to 7 (maximum agreement) leaving a complementary value for cases in which the proposed item did not apply, for example, if students had not attended the university’s open day or did not have access to the services of an educational counselor, and so forth.
In addition to the variables included in the questionnaire, data were obtained from institutional variables, that is, cut-off marks, places cut-offered in the academic years considered, numbers of students enrolled in each degree course, and so forth. While some of this information was gathered
from the students themselves, data was also obtained from official sources, that is, the universities involved and the official statistical data from the Education Ministry (http://www.mecd.gob.es/portada-mecd/). The data from the students themselves was not analyzed since it responded to secondary objectives of the overall project and was designed to estimate the real knowledge of the students accessing the university system.
3.3. Procedure. The questionnaire was administered by
com-puter in such a way that the final total sample emerged from an accidental sampling. The results and data for each student were then processed according to the planned statistical analysis that was performed using SPSS v 21.0 and Amos v 19.0.
3.4. Statistical Analysis. To conform to the general precepts
and assumptions of structural equation models, the following statistical assumptions were made for quantitative variables 𝐸(𝑋𝑖) = 𝐸(𝑌𝑖) = 𝐸(𝜉𝑖) = 0 and Var(𝑋𝑖) = Var(𝑌𝑖) = Var(𝜉𝑖) = 1. As a result, all quantitative variables were
Table 2: Samples of UPV engineering students in 2010/2011 and 2011/2012.
Gender
Degree groups Cohorts
Agronomics Construction and civil engineering Information and communication technology Industrial engineering 2010-2011 2011-2012 Female 376 (21%) Male 1414 (79%) 395 22% 420 23% 440 25% 535 37% 805 45% 985 55% likewise,𝐸(𝜀𝑖𝜀𝑗) = 𝐸(𝛿𝑖𝛿𝑗) = 𝐸(𝜉𝛿) = 𝐸(𝜂𝜀) = 𝐸(𝜁𝑖𝜁𝑗) = 0, assuming initially that the errors of measurement were uncorrelated to each other, as was the case of the observable and latent variables. The categorical observable variables (type of Baccalaureate and gender) were considered as such and subjected to an estimation process described in the following.
The structures of the exogenous measurement models (Λ𝑥) are not described for reasons of space. We should just point out that we measured the correlations between exogenous variables (both observable and latent) that pre-vious studies have shown to be relevant. The exogenous measurement models specified in the proposed model meet the usual application conditions of order. In addition, the proposed model verifies the identification condition since it presents positive degrees of freedom (degree of freedom df = 321). Further information on specific model data can be found in [9].
4. Results
First, parametric statistical tests were carried out to assess whether various samples considered showed any significant differences in relation to the gender and access marks of the students. No significant difference was obtained, so that the modifying effects of marginal distributions could be ruled out of the later analyses. The only exception was the distribution of the gender variable, in which the proportion of women compared to an equiprobable population distribution was significantly lower than that of men(𝜒2 = 89.43; ) (𝑃 < .001, 𝑉 = .82), as the UPV students are mostly men. We analyzed the replies to the questionnaire according to the factors described, comparing results by degree courses and did not find any statistically significant differences between courses.
Thus, for each of the subsamples (engineering branches) the matrix of Pearson correlation between all the variables involved in the analysis was obtained, taking into account that in pairs in which the gender variable was considered it was estimated by biserial correlations and the type of Baccalaureate was estimated by polychoric correlations. The different parameters of the model were estimated using the AFD technique to estimate free distribution, since many of the variables involved presented high values of asymmetry. Although these did not affect the estimation of the corre-lation, given the large sample size, they could have affected the value of the estimates of the structural parameters. All
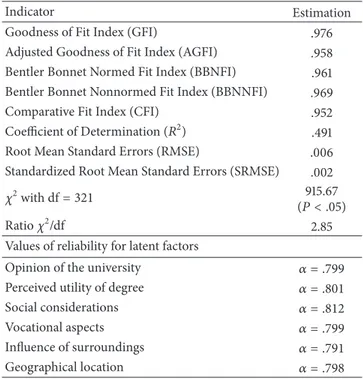
Table 3: Overall setting for structural model only for UPV engi-neering students, with an indication of reliability (estimation of𝛼 of Satorra-Bentler).
Indicator Estimation
Goodness of Fit Index (GFI) .976 Adjusted Goodness of Fit Index (AGFI) .958 Bentler Bonnet Normed Fit Index (BBNFI) .961 Bentler Bonnet Nonnormed Fit Index (BBNNFI) .969 Comparative Fit Index (CFI) .952 Coefficient of Determination (𝑅2) .491
Root Mean Standard Errors (RMSE) .006 Standardized Root Mean Standard Errors (SRMSE) .002
𝜒2with df= 321 915.67
(𝑃 < .05)
Ratio𝜒2/df 2.85
Values of reliability for latent factors
Opinion of the university 𝛼 = .799 Perceived utility of degree 𝛼 = .801 Social considerations 𝛼 = .812 Vocational aspects 𝛼 = .799 Influence of surroundings 𝛼 = .791 Geographical location 𝛼 = .798
the analyses were carried out using SPSS and Amos software.
Table 3shows the overall fit in the UPV, assuming the four branches of engineering in a joint mode.Table 4shows these parameters differentiated by study field. As can be seen in both tables, the goodness of fit indicators, show a good overall fit and also in the different fields. It should also be pointed out that in the construction engineering field the fit of the model is not so good.
The structural parameters derived from each of the four models described inTable 4were also estimated to make it possible to analyze any differences from the effects in the general model, dividing the degree courses into different groups. Table 5 summarizes the standardized estimates of each structural parameter value.
5. Conclusions
The first issue to highlight has to do with the adjustment values of the models analyzed; while the fit of the𝜒2statistic was not particularly good, we consider that the general model
Table 4: Overall settings of each specialty.
Indicator
Universitat Polit`ecnica de Val`encia (UPV)
Agronomics Construction andcivil engineering
Information and commu-nications technology Industrial engineering GIF .900 .877 .944 .922 AGIF .901 .878 .945 .924 BBNFI .900 .871 .933 .931 BBNNFI .902 .873 .928 .928 CFI .899 .878 .919 .918 𝑅2 .312 .302 .387 .318 RMSE .010 .010 .007 .008 SRMSE .004 .005 .002 .002 𝜒2(df= 321) 594.23 𝑃 = .078 𝑃 = 0.069643.28 𝑃 = .09699.54 𝑃 = .11745.12 𝜒2/df 2.787 2.48 2.79 2.312
Table 5: Estimation of each standardized structural parameter for degrees at the UPV. Start of the effect
according to the model inFigure 1
End of the effect according to the model inFigure 1
Parameter
Engineering fields
Effect from Effect until Agronomy Construction
Information and communications technology Industrial engineering Perception offer/demand in access year Demand in first
option access year Γ23 .501∗ .592∗ .676∗ .423∗ Previous course
registration
Offer of places
access year 𝐵11 .198∗ .335∗ .644∗ .216∗
Offer of places last year
Offer of places
access year 𝐵12 .218∗ .321∗ .612∗ .299∗
Offer of places access year
First option year
access demand 𝐵21 .256
∗ .299∗ .618∗ .261∗
Social factors Demand for first
option in access year Γ21 .399
∗ .441∗ .649∗ .381∗
Individual factors Demand for first
option in access year Γ22 .643
∗ .678∗ .612∗ .551∗
Correlation between social and individual
factors Φ21 .512
∗ .571∗ .623∗ .493∗
Correlation between perception of offer and demand for places in first choice in the year prior to the year studied with individual factors
Φ32 .621∗ .699∗ .679∗ .612∗
∗𝑃 < .05∗𝑃 < .01.
proposed to explain the demand for the students’ first choice in engineering studies at the UPV under the Spanish public system could be a suitable model. This conclusion is based on the fact both in the case of the overall adjustment of the UPV total and in the adjustment for the different engineering courses; the adjustment rates are good, since the values of GFI, AGFI, BBNFI, BBNNFI, or IFC indices are over .90 and
in some cases more than .95. The SRMR values are lower than .011 and SRMSE values are below .005 (as proposed by Hu and Bentler [11]). These indices are acceptable when they are superior to .90 (GFI, AGFI, BBNFI, BBNNFI, and CFI), and for SRMR≤ .05; and RMSEA ≤ .06, also the 𝜒2/df ratio< 2 indicates an excellent fit,𝜒2/df < 3 a good fit, and 𝜒2/df < 5 an acceptable fit [11], and in our case for all the models fitted
these ratios are lower than 3. These results coincide with the model proposed by Gu`ardia et al. [10] for the first version of the present model.
It can also be pointed out that in general the hypothesized parameters in the model are statistically significant in all cases, which is another argument in favor of the proposed model’s ability to explain the demand for the first choice of university degree courses. All the estimated values are statistically significant with a confidence level of 95%. How-ever, there exist certain differences that should be pointed out. In Table 5 the value of the estimated parameter is very different for the specialties analyzed. The standardized estimates provide a simple descriptive analysis. Thus, in the case of ICT, the end endogenous variable to be explained (the demand for first choice(𝑌2)) presents higher parameter values due to the impact of the exogenous variables(𝜉1,𝜉2, and 𝜉3), in most cases 𝛾𝑖𝑗 is of the order of .60 or higher. This could be explained by the fact that ICT is composed of a range of courses identified with the present time and thus is given preference in the demands of the students. Despite new offers, new UPV students see ICT as an attractive choice with a strong impact of individual and social factors for selection as the first option.
The cut-off mark also has a great influence on the perception of the offer/demand in the access year, especially in ICT (𝛾23 = .676). This is consistent with the previ-ously mentioned, since the UPV is particularly strong in engineering, which therefore reaffirms the predominant role of the ICT field as compared to the other three fields of construction, agricultural, and industrial engineering.
This work has certain limitations that should be consid-ered and which mainly involve two issues. The first is the size of the asymmetrical samples, which means that some estimates are somewhat skewed by this effect. The use of standardized estimates facilitates presentation and study but does not solve all the problems of sampling. The second issue is that, in order to keep the results as simple as possible, we did not carry out strict statistical comparisons between the various parameters using the usual mechanisms (LM or Wald Test). The additional parameters and models would have involved extra complexity without providing special information. For the same reason we also decided not to incorporate the global adjustment values based on the Akaike (AIC) or Bayesian criteria (BIC).
Acknowledgments
This research was made possible in part by the PSI2010-21214-C02-01 Project and was carried out by members of the Generalitat de Catalunya’s SGR 388 Consolidated Research Group and also by members of the Grup Consolidat d’Innovaci´o Docent en Aprenentatge de l’Estadistica en Salut de la Universitat de Barcelona (GCID-2011/EST). This work forms part of the project entitled “A Longitudinal Model Impact Assessment of Variables Involved in Selecting Studies and University. Academic Achievement in High School and University Entrance Exam, as Predictors of Initial Perfor-mance at University,” financed by the ICE at the University of Barcelona in the REDICE 2012, with Code no. 1641-01.
References
[1] P. E. Murphy and R. A. McGarrity, “Marketing universities: a survey of student recruitment activities,” College and University, vol. 53, no. 3, pp. 249–261, 1978.
[2] T. Yurtseven, How Does the Image of Engineering affect Student
Recruitment and Retention? A Perspective from the USA, Global
Journal of Engineering Education, New York, NY, USA, 2002. [3] C. S. V. Turner and J. R. Thompson, “Socializing women
doctoral students: minority and majority experiences,” Review
of Higher Education, vol. 6, pp. 232–241, 1993.
[4] D. Y. Ford, “The underrepresentation of minority students in gifted education: Problems and promises in recruitment and retention,” The Journal of Special Education, vol. 32, no. 1, pp. 4–14, 1998.
[5] R. Capilla, An´alisis estrat´egico de los estudios TIC en la
Uni-versidad Polit´ecnica de Valencia [Tesis Doctoral no Publicada],
Universitat Polit`ecnica de Val`encia, Valencia, Spain, 2009,
http://riunet.upv.es/handle/10251/5767.
[6] S.-M. R. Ting, “Predicting academic success of first-year engi-neering students from standardized test scores and psychosocial variables,” International Journal of Engineering Education, vol. 17, no. 1, pp. 75–80, 2001.
[7] Sh. Huang and N. Fang, “Predicting student academic perfor-mance in an enginnering dynamics course: A comparison for four types of predictive mathematical models,” Computers &
Education, vol. 61, pp. 133–145, 2013.
[8] C. P. Veenstra, E. L. Dey, and G. D. Herrin, “Is modeling of freshman engineering success different from modeling of non-engineering success?” Journal of Engineering Education, vol. 97, no. 4, pp. 467–479, 2008.
[9] J. Gu`ardia, M. Per´o, A. Herv´as, R. Capilla, P. P. Soriano, and M. Porras, “Factores asociados con la decisi´on de cursar estudios universitarios de Psicolog´ıa. Una aproximaci´on mediante mod-elos de ecuaciones estructurales,” Anuario de Psicologia, vol. 42, no. 1, pp. 87–104, 2012.
[10] J. Gu`ardia, M. Per´o, A. Herv´as, R. Capilla, P. P. Sori-ano, and M. Porras, “Factors related with the university degree selection in Spanish public university system. A struc-tural equation model analysis,” In editorial review, 2013,
http://riunet.upv.es/handle/10251/30128.
[11] L.-T. Hu and P. M. Bentler, “Cutoff criteria for fit indexes in covariance structure analysis: conventional criteria versus new alternatives,” Structural Equation Modeling, vol. 6, no. 1, pp. 1– 55, 1999.
Submit your manuscripts at
http://www.hindawi.com
Hindawi Publishing Corporation
http://www.hindawi.com Volume 2014
Mathematics
Journal ofHindawi Publishing Corporation
http://www.hindawi.com Volume 2014
Mathematical Problems in Engineering
Hindawi Publishing Corporation http://www.hindawi.com
Differential Equations International Journal of
Volume 2014
Hindawi Publishing Corporation
http://www.hindawi.com Volume 2014 Hindawi Publishing Corporationhttp://www.hindawi.com Volume 2014
Hindawi Publishing Corporation
http://www.hindawi.com Volume 2014
Mathematical PhysicsAdvances in
Complex Analysis
Journal ofHindawi Publishing Corporation
http://www.hindawi.com Volume 2014
Optimization
Journal of Hindawi Publishing Corporationhttp://www.hindawi.com Volume 2014
Combinatorics
Hindawi Publishing Corporation
http://www.hindawi.com Volume 2014
International Journal of
Hindawi Publishing Corporation
http://www.hindawi.com Volume 2014
Journal of Hindawi Publishing Corporation
http://www.hindawi.com Volume 2014
Function Spaces
Abstract and Applied Analysis
Hindawi Publishing Corporation
http://www.hindawi.com Volume 2014 International Journal of Mathematics and Mathematical Sciences
Hindawi Publishing Corporation http://www.hindawi.com Volume 2014
The Scientific
World Journal
Hindawi Publishing Corporation
http://www.hindawi.com Volume 2014
Hindawi Publishing Corporation
http://www.hindawi.com Volume 2014
Discrete Dynamics in Nature and Society
Hindawi Publishing Corporation
http://www.hindawi.com Volume 2014
Hindawi Publishing Corporation
http://www.hindawi.com Volume 2014
Discrete Mathematics
Journal ofHindawi Publishing Corporation
http://www.hindawi.com Volume 2014 Hindawi Publishing Corporationhttp://www.hindawi.com Volume 2014