UNIVERSITY OF NAPLES FEDERICO II
DEPARTMENT OF PHARMACY
PhD in Pharmaceutical Science – XXXI cycle
Investigating non-canonical nucleic acid
structures and their interaction with potential
anticancer drugs
PhD Thesis
Alessia Pagano
Tutor:
Prof. B
RUNOP
AGANOPhD Coordinator:
Prof. M
ARIAV
ALERIAD’A
URIAI
A
BSTRACT
The outstanding structural polymorphism of DNA allows for the formation of non-canonical secondary structures, such as G-quadruplexes (G4s), G-triplexes (G3s) and i-motifs. G4 and i-motif structures are found within important functional genomic regions such as telomeres and gene promoters. In particular, they are localized within the promoter regions of several proto-oncogenes, whose overexpression leads to malignant transformation, where they play a major role in the regulation of transcription. In many cases, the biological consequence of non-canonical secondary structure formation in the promoter element is gene silencing. For this reason, the search for ligands able to bind and stabilize G4s and/or i-motifs is pharmacologically very important to develop new anticancer strategies.
In this PhD thesis, a series of studies have been carried out with the aim of investigating these non-canonical nucleic acid structures and their interaction with potential anticancer drugs. Such studies have led to the discovery of new and selective G4 ligands (Chapter 3). Chapter 4 deals with the tandem application of virtual screening along with experimental investigations, that led to discover the first dual G-triplex/G-quadruplex stabilizing compound. In Chapter 5, biophysical techniques have been employed to demonstrate that some well-known G4 ligands are also able to interact with i-motif structure.
The last section of this PhD thesis deals with a study conducted in Dr. Vincenzo Abbate’s laboratory at King’s College London (UK). It concerns the design and synthesis of a new class of gallium chelator to be employed in the development of chemically-modified nucleic acid aptamers to be used as theranostics.
II
L
IST OF
P
UBLICATIONS
Paper I
“Toward the Development of Specific G‑Quadruplex Binders: Synthesis, Biophysical, and Biological Studies of New Hydrazone Derivatives”. J. Amato, R. Morigi, B. Pagano, A. Pagano, S. Ohnmacht, A. De Magis, Y. Tiang, G. Capranico, A. Locatelli, A. Graziadio, A. Leoni, M. Rambaldi, E. Novellino, S. Neidle, and A. Randazzo. J. Med. Chem., 2016, 59, 5706-5720. doi: 10.1021/acs.jmedchem.6b00129.
Paper II
“Targeting the BCL2 Gene Promoter G-Quadruplex with a New Class of Furopyridazinone-Based Molecules”. J. Amato, A. Pagano, D. Capasso, S. Di Gaetano, M. Giustiniano, E. Novellino, A. Randazzo, and B. Pagano. ChemMedChem, 2018, 13, 406-410. doi: 10.1002/cmdc.201700749.
Paper III
“Tailoring a lead-like compound targeting multiple G-quadruplex structures”. J. Amato, C. Platella, S. Iachettini, P. Zizza, D. Musumeci, S. Cosconati,A. Pagano, E. Novellino, A. Biroccio, A. Randazzo, B. Pagano, and D. Montesarchio. Eur. J. Med. Chem. 2019, 163, 295-306. doi: 10.1016/j.ejmech.2018.11.058.
Paper IV
“Discovery of the first dual G-triplex/G-quadruplex stabilizing compound: a new opportunity in the targeting of G-rich DNA structures?”. J. Amato, A. Pagano, S. Cosconati, G. Amendola, I. Fotticchia, N. Iaccarino, J. Marinello, A. De Magis, G. Capranico, E. Novellino, B. Pagano, A. Randazzo. Biochimica et Biophysica Acta – General Subjects, 2017, 1861, 1271-1280. doi: 10.1016/j.bbagen.2016.11.008.
III
Paper V
“Common G-Quadruplex Binding Agents Found to Interact With i-Motif-Forming DNA: Unexpected Multi-Target-Directed Compounds”. A. Pagano, N. Iaccarino, M. A. S. Abdelhamid, D. Brancaccio, E. U. Garzarella, A. Di Porzio, E. Novellino, Z. A. E. Waller, B., J. Amato, and A. Randazzo. Frontiers in Chemistry, 2018, 6, 281. doi: 10.3389/fchem.2018.00281.
Other publications
1. “Characterization of monovarietal extra virgin olive oils from the province of Béjaïa (Algeria)”. F. Laincer, N. Iaccarino, J. Amato, B. Pagano, A. Pagano, G. Tenore, A. Tamendjari, P. Rovellini, S. Venturini, G. Bellan, A. Ritieni, L. Mannina, E. Novellino, and A. Randazzo. Food Research International, 2016, 89, 1123-33. doi: 10.1016/j.foodres.2016.04.024.
2. “1H NMR-based metabolomics study on follicular fluid from patients with PolyCystic Ovarian Syndrome (PCOS)”. N. Iaccarino, J. Amato, B. Pagano, A. Pagano, L. D’Oriano, C. Alviggi, A. Randazzo. Biochimica Clinica, 2018, 42, 26-31. doi: 10.19186/BC_2018.008.
IV
L
IST OF ABBREVIATIONS
A Adenine
AMD Age-related macular degeneration
BCL2 B-cell lymphoma-2
BJ Human fibroblasts
BJ-hTERT Human immortalized BJ fibroblasts
C Cytosine
CD Circular dichroism
CPG Controlled pore glass
CTCF Corrected total cell fluorescence DAPI 4’,6-diamidino-2-phenylindole
DDR DNA damage response
DEAD Diethyl azodicarboxylate
DIPEA N,N-Diisopropylethylamine
DMEM Dulbecco’s modified eagle medium
DMF Dimethylformamide
DMSO Dimethyl sufoxide
DMT 4,4'-dimethoxytrityl
DNA Deoxyribonucleic acid
DSC Differential scanning calorimetry FACS Fluorescence activated cell sorting
FAM 6-carboxyfluorescein
FBS Fetal bovine serum
FID Fluorescent intercalator displacement
FP Furo[2,3-d]pyridazin-4(5H)-ones
FRET Fluorescence resonance energy transfer
G Guanine
G3 G-triplex
V
GE Gel electrophoresis
HATU
1-[Bis(dimethylamino)methylene]-1H-1,2,3-triazolo[4,5-b]pyridinium 3-oxid hexafluorophosphate
HDF Normal human dermal fibroblasts
HeLa Human adenocarcinoma cancer cell line HepG2 Human liver cancer cell line
HIF-1α Hypoxia-inducible factor 1-alpha hTERT Human telomerase reverse transcriptase
IF Immunofluorescence
INS Insulin gene
IR Infrared
LCAA Long chain alkylamine
MCF-7 Breast cancer cell line
MST Microscale thermophoresis
MTT Thiazolyl blue tetrazolium bromide NHE Nuclease hypersensitive elements
NMR Nuclear magnetic resonance
PAGE Polyacrylamide gel electrophoresis
PBS Phosphate buffered saline
PDGFR Platelet-derived growth factor receptors
PET Positron emission tomography
PI Propidium iodide
POT1 Protection of telomere 1
PSMA Prostate-specific membrane antigen
PVDF Polyvinylidene fluoride
qPCR Quantitative polymerase chain reaction RAP1 Repressor/activator protein 1
RNA Ribonucleic acid
RT-PCR Reverse transcriptase-polymerase chain reaction
SDS Sodium dodecyl sulfate
T Thymine
TAMRA 6-carboxytetramethylrhodamine
TBA Thrombin binding aptamer
VI
TEA Triethylamine
TFA Trifluoroacetic acid
THP Tris(hydroxypyridinone)
TIF Telomere induced foci
TIN2 TRF1- and TRF2-interacting nuclear protein 2
TO Thiazole orange
TPP1 Tripeptidyl peptidase 1
TRF1 Telomere repeat factor 1
TRF1 Telomeric repeat-binding factor 1
TRF2 Telomere repeat factor 2
TSS Transcription start sites
U Uracile
U2OS Human bone osteosarcoma epithelial cell lines VEGF Vascular endothelial growth factor
T
ABLE OF
C
ONTENTS
ABSTRACT ... I
LIST OF PUBLICATIONS ... II
LIST OF ABBREVIATIONS ... IV
CHAPTER 1INTRODUCTION ... 1
1.1 General description of nucleic acids ... 1
1.2 Non-canonical nucleic acid structures ... 3
1.2.1 G-quadruplexes ... 4
1.2.2 G-triplex ... 7
1.2.3 i-Motif ... 8
1.3 Biological relevance of G-quadruplexes...10
1.3.1 Targeting G4 structure in cancer cells...12
1.4 Biological relevance of i-motif ...15
1.5 DNA sequences as therapeutic agents ...16
CHAPTER 2METHODS ... 19
2.1 Circular dichroism ...19
2.2 Fluorescence Spectroscopy ...21
2.3 Electrophoresis ...23
2.4 Differential scanning calorimetry ...24
2.5 Nuclear Magnetic Resonance ...27
2.6 Microscale Thermophoresis ...32
CHAPTER 3TARGETING G-QUADRUPLEXES ... 35
3.1 New Hydrazone derivatives as specific G-quadruplex binders (Paper I) ...37
3.1.1 Introduction...37
3.1.2 Results and discussion ...38
3.1.3 Conclusions ...55
3.1.4 Experimental Section ...56
3.2 Targeting the BCL2 Gene Promoter G-Quadruplex with a New Class of Furopyridazinone-Based Molecules (Paper II) ...62
3.2.2 Results and discussion ... 66
3.2.3 Conclusions ... 76
3.2.4 Experimental Section ... 76
3.3 Tailoring a lead-like compound targeting multiple G-quadruplex ... 81
3.3.1 Introduction ... 81
3.3.2 Results and discussion ... 82
3.3.3 Conclusions ... 101
3.3.4 Experimental section ... 102
CHAPTER 4 TARGETING G-TRIPLEX ... 109
4.1 Discovery of the first G-triplex/G-quadruplex stabilizing compound (Paper IV)
... 109
4.1.1 Introduction ... 109
4.1.2 Results and discussion ... 111
4.1.3 Conclusions ... 126
4.1.4 Experimental Section ... 126
CHAPTER 5 TARGETING I-MOTIF-FORMING DNA ... 133
5.1 Common G-quadruplex binding agents found to interact with i-motif-forming
DNA (Paper V) ... 133
5.1.1 Introduction ... 133
5.1.2 Results ... 135
5.1.3 Discussion ... 148
5.1.4 Conclusions ... 151
5.1.5 Experimental Section ... 152
CHAPTER 6 SYNTHETIZING A NEW THP DERIVATIVE SUITABLE FOR THE
CONJUGATION TO NUCLEIC ACID SEQUENCES ... 156CONCLUSIONS ... 169
REFERENCES ... 170
1
Chapter 1
I
NTRODUCTION
1.1 General description of nucleic acids
Nucleic acids are the biological macromolecules that play fundamental roles in cells and ensure the normal development and functioning of an organism. They are composed of nucleotides, which are monomers made of three components: a pentose sugar, a phosphate group and a nitrogenous base. If the sugar is a ribose, the polymer is ribonucleic acid (RNA); if the sugar is a deoxyribose, the polymer is deoxyribonucleic acid (DNA). The bases of DNA divide into two groups: purines [adenine (A) and guanine (G)] and pyrimidines [thymine (T) and cytosine (C)]. In RNA, thymine is replaced by uracil (U). Purines are made of six- and five-membered nitrogen-containing rings fused together; pyrimidines consist of only a six-membered nitrogen-containing ring (Voet and Voet, 1995) (Figure 1.1).
Figure 1.1. Structure of purine and pyrimidine bases.
A nucleoside is a molecule whose C1’ of the pentose sugar is covalently bound by an N-glycosidic bond to the N9 or N1 of purines or pyrimidines, respectively. The rotations of this
2
glycosidic bond allows structural diversity to the DNA molecule. The glycosidic bond may be either syn or anti (Figure 1.2).
Figure 1.2. The glycosidic bond: A) anti conformation; B) syn conformation.
The syn conformation is formed when the C1’-O4’ bond is cis to the N9-C4 purine bond, and cis to the N1-C2 of pyrimidine. This occurs when the bulk of the purine base faces the sugar or when the C2 carbonyl is on top of the sugar ring. The anti conformation is formed when the bulk of the base is rotated away from the sugar. This occurs when the C1’-O4’ bond of the sugar is trans to the N9-C4 bond of the purine base. In pyrimidines, the anti conformation is formed when the C2 carbonyl faces away from the sugar. This occurs when the C1’-O4’ bond is trans to the N1-C2 pyrimidine bond. The attachment of a phosphate group to the C5’ carbon of the sugar converts a nucleoside into a nucleotide. A 5’-phosphate group of a nucleotide links to the 3’-hydroxyl group of the next nucleotide to form a phosphodiester bond. The connected nucleotides by phosphodiester bonds form single-stranded DNA.
The single-stranded DNA bases may pair non-covalent interactions, as first described for B-DNA by Watson and Crick back in 1953. (Watson and Crick, 1953). Adenine and thymine (A:T) base pairs are held together by two hydrogen bonds, whereas guanine and cytosine (G:C) base pairs are held by three hydrogen bonds (Figure 1.3).
3
Thus, all four base pairs fit neatly into the double helix. The two strands are antiparallel, with the 5′-end of one strand adjacent to the 3′-end of the other. The two strands coil around each other to form a right-handed double helix, with the base pairs in the center and the sugars and negatively charged phosphates forming the external hydrophilic backbone. The stability of the duplex derives from both base stacking and hydrogen bonding. The B-DNA has a wide major groove and a narrow minor groove running around the helix along the entire length of the molecule (Figure 1.4). Proteins interact with the DNA in these grooves (principally in the major groove), and some small drug molecules (e.g. netropsin and distamycin) bind in the minor groove.
Figure 1.4. DNA fragment in the B-form.
1.2 Non-canonical nucleic acid structures
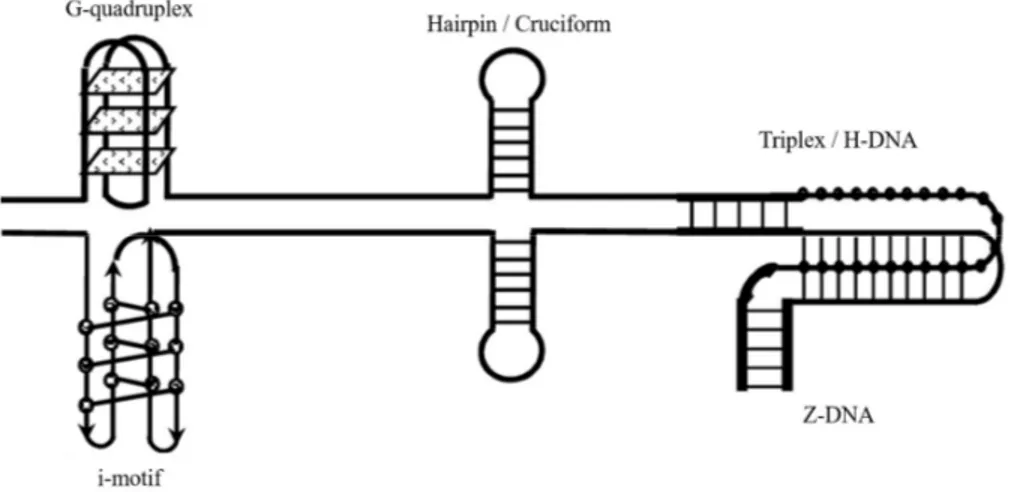
Under certain conditions, nucleic acids can adopt non-canonical conformations other than B-DNA. These unusual DNA structures can involve from one to four nucleic acid strands, that may arrange into hairpins, cruciform, parallel-stranded duplexes, triplexes (H-DNA), G-quadruplex (G4), i-motif and other non B-forms (Figure 1.5). It has been demonstrated that these structures are widely distributed throughout the human genome, and are enriched critical regions (Bacolla and Wells, 2009). In addition, their formation depends on the specific DNA sequence.
4
Figure 1.5. Schematic illustration showing some examples of non-canonical DNA structures.
1.2.1 G-quadruplexes
One of the most important non-canonical nucleic acid structures is the G-quadruplex (G4). It is a four-stranded structure formed by G-rich sequences, either DNA or RNA, which has at least two stacked G-tetrads (Majima and Tetsuro, 2011; Wang and Vasquez, 2006; Wells et al., 2005; Zhao et al., 2010). A G-tetrad is a planar square arrangement of four guanines held together by eight Hoogsteen hydrogen bonds (Huppert, 2010; Rhodes and Lipps, 2018). In it, the N7 and O6 of each guanine are hydrogen-bond acceptors from N2 and N1 of adjacent one, respectively. The π-π stacking between the tetrads further stabilizes this structure. The G-tetrads are linked by loops that can assume different conformations. Moreover, this arrangement delimits a central channel.
The formation and stability of G4s strongly depends on cations, with the central channel neutralizing the strong negative electrostatic potential from guanine O6 atoms (Figure 1.6) (Bochman et al., 2012; Burge et al., 2006; Williamson et al., 1989).
5
Cations that better stabilize the G4 structures are Na+ and K+. The precise location of the cations depends on their nature: Na+ ions are usually in-plane with the G-tetrads, while K+ ions are always equidistant between two G-tetrads, forming a symmetric tetragonal bipyramidal configuration with the oxygen atoms. Switching between Na+ and K+ often induces a structural alteration of G4s, which indicates high conformational flexibility for these structures (Burge et al., 2006). From a biological point of view, the K+ is far more biologically relevant due to its higher intracellular concentration (~ 140 mM) compared to Na+ (5-15 mM).
The topology and stability of G4s depend on many factors: length and composition of the G4-forming sequence, strand stoichiometry and alignment, size of the loops, and nature of the binding cations.
G4s can be unimolecular, when a single strand folds back on itself; bi- or tetra-molecular, when formed by two or four strands, respectively (Figure 1.7) (Huppert, 2010).
Figure 1.7. Schematic representation of A) tetrameric, B) dimeric and C) monomeric G4 structures. G4s can be divided into four groups according to the relative strands orientation (Patel et al., 2007; Phan, 2010):
o Parallel-stranded core, in which four strands are oriented in the same direction (Figure 1.8A);
o Hybrid or (3+1) core, in which three strands are oriented in one direction and the fourth in the opposite direction (Figure 1.8B);
o Antiparallel-stranded core, in which two strands are oriented in one direction and the other two in the opposite one, with an up-up-down-down core (Figure 1.8C);
o Antiparallel-stranded core, in which two strands are oriented in one direction and the other two in the opposite one, with an up-down-up-down core (Figure 1.8D).
6
Figure 1.8. A) Parallel-stranded core; B) hybrid core; C) up-up-down-down core; D) up-down-up-down core [adapted from (Phan, 2010)].
Guanines in a G-tetrad may have two conformations: anti and syn. All parallel G4s have all the guanine glycosidic angles in the anti conformation, whereas antiparallel and hybrid G4s have both syn and anti.
G-tetrads are linked by loops, which can be classified in four groups (Bugaut and Balasubramanian, 2008):
o Lateral loop, connecting two adjacent antiparallel strands (Figure 1.9a);
o Diagonal loop, connecting two opposing antiparallel strands across the G4 plane (Figure 1.9b);
o Double-chain-reversal loop or propeller loop, connecting two adjacent parallel strands (Figure 1.9c);
o V-shaped loop, connecting two corners of a G-tetrad core in which a support column is missing (Figure 1.9d).
Figure 1.9. Schematic illustration showing (a) lateral loop; (b) diagonal loop; (c) propeller loop; (d) V-shaped loop [adapted from (Patel et al., 2007)].
Loops are usually short (1-7 nucleotides) and smaller loops result in more stable G4s (Bugaut and Balasubramanian, 2008; Gros et al., 2010).
7
All G4s have four grooves, which are the cavities delimited by the phosphodiester backbone. Groove dimensions vary and depend on the G4 overall topology and loops nature. If all strands are parallel, guanine angles are in the anti conformation, and the grooves are identical and medium-sized. If the glycosidic bonds orientations of the bases are syn-syn-anti-anti, two grooves are medium-sized, one narrow-sized and one wide-sized (Figure 1.10A). Finally, if the glycosidic bonds orientations of the bases are syn-anti-syn-anti, two grooves are narrow and the other two ones are wide (Figure 1.10B) (Burge et al., 2006).
Several studies have shown that in particular regions of the genome, G-rich sequences can form unimolecular G4s in cell (Biffi et al., 2013; Lipps and Rhodes, 2009). In contrast to bimolecular and tetramolecular G4s, intramolecular structures can be formed quickly and are more complex due to great conformational diversity, such as in folding topologies and loops conformations (Yang and Okamoto, 2010).
Figure 1.10. A) syn-syn-anti-anti glycosidic bonds orientation; B) syn-anti-syn-anti glycosidic bonds orientation.
1.2.2 G-triplex
Recent studies revealed that the folding and unfolding pathways of G4s proceed through a quite stable intermediate named G3. A G3 structure differs from the known triplex structures not only for the base pairing, but also for the structure. Indeed, this structure is characterized by the presence of G:G:G triad planes stabilized by an array of Hoogsteen-like hydrogen bonds similar to G4s. However, the lower number of hydrogen bonds and the smaller stacking surface of the triads with respect to the G-tetrads, make G3s much less stable than G4s and, therefore,
8
even more challenging to isolate both in vitro and in vivo. For all these reasons, it is clear that the discovery of molecules able to interact and stabilize G3s is highly appealing, also for the understanding of the putative biological and therapeutic importance of these intermediates.
Recent studies allowed to isolate and characterize a G3 structure in details. In particular, it was demonstrated that a truncated form of the G4-forming thrombin binding aptamer (TBA) forms a relatively stable G3. (Limongelli et al., 2013). This structure has two G-triads (G1:G6:G10 and G2:G5:G11 Figure 1.11A), characterized by a syn-anti-syn and anti-syn-anti arrangement of the residues, respectively. In this conformation, the metal ion seems to be placed at the center of the two G-triads in a way similar to that of the G4 structure (Figure 1.11B).
Figure 1.11. A) G‐triads involved in the formation of the G‐triplex; B) 3D representation of the G‐triplex [adapted from (Limongelli et al., 2013)].
1.2.3 i-Motif
In 1993 Gehring, Leroy and Guéron observed that cytosine rich sequences can form four stranded structures under acidic conditions (Gehring et al., 1993). They found the d(TCCCCC) oligomer to form a four-stranded structure under acidic pH, two base-paired parallel-stranded duplexes are intimately associated and, fully intercalated. The relative orientation of the duplexes is antiparallel, so that each base pair is face-to-face with its neighbors (Figure 1.12).
9
Figure 1.12. (a) Structure of the intermolecular i-motif formed by d(TC5) (PDB ID: 225D), identified by
Gehring et al. (b) Top view of the i-motif formed by d(TC5). (c) A hemiprotonated cytosine–cytosine+ base
pair [adapted from (Day et al., 2014)].
Due to the unusual nature of the configuration, they called this new non-canonical nucleic acid structure intercalated (i) motif. Sequences with two stretches of cytosines can also form dimeric i-motif structures where two hairpins intercalate (Pairs et al., 1997); and, more interestingly from a biological perspective, natural sequences with four stretches of cytosines separated by other bases can fold into intramolecular i-motif structures (Figure 1.13).
Figure 1.13. Schematic representation of tetrameric (A), dimeric (B) and monomeric i-motif structures (C). The yellow spheres represent the cytosines, plus signs indicate the protonated cytosines.
There are two different i-motif topologies depending on the intercalation: i) the 3’E, in which the outermost cytosine pair is from the 3’ end; ii) the 5’E, where the outermost pair is from the 5’ end (Guéron and Leroy, 2000; Nonin-lecomte and Leroy, 2001), and iii) the less stable
T-10
form, which features non-intercalated outermost C-C+ pair (Kanaori et al., 2001). The intramolecular i-motifs have also been classified according to the length of the loops (Brooks et al., 2010): ‘class I’ i-motifs have shorter loops, whereas ‘class II’ i-motifs have longer loops. In general, ‘class II’ i-motifs are thought to be the more stable due to extra stabilizing interactions within the longer loop regions.
As the formation of an i-motif requires the cytosine hemiprotonation, this structure is formed and is stable in vitro only under slightly acidic conditions (Zhou et al., 2010). However, it has been demonstrated that the negative superhelicity induced by transcriptional activity (Sun and Hurley, 2009), and cell-mimicking molecular crowding conditions (Rajendran et al., 2010) facilitate i-motif formation.
1.3 Biological relevance of G-quadruplexes
During the last decade, G4s have emerged from being a structural curiosity observed in vitro to being recognized as possible regulators of multiple biological processes. The sequencing of many genomes has revealed that they are rich in motifs with the potential to form G4s and that the location of those motifs is non-random, correlating with functionally important genomic regions.
The evidence of G4s formation in cell was first observed in the telomeric region, which is at the end of the eukaryotic chromosomes. The first evidence was obtained using a specific antibody for intermolecular telomeric G4 DNA of the ciliate Stylonychia lemnae (Schaffitzel et al., 2001). Further evidence was achieved observing that telomere end-binding proteins control the formation of G4 DNA structures in vivo (Paeschke et al., 2005). Bioinformatic sequence analyses have also showed that such putative G4-forming sequences are present in the genome of different organisms (Rawal et al., 2006; Todd et al., 2005). There is an estimate of ~700000 potential G4-forming sequences in the human genome (Chambers et al., 2015).
The telomeric structure and stability directly relate to aging (Bodnar et al., 1998), genome stability (Hackett et al., 2001), and cancer growth (Neidle and Parkinson, 2002). Human telomeric DNA comprises a long stretch of double-stranded tandem repeats and a short, single-stranded (TTAGGG)n 3’-overhang (Hemann and Greider, 1999; Zakian, 1995). It has been demonstrated that truncations of this G-rich sequence can form G4 structures in vitro by X-ray crystallography and nuclear magnetic resonance (Parkinson et al., 2002; Phan et al., 2007b; Wang and Patel, 1993; Williamson et al., 1989; Zhang et al., 2010).
11
Telomeres regulate cell senescence as they progressively shorten at each replication round until apoptosis is triggered by genomic instability (Sfeir et al., 2005). Telomerase is the ribonucleoprotein complex with reverse transcriptase activity that elongates telomeres (Greider and Blackburn, 1985). Due to overactivation, it is responsible for cell “immortalization” in 80-85% of all human cancer (Kim et al., 2011). Telomerase recognizes the single-stranded telomeric DNA, but not the G4 structure. Therefore, the discovery of telomeric G4 ligands could be a way to induce the apoptosis in cancer cells. Furthermore, telomeric DNA also binds many other proteins like the shelterin complex. This complex is composed by six subunits: the telomere repeat factor 1 (TRF1), telomere repeat factor 2 (TRF2), protection of telomere 1 (POT1), repressor/activator protein 1 (RAP1), TRF1- and TRF2-interacting nuclear protein 2 (TIN2), and tripeptidyl peptidase 1 (TPP1). They can operate in subsets to regulate the length of or protect telomeres. In this context, small molecules competing with these proteins for the binding to the telomeric DNA would induce a DNA damage response, that quickly promotes senescence in cancer cells.
Other regions of genome that are particularly enriched in putative G4 motifs are the gene promoters (~1 kb upstream of transcription start sites - TSS). G4s within gene promoters are now proved to regulate transcription (Huppert and Balasubramanian, 2007; Patel et al., 2007). The first evidence supporting the existence of unusual DNA forms in gene promoters dates back to 1982, and it is based on the nuclease hypersensitivity element (NHE) in the chicken β-globulin gene promoter (Larsen and Weintraub, 1982; Wood and Felsenfeld, 1982), that was only later associated with guanine runs.
G4s have been reported within the promoter of several genes, e. g. INS (Hammond-kosack et al., 1992), MYC (Siddiqui-Jain et al., 2002; Simonsson et al., 1998), VEGF (Sun et al., 2005),
HIF-1α (Armond et al., 2005), BCL-2 (Dai et al., 2006), KIT (Fernando et al., 2006; Rankin et
al., 2005), RET (Zhou et al., 2010), PDGF-A (Qin et al., 2007), and KRAS (Cogoi et al., 2004). In 2008, Du et al. performed a comprehensive analysis of the relationship between potential G4 DNA motifs in the putative transcriptional regulatory region and gene expression level (Du et al., 2008). The MYC oncogene is a transcription factor that regulates the expression of a variety of genes and it is one of the most prevalent oncogenes found to be altered in human cancer, being dysregulated in about 50% of tumors (Delgado et al., 2013). The transcriptional regulation of MYC is tightly controlled by a complex mechanism involving four promoters (P1– P4), different transcription start sites (TSS) and nuclease hypersensitive elements (NHE). In
12
particular, the NHE III1, located just upstream the promoter P1 is responsible for the great majority of MYC transcription. It is composed of five consecutive runs of the sequence (G/A)G(G/A)AGGGGT that can form a G4 structure (González and Hurley, 2010). As a consequence, the possibility to inhibit MYC transcription through G4 stabilization has been actively pursued in several human cancer models using specific small molecules (González and Hurley, 2010).
A number of G4 structures from gene promoters has been determined by X-ray or NMR techniques (Ambrus et al., 2005; Hsu et al., 2009; Wei et al., 2012). In contrast to the tandem repeats in human telomeres, the G-rich sequences within gene promoters are often composed by G-tracts with an unequal number of guanines and a varying number of intervening bases. Each of these promoter sequences is unique in length, and type of G-tracts, and intervening bases (Qin and Hurley, 2008) and can form multiple G4s, i. e. mixtures of conformations. Notably, G4s from promoters exhibit the highly conserved G3NG3 motifs, which forms a robust parallel-stranded structure with a 1-nt, double-chain-reversal loop (Yang and Okamoto, 2010) (Figure 1.14).
Figure 1.14. Comparison of G4-forming sequences in selected gene promoters. The telomeric sequence is also shown as a comparison. All the promoter G-rich sequences shown contain the G3NG3 motif; except for
the BCL-2 (Bcl2Mid) sequence, they have all been shown to form parallel-stranded G-quadruplexes.
1.3.1 Targeting G4 structure in cancer cells
Considering the crucial position of G4s in the genome and their important role in the carcinogenic processes, targeting them with small molecules could be a potential anticancer approach. In the last decade, a huge number of small molecules has been studied to evaluate their ability to stabilize G4 structures.
The natural product Telomestatin (Figure 1.15A) has been identified as a potent telomeric G4 stabilizer (Sun et al., 1997). It competes POT1 for the binding to the telomeric G4 DNA triggering DNA damage response and cellular senescence (Gomez et al., 2006; Temime-Smaali
13
et al., 2009). The same effect has been also observed for a panel of other G4-interacting small molecules. The triazine 12459 (Figure 1.15B) induces telomere shortening by POT1 uncapping, leading to cellular senescence (Gomez et al., 2003; Riou et al., 2002). The acridine BRACO-19 (Figure 1.15C), one of the very first promising synthetic G4-targeting small molecules, is a very potent telomerase inhibitor (Gunaratnam et al., 2007). RHPS4 and Pyridostatin (Figure 1.15D-E) induce telomere uncapping leading to a telomere-induced DNA damage response (Leonetti, 2004; Phatak et al., 2007; Rodriguez et al., 2008; Salvati et al., 2007).
Figure 1.15. Structure of (A) Telomestatin, (B) 12459, (C) BRACO-19, (D) RHPS4, and (E) Pyridostatin. Therefore, small molecules that bind and stabilize these structures are generally able to inhibit the telomerase thereby triggering DNA damage responses as with other mediators of telomere damage (d’Adda di Fagagna et al., 2003).
G4s could be also the potential targets in a new anticancer strategy based on search for G4-selective stabilizing ligands aimed at inhibition of oncogenes expression (Balasubramanian et al., 2011) (Figure 1.16).
14
Figure 1.16. Scheme representing the targeting of a G4 to suppress oncogene transcription.
For example, it has been proved that the cationic porphyrin derivate TMPyP4 (Figure 1.17) can downregulate the prominent oncogene MYC by stabilizing a G4 structure in its promoter (Siddiqui-Jain et al., 2002). Interestingly, a G > T mutation in the G4-forming sequence within the MYC promoter sufficed to destabilize the G4 and resulted in increased transcription, which was only partially reduced by TMPyP4.
Figure 1.17. Chemical structure of TMPyP4.
Another example of proto-oncogene with a G4-forming sequence within this promoter is
KIT gene, which encodes for a tyrosine protein kinase (Fernando et al., 2006; Rankin et al.,
2005). It was demonstrated that 3,8,10-trisubstituted isoalloxazines stabilize G4s in the KIT promoter and inhibit its expression (Bejugam et al., 2007).
15 1.4 Biological relevance of i-motif
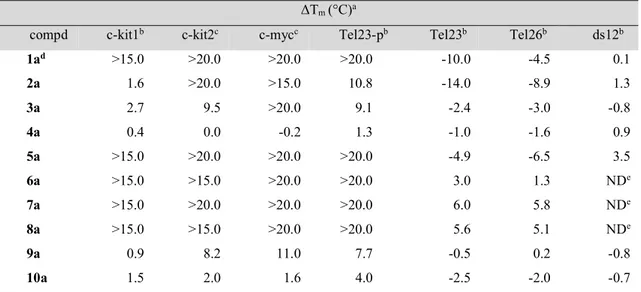
As yet, there has been no systematic analysis of the genome to find sequences capable of forming i-motifs. Due to the complementary nature of putative G4 and i-motif forming sequences, it is likely that there is some overlap in their prevalence. However, the stability and the dynamics of i-motif structures are likely to vary a lot, depending on the sequence. Initial investigations on natural i-motif forming sequences focused on those from the complementary C-rich strands of known promoter G4-forming sequences. A range of i-motif forming sequences has now been identified and characterized (Table 1.1).
Table 1.1. Examples of investigated i-motif forming sequences [adapted from (Day et al., 2014)].
Name Sequence 5’→ 3’ hTelo d(CCCTAACCCTAACCCTAACCCT) c-MYC d(CCCCACCTTCCCCACCCTCCCCACCCTCCCC) bcl-2 d(CAGCCCCGCTCCCGCCCCCTTCCTCCCGCGCCCGCCCCT) Rb d(GCCGCCCAAAACCCCCCG) RET d(CCGCCCCCGCCCCGCCCCGCCCCTA) VEGF-A d(GACCCCGCCCCCGGCCCGCCCCGG) c-ki-ras d(GCTCCCTCCCTCCCTCCTTCCCTCCCTCCC) c-kit d(CCCTCCTCCCAGCGCCCACCCT) PDGF-A d(CCGCGCCCCTCCCCCGCCCCCGCCCCCGCCCCCCCCCCCCC) c-myb d(TCCTCCTCCTCCTTCTCCTCCTCCTCCGTGTCCTCCTCCTCC) hTERT d(CCCCGCCCCGTCCCGACCCCTCCCGGGTCCCCGGCCCAGCCCCCACCGGGCCCTCCCAGCC CCTCCCC) HIF-1 α d(CGCGCTCCCGCCCCCTCTCCCCTCCCCGCGCGCCCGAGCGCGCCTCCGCCCTTGCCCGCCCC CTG) c-jun d(TAACCCCCTCCCCCTCCCCCCTTTAAT) ILPR d(TGTCCCCACACCCCTGTCCCCACACCCCTGT) n-MYC d(ACCCCCTGCATCTGCATGCCCCCTCCCACCCCCT)
Furthermore, some proteins have been identified to bind C-rich stands in human telomeres with specificity (Day et al., 2014).
As for putative i-motif forming sequences in gene promoter regions, the NH3 III1 of MYC proto-oncogene contains a C-rich strand capable of forming an i-motif. Another oncogene promoter that has a C-rich sequence prone to form i-motif is the P1 promoter of the B-cell
lymphoma-2 (BCL-2) proto-oncogene. Unlike other proto-oncogenes, BCL-2 promotes cell
16
(Joensuu et al., 1994). Interestingly, although BCL-2 is overexpressed in some cancers, in neurodegenerative diseases such as Alzheimer’s and Parkinson’s it may be under expressed, leaving the cells more vulnerable to apoptosis (Bar-Am et al., 2005). Studies on the i-motif were previously limited, based on the assumption that, because they are stabilized in slightly acidic conditions, they were not physiologically relevant, despite a solid foundation of data indicating that these structures are detectable at neutral pH in vitro (Mergny et al., 1995).
In a recent study, Dzatko et al. provided the evidence for i-motif formation in vivo by in cell NMR experiments (Dzatko et al., 2018). Moreover, Zeraati et al. reported the generation and characterization of an antibody fragment (iMab) that recognizes i-motif structures with high selectivity and affinity, enabling to detect i-motifs in cells nuclei (Zeraati et al., 2018). This study also showed that the in vivo formation of such structures is also cell-cycle dependent. Thanks to iMab, it was demonstrated that i-motif structures are actually formed in regulatory regions of the human genome, including promoters and telomeric regions. These results support the notion that, as the G4s, i-motif structures could have some key regulatory role in the genome.
1.5 DNA sequences as therapeutic agents
Nucleic acids can be seen not only as a therapeutic target, but also as a new class of potential drugs. Among these are the so-called DNA and RNA aptamers. The term ‘aptamer’ derives from the combination of the Latin word aptus (‘to fit’) and the Greek word meros (‘part’).
Nucleic acid aptamers are short, single-stranded DNA (ssDNA) or RNA molecules that are selected for binding to a specific target (Morita et al., 2018). The first aptamer was isolated in 1990, thereafter thousands of aptamers have been generated against a wide range of target, including small metal ions, organic molecules, peptides, proteins, viruses, bacteria, whole cells and even targets within live animals.
Aptamers can fold into various non canonical nucleic acid structures (for example stem, loop, bulge, G4 and hairpin) (Mayer, 2009), and the peculiar three-dimensional structures allow them to specifically recognize their cognate target. The aptamer-target binding leads to a complex which is similar to an antibody-antigen complex. However, aptamers offer several advantages over traditional antibodies, including smaller size, quick and cheap production, versatile chemical modification, high stability, and low immunogenicity.
17
To date, Pegaptanib (®Macugen) is the only commercially available aptamer (Figure 1.18). It is a chemically-modified RNA molecule that binds to the isoform 165 of the anti-vascular endothelial growth factor (VEGF), a protein that plays a critical role in angiogenesis (the formation of new blood vessels) and increased permeability (leakage from blood vessels), two of the primary pathological processes responsible for the vision loss associated with neovascular age-related macular degeneration (AMD). Pegaptanib works as VEGF antagonist, hence reducing the growth of the blood vessels located within the eye and works to control the leakage and swelling.
Figure 1.18. Chemical structure of Pegaptanib.
The thrombin binding aptamer (TBA) is further example. It is a 15-mer DNA d(GGTTGGTGTGGTTGG) able to fold into an antiparallel G4 (Bock et al., 1992; Nagatoishi et al., 2007). It binds to the exosite I of human alpha-thrombin, i. e. binding site of fibrinogen, and acts as an anti-coagulant agent by inhibiting the activation of fibrinogen as well as platelet aggregation. In addition, TBA shows good affinity and specificity against thrombin. TBA does not interact with other plasma proteins or thrombin analogues (e.g., gamma-thrombin) (Li et al., 2002) (Figure 1.19). As a result, TBA has been used as a short-term anti-coagulant in the coronary artery bypass graft surgery. Its optimized form (NU172) is now under the phase II of clinical trial by ARCA Biopharma (NCT00808964). In addition, due to its high affinity and specificity, a variety of sensors was coupled with TBA, and developed for thrombosis diagnostics.
18
Figure 1.19. Schematic illustration showing (A) the G4 structure of the thrombin binding aptamer (TBA) and (B) its interaction with the thrombin exosite I according to the X-ray and NMR studies. Thrombin molecule is represented as cartoon, TBA molecule is represented as sticks [adapted from (Krauss et al., 2012)].
One of the several therapeutic applications of aptamers is in oncological treatments, where they are used for their selective affinity against proteins that play fundamental roles in cancer cells.
AS1411, formerly named ARGO100, is a 26-nucleotide G4-forming oligonucleotide and it is the first aptamer in clinical trials for the treatment of human cancer (Soundararajan et al., 2009). It was originally selected from a screen of antisense oligonucleotides with antiproliferative function, then pegylated to prolong its half-life for in vivo applications. Owing to its G4 structure, AS1411 is quite resistant to nuclease degradation. AS1411 shows high affinity to the external domain of nucleolin (Bates et al., 1999; Soundararajan et al., 2008), which is a BCL2-mRNA-binding protein involved in cell survival, growth and proliferation, and it is overexpressed on the surface of tumor cells (Berger et al., 2015). After binding to nucleolin, and also thanks to macropinocytosis, AS1411 is rapidly internalized, thus leading to the induction of apoptosis. AS1411 can function as a tumor-targeting agent and it is a promising anticancer agent. It inhibited cancer in various preclinical models (Reyes-Reyes et al., 2010), including breast, renal and lung cancer, and in 2007 it was reported to be well tolerated without serious side effects in an open-label phase I study on advanced solid tumors (Bates et al., 2009) (ClinicalTrials.gov identifier NCT00881244). In 2009, a phase II trial assessed the efficacy and safety of AS1411 combined with cytarabine.
19
Chapter 2
M
ETHODS
2.1 Circular dichroism
Circular dichroism (CD) spectroscopy is a of light absorption technique that measures the difference in absorbance between the right- and left-circularly polarized light, rather than the isotropic light absorption. It is widely used to study the conformations of biomacromolecules being very sensitive to their secondary structure, and also thanks to its other advantages, like:
o Very low sample amount required;
o Very sensitive detection of conformational changes due to temperature, pH and solvent variations.
The electromagnetic radiation is a complex wave that propagates at the speed of light. It is made by two waves that are at right angles to each other and perpendicular to the direction of wave propagation: the magnetic (B) and the electric (E) component. Because the two components are invariably perpendicular to each other, it is an optimal approximation to consider only one of them to simplify the wave description i.e. the E-component. The wave can oscillate in any direction perpendicular to the direction of propagation. When the wave passes through a polarizer, it is polarized. Linear polarized light occurs when the electric field vector (E) propagates in only one plane perpendicular to the direction of propagation, the direction of the vector stays constant and the magnitude oscillates (Figure 2.1A). In circularly polarized light, the E rotates around the propagation axis maintaining a constant magnitude (Figure 2.1B). Light can be circularly polarized in two directions: left and right. If the vector rotates counterclockwise when the observer looks down the axis of propagation, the light is left circularly polarized. If it rotates clockwise, it is right circularly polarized. The differential absorption of radiation polarized in two directions as function of frequency is called dichroism. For plane-polarized light this is called linear dichroism, while for circularly polarized light it is called circular dichroism.
20
Figure 2.1. A) linearly polarized light; B) circularly polarized light.
Inherently asymmetric chromophores (uncommon) or symmetric chromophores in asymmetric environments interact with right- and left-circularly polarized light differently, resulting in two related phenomena. Circularly-polarized light will travel through an optically active medium with different velocities due to the different indices of refraction for right- and left-circularly polarized light. This is called optical rotation or circular birefringence. Right- and left-circularly polarized light will also be absorbed to different extents at some wavelengths due to differences in extinction coefficients for the two polarized rays called circular dichroism (CD):
CD = AL − AR
in which AL is the absorbance of the left-polarized light, and AR is the absorbance of the right-polarized one.
The absorbance is obtained by the Lambert-Beer law: A = ε l c
in which ε is the wavelength-dependent molar absorptivity coefficient (M-1 cm-1), l is the optical path length (cm) and c is the sample concentration (M).
During a CD measurement l and c are constant, hence the CD signal can be expressed as difference between molar absorptivity coefficients:
CD = εL - εR
An optically active sample, i.e. having different extinction coefficient toward right- and left-polarized light, introduces difference between the magnitude of the two components. The resultant E-vector no longer traces a circle over time but rather an ellipse, thus the light is elliptically polarized. Ellipticity is the unit of circular dichroism and is defined as the tangent of the ratio of the minor to major elliptical axis. The ellipticity is directly proportional to the difference between molar absorptivity coefficients of the two light components:
21 𝜃 = 𝜋𝜆(𝜀 − 𝜀 )
𝑙
in which l is the optical path and λ is the wavelength of the incident radiation.
A CD spectrum is a measure of the ellipticity vs the wavelength. The spectrum can be expressed in molar ellipticity ([θ]) in order to compare spectra achieved at different concentrations:
[θ] =
[ ]· = 32.98 Δε degrees M -1 cm-1
A CD spectrum is recorded in the UV-Vis wavelength region. It is similar to the absorption spectrum, but it can have positive and negative bands being a difference between molar absorptivity coefficients.
The chromophores that are active to CD are intrinsically dissymmetric molecules. The dissymmetry can be structural or a consequence of the presence of a chiral center. CD can be applied only to samples that absorb in the UV-Vis region. Buffer baseline is subtracted from the CD spectrum of each sample.
2.2 Fluorescence Spectroscopy
Fluorescence spectroscopy is a technique used to analyze fluorescence emission of a sample. It is based on the use of UV or Vis radiation that excites the electrons of molecules in the sample and causes them to emit an electromagnetic radiation.
The fluorescence spectroscopy is: o Rapid;
o Non-destructive technique; o Relatively inexpensive;
o Sensitive: limits of sensitivity depend on intrinsic fluorescent of the sample; however this technique is usually able to detect very small concentrations of analytes (μM) and has a sensitivity higher than absorption spectroscopy;
o Specific: the number of fluorescent molecules is limited; o Useful to study different types of molecules.
Moreover, the emission of fluorescence radiation is approximately linear in a wide range of concentrations without necessity of sample dilution.
22
Molecules have many accessible electronic states. The electron transition from the ground state to an excited state may be induced by electromagnetic radiation. The relaxation to the ground state can be spontaneous, because the molecule average lifetime in an excited state is limited. In this case the phenomenon is called spontaneous emission. Emission can also be induced by the interaction with an electromagnetic radiation and it is called stimulated emission. Fluorescence is a spontaneous emission of electromagnetic radiation.
The phenomenon of spontaneous emission can be explained using the Jablonski diagram (Figure 2.2):
Figure 2.2. Jablonski diagram.
After molecule absorption of an UV-Vis radiation, the most probable transition occurs with conservation of spin multiplicity, i.e. it is the transition from the singlet ground state (S0) to the first singlet excited state (S1).
The molecule in the excited electronic state may be in any vibrational level and it has the tendency to return to the ground state. The first phenomenon is the transition from an excited to the ground vibrational level. It is called vibrational relaxation and involves the dissipation of energy from the molecule to its surroundings. The fluorescence is the emission of electromagnetic radiation due to the electron transition from S1 to S0. The intersystem crossing is the electron transition from S1 to the triplet excited electronic state (T1). The phosphorescence is the emission of radiation due to the electron transition from T1 to S0. When the molecule
23
returns to S0, it may be in any vibrational level and so successively a vibrational relaxation occurs.
Emission bands of a molecule have greater wavelengths compared to those of its excitation bands, it is a consequence of energy loss due to non-radiative phenomena. As a result, the fluorescence spectrum is similar to the absorption spectrum, but it is shifted to higher wavelengths and this shift is called Stokes shift.
A relevant aspect of the fluorescence is the impossibility to recover the total energy given to the molecule with the excitation. The fluorescence quantum yield (φF) provides an estimation of the energy recovered through the fluorescence process. It is defined as the ratio of the number of photons emitted to the number of photons absorbed. Possible φF values are between zero and one: the ratio is near to one if the molecule has a high fluorescence, φF is near to zero if the molecule has a low fluorescence. The fluorescent molecule is called fluorophore.
2.3 Electrophoresis
Electrophoresis is a general term that describes the migration and separation of charged particles under the influence of an electric field. Most of biological molecules (e.g. amino acids, peptides, proteins, nucleotides, and nucleic acids) has ionizable groups and therefore they can be present in solution as charged species in dependence of the pH.
Gel electrophoresis (GE) is a widely used technique to separate, purify, and identify ionic or ionizable macromolecules in solution. An electrophoretic system consists of two electrodes, i.e. anode and cathode, connected by a conducting medium called electrolyte, in which the electrophoresis gel is immersed. Sample is loaded in appropriate wells and species migrate towards either electrode according to their charge.
The electric force (Fe) is given by the equation: Fe = E q in which E is the electric field and q the charge.
There is a friction that opposes to the motion generated by the electric field. The friction force is given by:
Ff = γ v
in which γ is the friction coefficient and v the migration velocity. At constant speed:
24 Fe = Ff from which is drawn that:
v =
The electrophoretic mobility (m) is defined as: m =
=
It is noted that the electrophoretic mobility exclusively depends on the particle. In the case of a globular molecule, γ is given by:
γ = 6 π η r
in which η is the medium viscosity and r the molecule radius. Then m is:
m =
In conclusion, the electrophoretic mobility of a molecule is determined by its charge, dimension and shape, as well as by the medium viscosity and gel pore size. The electrophoresis allows the separation of molecules from a mixture according to their charge and size.
2.4 Differential scanning calorimetry
Differential scanning calorimetry (DSC) is a calorimetric technique used to study conformational transitions of biomacromolecules and their thermal stability (Gill et al., 2010). DSC major advantages are:
o Universal technique for its possible application in different research areas; o Direct method to determine thermodynamic parameters;
o The absence of optical constituents allows using cloudy/colored solutions.
DSC is the main technique for measuring the thermal properties of biomacromolecules, and particularly to monitor stability and conformational transitions. It measures the heat capacity (Cp) of a sample as a function of temperature, in comparison to a reference.
In a basic DSC experiment, the sample cell (Figure 2.3) contains a solution with the molecule of interest, while the reference cell contains only the solvent. Temperature is raised identically in the two cells at constant rate. The difference in energy required to match the temperature of
25
the two cells is the heat either absorbed or released by molecules in the sample during a transition. These differences in input energy is a measure of molecule heat capacity.
Figure 2.3. Schematic representation of a DSC cells.
An accurate buffer vs buffer (or solvent vs. solvent) baseline scan is required in this technique. A second baseline must be applied to the data to extrapolate pre- and post-transition DSC curve. The choice of this baseline is the most critical step in the analysis because it affects the value of thermodynamic parameters. Several baseline procedures are implemented in DSC software, but the simplest approach is a linear extrapolation.
After a scan sample vs. buffer, the result is a curve (Figure 2.4).
It is possible to program several consecutive heating/cooling cycles to check for reversibility. If the subsequent DSC scans of the same sample overlap, this means that the observed unfolding/folding process is fast compared to the scan rate employed in the experiment and can be considered, at each temperature, an equilibrium process; suggesting the full reversibility of the transition.
26
Figure 2.4. Buffer baseline scan, sample scan (on the left) and final DSC profile (on the right) after subtraction of the buffer baseline are shown. Tm is the melting temperature corresponding to the maximum
of the curve, ΔHo(T
m) is the unfolding enthalpy corresponding to the area under the curve and CPF and CPU
are the heat capacities of folded (F) and unfolded (U) structures corresponding to the pre- and post-transition lines, respectively.
Thermodynamic parameters obtained from DSC experiments are quite sensitive to the structural state of biomolecules and associate with heat-induced macromolecular transitions.
The initial part of the curve provides the heat capacity (CpF) of the folded state; while, the final part provides the heat capacity (CpU) of the unfolded state instead; their difference represents the ΔCp of the molecules transition. The peak is centered at the transition melting temperature (Tm). The melting temperature is considered as the temperature at which 50% of molecules owns its folded conformation and the rest remains unfolded. Higher Tm values are representative of a more stable molecule.
Calorimetric enthalpy (ΔHocal) is the total integrated zone below the peak, which indicates the total transition energy after suitable baseline correction:
ΔHocal (Tm) = ∫ 𝐶 𝑑𝑇
27
Van’t Hoff enthalpy (ΔHoVH) is an independent measurement of the transition enthalpy obtained assuming a two-state transition. ΔHoVH is determined through parameters derived from the experimental graph:
ΔHoVH = kRT2ΔCp(Tm)/ΔHocal(Tm)
in which k is a constant derived from transition stoichiometry, in detail it values 6 for nucleic acids and 4 for proteins.
Information on the transition can be obtained comparing ΔHoVH with ΔHocal. If ΔHoVH is equal to ΔHocal, the transition occurs in a two-state mode. When ΔHoVH exceeds ΔHocal, the macromolecule may be associated as dimer or multimer. When ΔHoVH is less than ΔHocal, one or more intermediates are expected.
The other thermodynamic parameters are derived from these calorimetric ones. The change in entropy (ΔSo) is obtained by:
ΔSo(Tm) =
∫
𝑑𝑇
ΔGo must be calculated at a chosen reference temperature:ΔGo(T) = ΔHo(T) – TΔSo(T)
2.5 Nuclear Magnetic Resonance
Nuclear magnetic resonance (NMR) is a spectroscopic method based on the interaction between energy and matter but, differently from other spectroscopic techniques, it needs a strong static magnetic field.
The usefulness of NMR in chemistry was not appreciated until 1950 when the importance of the so-called chemical shift was discovered (Proctor and Yu, 1950). Indeed, it is in chemistry that NMR has attracted the greatest interest in the recent years.
Nuclear Magnetic Resonance is a property of the nucleus of an atom, which consists of protons and neutrons, related to what is known as nuclear spin (I). This is equivalent to the nucleus acting like a miniature bar magnet. The spin of a nucleus depends on the mass of the isotope and nuclei with even mass and even charge numbers have no spin angular momentum (I=0). These kinds of nuclei are called “NMR inactive” or “NMR silent” since the nuclear spin property is fundamental to enable NMR. Nuclei as hydrogen (1H), carbon (13C), fluorine (19F) and phosphorus (31P), have I = ½, thus they can be analysed using NMR.
28
As showed in Figure 2.5, when the nuclei are not affected by external magnetic field (B0), the spins are randomly oriented in all direction, while if nuclei with I 0 are placed in a magnetic field, they will assume a possible number of different orientations that will correspond to specific energy levels; this number depends on the value of I, in particular it is equal to 2I+1.
Figure 2.5. a) Randomly oriented spins in the absence of a magnetic field. b) Aligned spins in the presence of an applied magnetic field (B0)
The proton (1H) is the most abundant NMR nucleus and it has I = ½, therefore when B0 is applied, these nuclei can assume two possible orientations, α parallel (I = ½) or β antiparallel (I = - ½), each corresponding to an energy level.
The difference in the energy levels is equal to: ∆𝐸 = 𝛾 · 𝐵
where 𝛾 is the gyromagnetic ratio that is constant for a given nucleus (γ = 2.6752 · 108/T/s for protons).
This means that, given a nucleus, the stronger the magnetic field the higher the gap in the energy levels, thus resulting in higher sensitivity in the NMR experiment.
The protons are distributed between the two energy states according to the Boltzmann distribution:
𝑁
𝑁 = exp ∆𝐸 𝑘 ∙ 𝑇
Here 𝑁 and 𝑁 represent the protons populations in the lower and upper energy levels, respectively, k is the Boltzmann constant and T is the temperature.
The number of nuclei is not equal in the two states: a small excess of protons will occupy the lower energy state (α) since it is, indeed, the more favorable state from an energetic point of view. This gives rise to a net magnetization M0, aligned with the applied magnetic field B0.
29
As showed in Figure 2.6, when a radio frequency pulse is applied, the nuclei will absorb energy and undergo nuclear spin transitions from lower to higher energy levels, according to the following equation:
∆𝐸 = ℎ · 𝑣
where h is the Planck constant and v is the frequency of the excitation pulse that induces the transition between the levels. This frequency is referred to as Larmor frequency and depends both on the nucleus and the magnetic field as showed in the following equation:
𝑣 = 𝛾 ∙ 𝐵 2 ∙ 𝜋
No NMR signal is observable when the sample is at equilibrium (in the static magnetic field), since the net magnetization vector has no component on the xy plane where the signal is detected by the detector coil. The duration of the pulse is usually measured in microseconds (μs), and it is called 90° pulse when it brings the magnetization on the xy plane, whereas a 180° pulse flips the net magnetization on the negative z-axis.
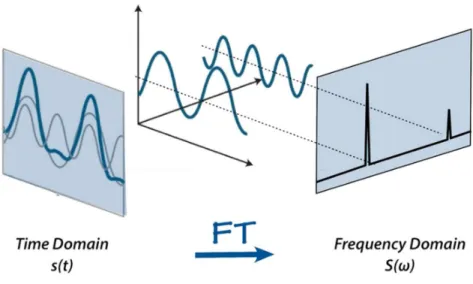
As illustrated in Figure 2.6, when the radiofrequency is switched off, the system will return to equilibrium. This return to equilibrium is referred to as relaxation and it causes the NMR signal to decay with time, producing the observed free induction decay (FID). The NMR signal is then Fourier transformed to be converted in the frequency domain.
Figure 2.6. Schematization of the NMR experiment.
Protons are situated in different positions in a molecule, thus they do not experience the same magnetic field for a phenomenon known as shielding. Indeed, the nucleus is surrounded by electrons that start a rotational motion when an external magnetic field (B0) is applied. This gives rise to a small local magnetic field (Bloc) that may oppose the external field, and, as a
30
consequence, the nucleus experiences a slightly reduced field, that can be called (Beff). A specific parameter (σ, shielding constant) is used to indicate the density and the distribution of the electronic cloud that surrounds the nucleus. This dimensionless constant ranges from 10-6, for lighter nuclei, to 10-3 for heavier ones. The changes in the σ value are given, for example, by the presence of functional groups in the vicinity of a nucleus. In particular, when an electronegative atom is present, it will withdraw electrons from the observed nucleus, reducing the density of the electronic cloud, thus causing a de-shielding effect. Thus, the nucleus will resonate at higher frequencies. Considering that Bloc is equal to B0 σ (Lenz rule), Beff is given by:
𝐵 = 𝐵 − 𝐵 = 𝐵 − 𝐵 𝜎 = 𝐵 (1 − 𝜎)
As a consequence, the relationship between the degree of shielding and the resulting resonance frequency is:
𝑣 = 𝛾 ∙ 𝐵
2 ∙ 𝜋 ∗ (1 − 𝜎)
Therefore, protons situated in different chemical environments will experience different magnetic fields, thus meaning that they will resonate at different frequencies giving rise to the so-called chemical shift (δ). All the information retrievable from a NMR experiment is hidden in the chemical shift, thus it is crucial to only look at the frequencies of the different nuclei in a way that is independent from the magnetic field employed. For this reason, a conventional way to calculate δ has been established:
𝛿 = 𝑣 ∙ 𝑣
𝑣 ∗ 10
where v is the frequency of the observed nucleus and vref is the frequency of a reference compound. The most widely used reference compounds are tetramethylsilane, Si(CH3)4 (simply called TMS) for organic solvents and the sodium salt of trimethylsilyl propionic acid (TSP) for aqueous solutions. Both compounds have maximum shielding, showing higher σ than the nuclei usually analyzed via NMR. Therefore, the previous equation converts the chemical shift frequencies into parts per million (ppm), allowing to display the NMR signals on a new axis on which a given spin always shows the same value independently of the magnetic field employed. In this new system the reference compound has δ = 0, while the sample resonances have positive δ values.
31
Figure 2.7. Approximate proton chemical shifts.
Chemical shift is not the only value to inspect to retrieve chemical information from the NMR experiment. Other valuable features are the J coupling and the scalar coupling. This phenomenon is due to the fact that the magnetic moments of the nuclei can influence each other in two possible ways: through space (dipolar coupling) or through chemical bonds (scalar coupling). The effect of the dipolar coupling can be neglected since the interactions average to zero because of the rapid molecular tumbling while the scalar coupling is visible from the NMR spectrum.
Indeed, when an atom is influenced by another, this results in the split of its resonance signal. When the perturbing nucleus is the observed one, it also exhibits signal splitting. In order to observe the splitting of the signal, the interacting nuclei must be bonded in proximity (e.g. vicinal and geminal positions) or be oriented in certain optimal configurations. Usually the signal splitting in proton spectra ranges from fractions of Hz to around 18 Hz.
After the nuclei excitation by means of a radiofrequency pulse, the net magnetization will flip on the xy plane (90° pulse). Here the spins start to precess (rotate) both clockwise and counter-clockwise, thus, a detection system with two simultaneous channels (reciprocally 90° out of phase), on each axis, is often employed in order to distinguish the spin with a frequency
–v and one with a frequency +v. This is called quadrature detection.
Therefore, after the pulsed excitation, the nuclei return to the equilibrium distribution between the two energy levels through a process called relaxation, with relaxation times that are specific for different nuclei. This process generates the free induction decay (FID). The FID is a time-domain representation of the superimposition of the frequencies of all the nuclei
32
present in the analyzed sample, thus it is not easy to interpret. Fourier transform is a mathematical operation that can be carried out on the final FID data to produce the familiar frequency spectrum (Figure 2.8).
Figure 2.8. Illustration of the Fourier Transformation from the Time Domain s(t) to the Frequency Domain S(ω).
2.6 Microscale Thermophoresis
MicroScale Thermophoresis (MST) is a powerful technique to quantify biomolecular interactions. It is based on thermophoresis, the directed movement of molecules in a temperature gradient, which strongly depends on a variety of molecular properties such as size, charge, hydration shell or conformation. Thus, this technique is highly sensitive to virtually any change in molecular properties, allowing for a precise quantification of molecular events independent of the size or nature of the investigated compound. During an MST experiment, a temperature gradient is induced by an infrared laser. The directed movement of molecules through the temperature gradient is detected and quantified using either covalently attached or intrinsic fluorophores. By combining the precision of fluorescence detection with the variability and sensitivity of thermophoresis, MST provides a flexible, robust and fast way to dissect molecular interactions.
The phenomenon of thermophoresis was first described by Ludwig and describes the directed motion of molecules through a temperature gradient. In recent years, MST emerged as
33
a revolutionary method to monitor the directed movement of fluorescent molecules through microscopic temperature gradients in µl-volumes, allowing for the precise analysis of binding events in a few microliter solution of virtually any molecule–independent of size or physical properties (Jerabek-Willemsen et al., 2011; Wienken et al., 2010). Therefore, MST can even detect events such as binding of small molecules to proteins, substrates to enzymes, or ligands to liposomes.
Thermophoresis describes a directed movement of particles in a temperature gradient. A temperature difference ∆T in space leads to a depletion of the solvated biomolecules in the region of elevated temperature, quantified by the Soret coefficient ST:
𝐶
𝐶 = exp(−𝑆 ∆𝑇)
This thermophoretic depletion depends on the interface between molecule and solvent. Under constant buffer conditions, thermophoresis probes the size, charge and solvation entropy of the molecules. Typically, the thermophoresis of a protein significantly differs from the thermophoresis of a protein–ligand complex due to binding-induced changes in size, charge and solvation energy. Even if ligand binding could not significantly affect the size or charge of a protein, MST can still detect it, because of binding-induced changes in the molecules solvation entropy (Seidel et al., 2013).
Figures 2.9 A and B show the Monolith NT.115 instrument from NanoTemper Technologies GmbH, the capillary tray that can accommodate up to 16 capillaries, and the schematic representation of MST optics. MST is measured in capillaries with a total volume of ∼4 μL. The fluorescence within the capillary is excited and detected through the same objective. A focused IR-Laser is used to locally heat a defined sample volume. Thermophoresis of fluorescent molecules through the temperature gradient is detected and it allows to get the signal of an MST experiment (Figure 2.9 C). Initially, the molecules are homogeneously distributed and a constant “initial fluorescence” is detected. Within the first second after activation of the IR laser, the “T-Jump” is observed, which corresponds to a rapid change in fluorophore properties due to the fast temperature change. Subsequently, thermophoretic movement of the fluorescently-labeled molecules out of the heated sample volume can be detected. Typically, the fluorescence change is measured for 30 s. After deactivation of the IR-Laser, an inverse T-Jump occurs, followed by the “back-diffusion” of molecules, which is solely driven by mass diffusion.

![Figure 1.11. A) G‐triads involved in the formation of the G‐triplex; B) 3D representation of the G‐triplex [adapted from (Limongelli et al., 2013)]](https://thumb-eu.123doks.com/thumbv2/123dokorg/2764358.1120/18.918.282.620.395.692/figure-involved-formation-triplex-representation-triplex-adapted-limongelli.webp)