Fertility and child mortality in their
household setting:
a variety of perspectives from U
Kcensuses, 1861-1911
E I L I D H G A R R E T T , A L I C E R E I D , S I M O N S Z R E T E R University of Cambridge
1. Introduction. In Britain previous research into both the fertility transition and
the decline in infant and child mortality in the late nineteenth and early twentieth centuries has largely had to rely on data published in contemporary reports, and on information obtained indirectly from details contained in census enumerators’ books, as actual details on individual births, marriages and deaths are not easy to come by. This paper outlines new approaches to the study of fertility behaviour and infant mortality decline using the nineteenth-century and early twentieth-century censuses of England & Wales, Scotland and Ireland which have become possible with the release of individual level data from the 1911 census. The latter included specific questions on length of marriage, number of children born within the mar-riage and the number of children surviving in all four countries. The authors’ cur-rent research, exploring the impact of geographic mobility on the various perspec-tives which can be gleaned from census data, both on its own and when used in combination with record linkage, is considered. In order to place this work in con-text the initial sections of the paper outline the pathways of investigation which led to the current research, considering what is known about the demographic changes with respect to fertility and infant mortality taking place in Victorian and Edwardian Britain, the problems and advantages of the sources available and the methods used to derive useful measures from them, and the various perspectives which different approaches to the data offer. Work on both England & Wales and Scotland will be discussed, before finally turning to the issue of mobility and exam-ining how it needs to be taken into account when approaching the study of demo-graphic behaviour and experience as represented in the 1911 census schedules. For this, material available for the city of Belfast, in what is now Northern Ireland, will be used.
2. Demographic context. The progression of demographic change in the British
Isles can be charted over the course of the second half of the nineteenth century and the opening decades of the twentieth century using data at the level of the nations comprising the islands. Researchers interested in the fall of fertility and infant mor-tality can plot time trends in these rates for England & Wales, Scotland and Ireland from the 1860s onwards. Although decennial censuses were held in all three coun-tries from the early years of the nineteenth century, and the state registration system of births, marriages and deaths for England & Wales began in 1837, similar, com-prehensive ‘civil registration’ of vital events did not start until 1855 in Scotland and
1864 in Ireland1. Thus, while it is possible to chart and compare the infant
mortal-ity rate (IMR, i.e. deaths to children under one year of age per 1000 children born
alive), for the three countries for each year from 1864, the Princeton index of mar-ital fertility, Ig, can only be directly compared from 1871 to 1911, when census counts of married women in the reproductive age groups are available alongside annual counts of births2. I
g expresses the actual number of births produced by
mar-ried women in the reproductive age span as a proportion of the number they would have had if they had followed the age-specific marital fertility schedule of the Hutterite population in America during the 1920s, who were believed not to have
limited their births in any way (Woods 1982, 111; Coale, Treadway 1986, 33-34)3.
Total marital fertility rates (TMFRs) and age specific marital fertility rates (ASMFRs)
are in many ways more informative than Ig, but unfortunately tables of the number
of births by age of mother is not provided in the reports of the Registrars General during this period, as the ages of parents were not recorded on birth certificates (Nissel 1987, 27).
After 1911 in Ireland the situation becomes somewhat complex. In 1922, after several years of political turmoil, three hundred years of British rule ended with the partition of Ireland into the Irish Free State, later known as the Republic of Ireland or, simply, Ireland, and Northern Ireland, consisting of six of the nine counties in the province of Ulster. The political situation was such that the Registrar-General for Ireland found himself unable to use his traditional enumerators, the police force, to conduct the 1921 census (Linehan 1997/8). No substitute work force could be found and therefore the Census of Ireland was postponed until 1926, when separate censuses were conducted in both the North and the South. The sub-sequent census for the Irish Free State was held in 1936, and that for Northern Ireland in 1937. Vital registration reports were also compiled separately by the Registrar-General for Northern Ireland and the Registrar-General for Ireland from
19224. Coale and Treadway report values of I
g calculated for the whole of Ireland,
and the constituent counties both north and south of the border, for 1926 and,
ostensibly, for 1936, as shown in Figure 1A5.
From 1922 onwards separate counts of demographic events were produced for
Ireland and Northern Ireland, and this is reflected in the IMRs shown in Figure 1B.
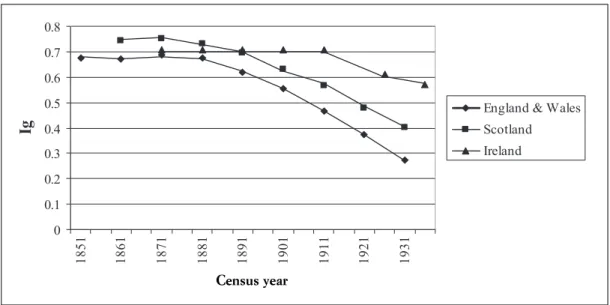
Figure 1A indicates that while Ig lay at 0.7 or more for all three countries in 1871,
thereafter fertility fell in both England & Wales and Scotland, but showed little
decline in Ireland until after 19116. Out of the three countries, England & Wales
had the highest IMR until the first decade of the twentieth century, roughly 20
deaths per 1000 live births higher than Scotland, and between 40 and 60 deaths above Ireland (Figure 1B). Across the first three decades of the twentieth century all three countries saw decline in their IMRs, but the fall was most dramatic in
England and Wales, where it fell from a peak of 163 infant deaths per 1000 live births in 1899 to just 83 infant deaths per 1000 (or 51% of the 1899 level) in 1921.
In Scotland the highest IMRwas 128 infant deaths per 1000 live births in 1897 and
in Ireland; 110 in 1898. By 1921 the IMRin Scotland had fallen to 65% of its
survival was therefore swiftest in England & Wales, by 1921 there was relatively lit-tle absolute difference in levels between the four countries, although Scotland and
Northern Ireland appeared to have slightly higher IMRs than England & Wales and the
Irish Free State (where the majority of the population still lived a relatively rural exis-tence, particularly compared to the more urbanised population of Northern Ireland).
0 0.1 0.2 0.3 0.4 0.5 0.6 0.7 0.8 1851 1861 1871 1881 1891 1901 1911 1921 1931 Ig
England & Wales Scotland Ireland
Fig. 1A. Values of Ig, the index of marital fertility, for England & Wales, Scotland and Ireland 1851-1936
Source: Coale, Treadway 1986, Appendix A, 88, 120, 141. (Figures for 1926 and 1936 refer to Ireland and Northern Ireland combined) (Please see endnotes 2 and 5).
0 20 40 60 80 100 120 140 160 180 1864 1867 1870 1873 1876 1879 1882 1885 1888 1891 1894 1897 1900 1903 1906 1909 1912 1915 1918 1921 1924 IM R p er 1 00 0 l iv e b ir th s
England and Wales Scotland Ireland Northern Ireland Irish Free State Fig. 1B. Infant Mortality Rate (IMR) per 1000 live births: England & Wales, Scotland and Ireland compared, 1864-1926
Source: Annual Reports for the Registrars General for England & Wales, Scotland and Ireland. Those for England and Wales may be accessed via www.histpop.org.uk, those for Ireland via www.nisra.gov.uk/
demography/publications/ann-reports/historical.
Year Census year
3. Sources. Understanding of the mechanisms underlying declines in marital
fertil-ity and infant mortalfertil-ity has been pursued at several levels, from the nation to
indi-vidual decision makers7, but one of the most informative avenues of research has
been work conducted at the level of the couple, the wider family and the commu-nity. For this individual level data on family building patterns is required. Unfortunately in Britain legislation surrounding the civil registration systems has meant that it is not easy to obtain official data concerning individual demographic
events even for the nineteenth century8, although studies do exist using alternative
sources, for example the Kingston Local History project, and a project addressing the ‘Sociological Study of Fertility and Mortality in Ipswich 1872-1910’, conducted by a team from the Open University and the University of Essex9. The General
Register Office for Scotland has on occasion granted special permission for
acade-mic access to their registers of births, marriages and deaths10. However the
decen-nial censuses remain the most comprehensive source for the analysis of fertility behaviour in nineteenth century Britain although several demographic assumptions have to be deployed in order to calculate estimates of average number of children born to each couple.
From 1841 to 1911 there were three Census-taking authorities covering the British Isles: The General Register Office for England & Wales, the General Register Office for Scotland and the General Register Office for Ireland11. The
extensive reports published by each of the Registrars-General for each census may be found online at the www.histpop.org website. Access to the individual level cen-sus schedules has however generally been restricted. In England & Wales the Registrar General employed a ‘Hundred Years Rule’ meaning that census returns could not be consulted in any form until a full century had passed12. Until very
recently their use was highly time-consuming as only micro-film versions were avail-able, so that researchers had to transcribe their contents into machine readable form. Over the last few years online versions have become available on a pay per view basis, but data selection is generally restricted to searches on individuals’
names, which precludes systematic academic use for research purposes13. The
exception has been the 1881 census which was made machine-readable in its entire-ty by the Church of the Latter Day Saints, and a tidied and coded version of this
has been available via the Economic and Social Data Service since the late 1990s14.
New initiatives mean, however, that in the future historians and historical demog-raphers, as well as genealogists and local historians will have much greater access to
this remarkable resource15.
The censuses in Britain all contained basic information recording the address of a household, a list of the names of constituent individuals alongside their relation-ship to the head of the household, their marital status, sex, age, occupation and birthplace. Additional questions were asked in certain censuses, and Scotland, Wales and Ireland sometimes had additional questions to those asked in England, particularly regarding ability to speak Gaelic, Erse or Irish Gaelic, or Welsh. In Ireland a question on religion was also asked from 1861 onwards. Unfortunately, however, only the original census schedules for 1901 and 1911 for Ireland can be
consulted, the previous ones having been destroyed16. Both sets of the surviving
records for Ireland and Northern Ireland have been available for scrutiny in Dublin, Ireland, for some years. They are now freely available on a public website run by the National Archives of Ireland: www.census.nationalarchives.ie.
4. Methods. Those wishing to monitor fertility behaviour in the censuses from 1851
to 1901 have to resort to the ‘own child method’ of fertility estimation17. Married
couples where both husband and wife are resident at the same address on census night, and where the wife is reported to be within the ‘fertile’ age range, often 20-44 or 20-49; and sometimes 15-49, are identified and the number of children aged less than 5 co-resident with them counted. Multipliers then have to be applied to inflate the number of children observed to allow for those who may not be living with their parents on census night and, more importantly, those who died before they could be recorded in the census. Unfortunately, while these two parameters may be known or estimated for the total population under observation, they are not always known for subgroups within the population. One might know the infant mortality rate experienced in a particular registration district, for instance, as this is reported in the Registrar General’s annual or decennial reports, but one then has to assume that all children in that district have the same survival chances, as
occupa-tional or social class variations in infant mortality are not reported18. Thus the
num-ber of married women surviving to the census and the numnum-ber of children estimat-ed to have been born to them can be usestimat-ed to calculate age specific marital fertility curves, which may then be graphed in order to compare differences in their level
and shape, as a means of detecting variations in fertility behaviour19. However, it is
difficult to interpret differences between the social or occupational groups being studied or differences across time as variations observed may be caused by differ-ences in fertility, differdiffer-ences in mortality, or differdiffer-ences in both.
Both the English & Welsh and Scottish censuses for 1911 are now publicly available for a fee, for searches on individual names or addresses at: www.1911cen-sus.co.uk and www.scotlandspeople.gov.uk. The interest for historical demogra-phers in the 1911 census results from the special questions asked regarding the ‘fer-tility of marriage’. Each ‘currently married’ woman was asked how many years she had been in her current marriage, how many live children she had borne within the marriage, how many of these were still alive, and the number who had died, although no information was asked about the sex of the children, nor when or at what age those lost had died. In Ireland and Scotland only the number of children born and still living were required; the number dead has to be calculated by simple arithmetic. These records have the advantage that estimates of infant and child mortality may be made for individual couples or for social, economic or geograph-ic groups, thus distinguishing more clearly the impact of mortality and fertility on measures of fertility behaviour. Unfortunately the figures for infant and child sur-vival can only be estimated because the responses to the 1911 census questions report only the number of children each couple has lost, not the age at which they died. Some older women, with long marital durations may have reported the deaths
of teenage or even adult children, but there are well-established and robust tech-niques for producing estimates of infant mortality from these reports.
These techniques, known as ‘indirect estimation’, use the answers to the chil-dren-ever-born and children-died questions on the 1911 census to estimate levels of infant mortality over the ten to fifteen years leading up to 1911. Women are divid-ed into groups according to the length of time they had been marridivid-ed (generally five year age groups) and the number of women in each group are counted, together with the total number of children ever born to the women in that group and the total number of children who had died. Each marital duration group of women therefore generates a rough survival probability in the ratio of children dead to chil-dren ever born. As they stand, these are not good estimations of infant mortality because they will include the mortality of children older than infants. Women mar-ried for longer durations will include a larger component of older child mortality, and their ratios will refer to times further in the past, which will be an important consideration when mortality is declining. The average age of the children and time to which each estimate refers depends on the fertility regime of the population in question. Techniques of indirect estimation use child/woman ratios in successive marital status groups to adjust sets of carefully tested multipliers, which in turn adjust the ratios of deaths/births so that they more closely represent the risk of
death to an exact age of childhood20. Model life tables or a relational life table
sys-tem together with a suitable standard life table can be used to express all these risks as infant mortality (or mortality to some other age), and more combinations of child-woman ratios and multipliers can locate the estimates in time21. Typically,
women married for less than five years provide estimates of mortality between birth and age two, and refer to about two years before the census. Women married between five and ten years provide estimates of mortality up to age three, which refer to about four years before the census, and so on, with the longest married group, generally women married for 25 to 29 years, providing estimates of
mortal-ity between birth and age 20, which refer to about fifteen years before the census22.
Of course it is probable that the reports of number of children born (and the num-ber of children who had died in England & Wales) were subject to ‘recall bias’, a phenomenon well recognised by those undertaking present day demographic sur-veys (Demographic and Health Survey 2011). The accuracy of the answers to the 1911 ‘fertility of marriage’ questions is currently being investigated by the authors. It does not appear to have been rigorously investigated by contemporary census authorities, although for England & Wales the 1923 report on the ‘Fertility of Marriage’ census noted that «[…] there is little evidence in the returns of misstate-ment of the numbers of living or dead children» (British Parliamisstate-mentary Papers,
hereafter BPP, 1923, vii). Considerably more anxiety was, however, expressed about
the accuracy of the statements of marriage duration (BPP1923, vii-xi).
5. Perspectives. Such caveats notwithstanding, the 1911 census provides the
opportunity to estimate trajectories of infant mortality for around fifteen years before the census. Such trajectories can be produced for different groups of
women, by religion, social class, type of housing and so on. Since these techniques use child-woman ratios for each group considered, they can take into account dif-ferences due to fertility, but it should be remembered that they assume the same age pattern of mortality across all groups, thus may understate declines over time if mortality at older ages of childhood declines earlier than mortality at younger ages23. It is also important to realise that time trends in infant mortality derived this
way are composites from different groups of women, and in particular that the esti-mates close to the census will be provided by those who have been married a short time, who will be younger than and at a different stage in their life-cycle from the longer-married, older women providing the estimates further in the past. When examining mortality by characteristics which do not, or are unlikely to, change such as religion and possibly social class, this is not a problem. However we may want to examine the influence on mortality of characteristics such as women’s occupation-al status or housing which may be far from constant over a couple’s procreative career. Characteristics such as these are generally measured using the information provided in the census, thus they will reflect circumstances in 1911. It is possible they may also accurately reflect the family’s circumstances in previous years, when the children whose survival is reported were at risk of death, but that cannot be assumed. Investigations of the influences on infant mortality differentials may be confused by this mismatch in retrospective and cross-sectional information. Two examples of this are detailed below, after discussion of the greater power of indi-vidual level returns over published reports.
In the late 1980s the Cambridge Group for the History of Population and Social Structure was given special access by the then Office of Population Censuses and Surveys (now the Office for National Statistics) to data for samples from 13 com-munities across England and Wales from the 1891, 1901, 1911 and 1921 censuses, ahead of their public release (Garrett et al. 2001). As part of the access arrange-ments all names were removed from the data. The information from the 1911 cen-sus was used to study changes in fertility and child survival rates from 1891 to 1911 across the different communities and among the different groups within them (Garrett et al. 2001). Part I of the report on the 1911 Fertility Census for England and Wales, published in 1917, provided tables showing social class gradients in
both fertility and infant mortality (BPP1917). Fertility was lowest amongst the
high-est social class groups, and highhigh-est amongst the lowhigh-est social class V, and ‘agricul-tural labourers’ and ‘miners’, two additional ‘occupational’ groups included in the social class scale. ‘Textile workers’, a third ‘occupational group’, had fertility in a range similar to social classes II or III. Estimates of infant mortality made using the 1917 report showed that there was again a social class gradient to infant mortality, with the best survival rates being experienced by the highest class; social class I, and the worst rates being the lot of social class V. However miners and textile workers both experienced rates of infant mortality as high, if not higher, than social class V, while the children of agricultural labourers had rates of survival akin to those of social classes I & II (BPP 1917; Garrett et al. 2001, 187, Fig. 4.11.1). Other
dis-parities in infant mortality levels in England and Wales (Watterson 1988; Woods, Williams 1995, Woods et al. 1988). Preston and Haines re-analysed the aggregate
data from the 1911 census report in a comparison with the USAand concluded that
while the major influence on mortality among the very young in America was race,
in the UK it was class (Preston, Haines 1991). However these researchers were
restricted to the tabulations in the 1911 report and were not able to group the data in different ways or to control for different factors.
Using the data from the 13 communities in their sample Garrett et al. showed that the social class differences reflected a more complicated picture of mortality determinants in which residential location was central: both fertility and child mor-tality were strongly influenced by the ‘environment’ in which a couple lived. Members of lower social classes, if they lived in white collar neighbourhoods, while having a little higher fertility and infant mortality than their higher class neighbours would nevertheless have substantially lower rates of both fertility and infant mor-tality than their social status peers living in other, less privileged environments. In contrast, white collar workers living in industrial areas would have somewhat lower fertility and infant mortality than the working class groups amongst which they lived, but would have higher rates of fertility and infant mortality than those white collar workers living in middle-class neighbourhoods (Garrett et al. 2001, 245, Fig. 5.3.3). Social class, however, appears to have been a major influence on where peo-ple lived, dictating the physical environment and social amenities which the major-ity of each class experienced. The large differentials in mortalmajor-ity by social class, so clear in the aggregate data, were thus, it is argued, a product of strong residential clustering along social class, occupational and, in particular, environmental lines.
As estimates of infant and child mortality could be made for the fifteen years or so prior to the 1911 census from the responses to the questions on ‘number of chil-dren ever born’ and ‘number of chilchil-dren dead’, and as fertility changes in the vari-ous communities and population groups and sub-groups within those communities could also be charted, it was possible to see how the different cohorts of individu-als present in 1911 had had different experiences of both fertility and child survival. However examination of the data also revealed that caution had to be exercised in interpretation of the responses to the 1911 census, as the census collected the data retrospectively, and so there was a not inconsiderable chance that selection effects were in operation, making particular groups look particularly fertile or particularly susceptible to child loss.
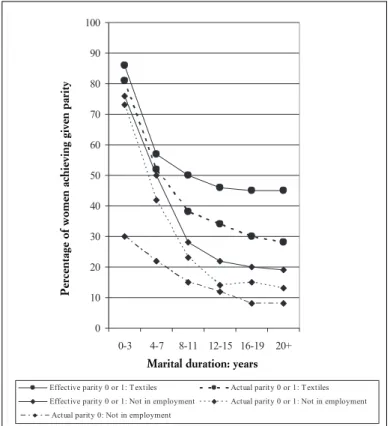
The textile workers of Bolton, one of the communities used in the Cambridge study provide a case in point (see Fig. 2). At the national level textiles workers, as discussed above, showed lower than expected fertility levels for a working class group and relatively poor infant survival chances; the data collected retrospective-ly by the census in 1911 gave the impression that working in textiles caused, or encouraged, low fertility and possibly also higher infant mortality. Married women, aged less than 50, in Bolton were separated into two groups; those who were returned as working in textiles on census day, 1911 (just under 20%) and those who
either actual – only zero or one child born – or effective – only zero or one child remaining alive – were identified, and further divided into six marital duration groups; 0-3, 4-7, 8-11, 12-15, 16-19 and 20 or more (20+) years. It was evident that there was a far higher proportion of women with these very low parities amongst textile workers than amongst those without paid employment. However the differ-ence became more acute as marital duration increased. Amongst those married less than 4 years who were textile workers some 85 per cent had no children or only 1 child alive. Amongst those reporting no employment this proportion was about 75%. Largely these small family sizes were due to the fact that at such a short mar-ital duration women had not borne large numbers of children, but a small fraction had lost a child or children, reducing their effective family size to less than 2. As marital duration increased, however, the average parity increased in both groups, although even amongst those recording no employment and married for more than 20 years almost 10% had not borne any children at all, as the lowest line in Figure
2 shows25. A further few percent of such women had had only one child, so some
14-15% had given birth to fewer than 2 children. Infant mortality had reduced another five percent of these families to this very small size, so roughly one in five women who had been married more than 20 years, or indeed 12-15 or 16-19 years, and who were not in paid employment in 1911, had fewer than 2 children alive. Amongst those observed as textile workers in 1911, however, around 30-35% mar-ried 12 years or more had had only 0 or 1 child, but infant and child mortality had increased the proportion with only 0 or 1 living children to over 45% in these
mar-0 10 20 30 40 50 60 70 80 90 100 0-3 4-7 8-11 12-15 16-19 20+
Marital duration: years
Pe rc en ta ge o f w om en in e m pl oy m en t c ate go ry
Effective parity 0 or 1: Textiles Actual parity 0 or 1: Textiles
Effective parity 0 or 1: Not in employment Actual parity 0 or 1: Not in employment
Actual parity 0: Not in employment
Fig. 2. The percentage of women employed in textiles achieving an actual or effective parity of 0 or 1, by marital duration, compared with women not in paid employ-ment; Bolton, Lancashire, 1911
Source: Garrett et al. 2001, Figure 5.8.4, 308. Percentage of women achieving given parity
ital duration groups. The concentration of low parity women in the textile work-force suggests a selection effect; as women accumulated more children they were likely to drop out of the workforce, and into the ‘not in paid employment’ catego-ry, a process not easily captured by a survey such as the census. If a woman lost a child, and had fewer children to care for, she might be more willing or able to take up paid employment again. Thus while these female textile workers, as a group, look both less fertile and subject to higher infant mortality, it is in fact this demo-graphic experience which increases their chances of being observed as textile work-ers, rather than their employment experience which necessarily leads to their low fertility and higher mortality amongst their offspring; the direction of the causal pathway is obscured by the retrospective nature of the census questions masking the underlying process of causation.
In order to unravel the true nature of the causal mechanisms in relationships such as that between occupation and observed demographic behaviour or experi-ence one really needs prospective data, such as that available through population registers or family reconstitutions. Unfortunately the United Kingdom has never had any continuous population registration systems, and the rules and regulations constraining the use of civil registers of births, marriages and deaths make it diffi-cult to use these in a manner akin to family reconstitution. However, having been given special permission by the Registrar General for Scotland to access the civil registration material for certain communities, primarily on the Isle of Skye, and the town of Kilmarnock, Reid, Garrett, Davies and Blaikie have undertaken an exercise linking the births, marriages and deaths from 1861-1901 to families and individuals listed in the censuses of these communities in 1861, 1871, 1881, 1891 and 1901 (Blaikie et al. 2005, 2006; Reid et al. 2002 [2006]; Davies, Garrett 2005; Garrett 2006). Eventually it is hoped to incorporate an additional decade of demographic events and the census of 1911. As yet it has not proven possible to construct suffi-cient prospective employment histories amongst married women to ascertain for certain just how demography impacts on participation in the workforce, or vice versa, but certain other aspects of life have been demonstrated to take on rather dif-ferent trajectories, depending on whether one views them prospectively or retro-spectively.
On the island of Skye, for example, two of the main occupations for men are ‘crofter’ and ‘fishermen’. In the census, as indicated in Figure 3, crofters, or self suf-ficient smallholders, are shown to be older, and fishing is shown to be predomi-nantly an occupation for the young, and the marriage registers indicate that crofters married some three years later than fishermen. What is not apparent, unless one fol-lows the men over time by linking them from one census to the next, adding in the relevant details from the civil registers, is that ‘fisherman’ was an initial occupation for young men on the island, very often the sons of crofters. It was unusual for a man to call himself a crofter until his father had died and he had inherited the croft. While he waited to take on the croft the young man would supplement the family income by taking to the sea. If a man married young he was therefore very likely to give ‘fisherman’ as his occupation. If however he waited to inherit the croft before
marrying, then he would be noted as a crofter. Scottish marriage certificates note the names of both the parents of grooms and of brides – and also whether any of these individuals are dead at the time of their child’s marriage. A much higher pro-portion of crofter grooms (72%) on Skye during the study period were noted to have lost their fathers then was true of fisherman grooms (40%). Men marrying young were thus less likely to have lost their fathers and more likely to be observed as fishermen; being a fisherman per se did not lead to early marriage.
Record linkage using nineteenth century censuses and civil registers can thus provide new perspectives on the social, economic and demographic lives of the Victorian population of the United Kingdom, but unfortunately such work is not easy to undertake at present. Nevertheless the insights provided by the work report-ed above did suggest quite strongly that different communities had different rates of migration. Record linkage for rural Skye had a much higher success rate than that in urban Kilmarnock, for instance. This raised the question of the impact of such differences on demographic measures, whether taken from the usual decennial ‘stock taking’ censuses, from the retrospective data collected in the 1911 census, or from the linked data providing a longitudinal database. Would our understanding of, say, the influences on infant mortality be different if we took a prospective, rather than a retrospective, or even a ‘static’ view of particular communities?
0 20 40 60 80 100 120 140 160 15- 20- 25- 30- 35- 40- 45- 50- 55- 60- 65- 70- 75- 80- 85- 90+ Age group crofter fisherman Fig. 3. The number of men returning themselves as ‘crofter’ or ‘fisherman’ in the 1891 census the Isle of Skye, by 5 year age group, 15-90+
Note: The graph shows only those men who returned themselves exactly as ‘crofter’ or ‘fisherman’. ‘Crofter/fisherman’, ‘fisherman/crofter’, ‘crofter and grocer’, etc. were not included in the count. Source: 1891 Census enumerators’ books, Isle of Skye. May be accessed at the Economic and Social Data Service, UKData Archive, (http://www.esds.ac.uk) study SN 5596: Scottish Census Enumerators’ Books:
Skye, Kilmarnock, Rothiemay and Torthorwald, 1861-1901.
Num
be
r of
m
6. Movers, stayers and infant mortality – the case of Belfast. We now return to
the issue of infant mortality and the problem that information measured at the time of the census will reflect circumstances in 1911 but not necessarily at the period when children were at risk of death in a context of much migration and short-dis-tance residential mobility. In Victorian cities, where rents were renegotiated at least once a year, this problem may be particularly acute. If people tended to move between similar houses, facilities and neighbourhoods, then it might be reasonable to use housing in 1911 as an indicator of the housing conditions experienced when the children were at risk of death, even if it was not the same house that was lived in throughout. The extent and seriousness of this problem can be addressed using a unique data set for the city of Belfast, Northern Ireland which allows mobility between the 1901 and 1911 censuses of Belfast to be tracked and the mortality experiences of ‘stayers’ and ‘movers’ to be compared. Samples of data from partic-ular streets in the 1901 and 1911 censuses of Belfast have been transcribed by the
BelFam project26. The sample contains 37,643 people in 1911, around ten per cent
of the total population of Belfast, representing three sizeable distinct socio-eco-nomic and cultural neighbourhoods. Then, as now, Belfast was highly segregated along sectarian grounds as well as on socio-economic lines. Streets from three main areas were chosen: the area around the Shankill Road was a working-class Protestant area, the Falls Road area (including some of Smithfield Ward) was a working-class Catholic area, and Windsor (also including some of Cromac and St George’s Wards) was inhabited by more middle-class people, who were mainly of the Protestant faith. The data-set also contains a few streets in Pottinger Ward, east-ern Belfast, but these are too few for meaningful analysis and are rarely presented as a unit, although their inhabitants are included in analysis which covers the whole of the dataset.
In addition, the census data have been combined with street directories to enable a more precise investigation of mobility over the short term. Street directo-ries grew out of trade directodirecto-ries which had provided listings of tradesmen and pro-fessional people, but by the end of the nineteenth century independent companies in most cities of the British Isles were producing expanded directories. These typi-cally contained not only thematic lists of trades people, businesses and profession-als, but also comprehensive listings of the name and occupation of the head of
household living at every street address in the city27. The Belfast and Province of
Ulster Directory was one such directory, established by the publisher John
Henderson, and appearing biennially between 1852 and 1894, then annually from
1894 until 199628. Some of this data had already been made available in machine
readable form on the website www.lennonwylie.co.uk, from where the relevant
streets from the street directories of 1901, 1907, 1908 and 1910 were downloaded29.
These were supplemented by transcription of the same streets for 1903 and 1905 to allow the examination of household stability and movement at biennial or smaller intervals across the intercensal period, 1901-11.
Because we are interested in whether people we see in the 1911 census were there in previous years, we work backwards in time, seeing if an occupant in 1911
was already living in the same house in 1910, 1908, 1907 and back to 1901. We term this ‘retrospective persistence’ to distinguish it from ‘prospective persistence’ which would look forward through time. We count a ‘stable’ or ‘continuing’ household as one where the surname is the same in both sources. In the majority of cases the fore-name is also the same (or the initial, as frequently only the initial is given in the street directories), but there are instances where a different member of the same
household appears as the head or reported occupant30. In the first decade of the
twentieth century there was great scope for residential mobility within Belfast, as the previous two decades, especially the 1890s, had seen a house building boom. Estimates suggest that some 50,000 houses were built in Belfast over the 1880s and 1890s (Collins 1983), however the change in the city’s boundaries in 1896, makes
this difficult to verify31. The 1901 census report shows 13.2 per cent of the almost
78,000 houses in the city lying empty. By 1911 a further 2,000 houses had been
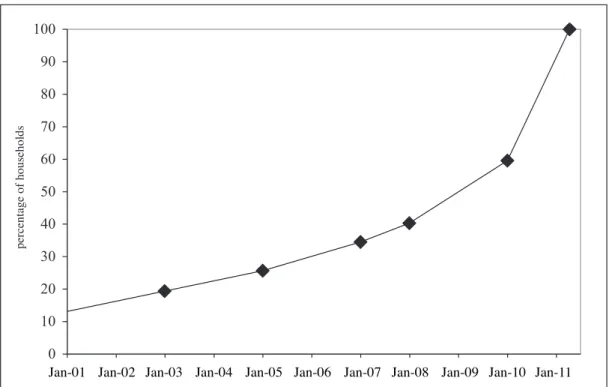
erected, but only 6.1 per cent of these were uninhabited (BPP1912-13, 1). Figure 4
shows, for the whole of the Belfast sample in 1911, the percentages of households who could be observed at their 1911 address in previous years. Household mobili-ty was at such a high level that only around 60% of the families present when the 1911 census was taken in April of that year had been there 15 months earlier in January 1910 when the information for the 1910 street directory is assumed to have been collected. Ten years before 1911, only about 15% of 1911 households were living at the same address. Of course many of the 85% of movers had probably
0 10 20 30 40 50 60 70 80 90 100 pe rc en tag e o f h ou se ho ld s
Fig. 4. Percentages of households present in 1911 which were there in previous years
Source: Censuses of Belfast 1901, 1911, BelFam samples. Belfast and Province of Ulster Street directo-ries for 1901, 1903, 1905, 1907, 1908, 1910.
moved only a very short distance, perhaps only a few doors down the street, never-theless they were not at the same street address: residential mobility did indeed
stand at a very high level in Edwardian Belfast32. Such a high level of mobility
con-firms our suspicions that using house or neighbourhood characteristics as influ-ences on early age mortality or fertility needs to be carefully evaluated.
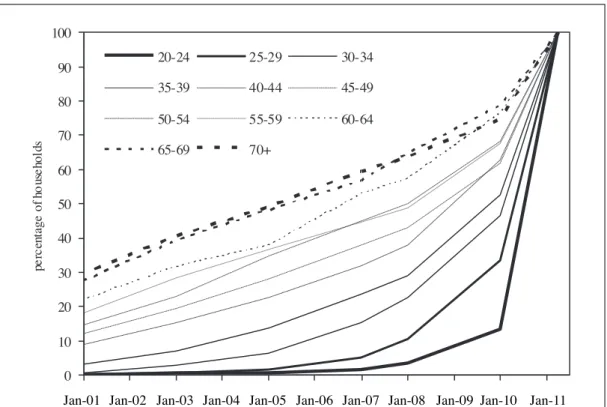
It is unsurprising to find that much of this mobility was linked to life-cycle fac-tors. Figure 5 shows the retrospective persistence rates by age group, demonstrat-ing a very clear age effect, with households headed by the youngest adults bedemonstrat-ing the least likely to have been at the same address ten years previously, while increasing age is accompanied by increasing stability. Similarly, married people are more like-ly to have recentlike-ly moved than single or widowed people, largelike-ly due to the contri-bution of the recently married to this group. The transition from leaving home to household headship, often accompanied by marriage, is part of this phenomenon, but cannot explain all of it.
A logistic regression on the probability of having been at the same address approximately one year previous to the 1911 census is reported in Table 1. The comparator groups are, for the upper panel, single male heads of household who do not describe themselves as a labourer, and for the lower panel, male heads mar-ried for five years or more who do not describe themselves as a labourer. The age
0 10 20 30 40 50 60 70 80 90 100 pe rc en tag e o f h ou se ho ld s 20-24 25-29 30-34 35-39 40-44 45-49 50-54 55-59 60-64 65-69 70+
Fig. 5. Percentages of households present in 1911 which were there in previous years, married household heads by age in 1911
Source: Censuses of Belfast 1901, 1911, BelFam samples. Belfast and Province of Ulster Street directo-ries for 1901, 1903, 1905, 1907, 1908, 1910.
of household head, the number of rooms in the household, the number of people in the household, and the number of children ever born are included as continuous variables, which means that a unit increase in the variable is associated with the value of Exp(B). The upper panel shows the regression for all household heads and confirms that younger, recently married people were much more likely to have moved in the months prior to the 1911 census, older ages being associated with a high (greater than 1) probability of having been at the same address, and marriage being associated with a lower (less than one) probability of having been living in the same house. Entry into a marriage is, of course, strongly linked to the setting up of a new household and thus residential relocation, but this does not fully explain the higher mobility of younger people: even when marriage is controlled, each addi-Tab. 1. Binomial logit regression of the likelihood of a household in 1911 having been resident at the same address in 1910, according to the characteristics of the household head in 1911
All household heads Exp(B) significance
gender (comparator = male)
female 2.169 0.0011
age 1.044 0.0000
marital status (comparator = single)
married 0.740 0.0027
widowed 0.754 0.0040
age by female 0.982 0.0000
female by married 0.562 0.0003
number of rooms in house 1.200 0.0000
number of people in house 1.157 0.0000
people by rooms 0.983 0.0000
occupation (comparator = not labourer)
labourer 0.657 0.0000
Married heads only
gender (comparator = male)
female 0.510 0.0000
age 1.041 0.0000
number of rooms in house 1.371 0.0000
number of people in house 1.255 0.0000
people by rooms 0.965 0.0000
occupation (comparator = not labourer)
labourer 0.660 0.0000
Marital duration (comparator = married 5+ years)
married < 1 year 0.079 0.0000
married 1-4 years 0.393 0.0000
children born 0.964 0.0102
children born by married 1-4 years 1.283 0.0042
Note: for discussion of the comparator groups, and the nature of the variables, see accompanying text. Interaction terms are shown in italics.
tional year of age is associated with an additional 4 per cent higher likelihood of sta-bility. This is elucidated in the lower panel, which reports a regression for married heads to enable length of marriage and the birth of children to be taken into account. This shows that while those married for less than one year in 1911 were extremely unlikely to have been in the same house a year previously, those married between one and four years were also much (60%) less likely to have been living in the same place compared to those married for longer than five years. Thus, those in the early stages of the family-building process might move repeatedly as they jug-gled the pressures of an increasing family in a small space on a tight budget. After some years of marriage, with the bulk of their family building behind them, and older children at least as likely to move away as new ones to be born, and with per-haps greater occupational stability associated with middle age, there would have been less pressure on available space and possibly more predictable incomings and outgoings decreasing the pressure to move.
The regressions reveal other influences on the propensity to have recently moved, however, including socio-economic factors. People living in larger houses were less likely to have recently moved in than those living in small houses in 1911, having already achieved a house large enough for their needs or as big as they were likely ever to be able to afford. It is also possible that more prosperous individuals were able to buy larger houses earlier, obviating the need for frequent moves. Each additional room is associated with a 20% higher chance of having lived in the house a year previously, and this rises to 40% among married people. People reporting themselves as labourers of any description, who would generally have enjoyed less secure employment and lower wages than the bulk of the population, were much more likely to have moved shortly before the census. The diagrams in Figures 4 and 5 further reveal that people can be divided into two groups: those who moved fre-quently and those who were in general more settled (although they may have moved occasionally). The frequent movers influenced the steep curve immediately before the census, but the curves then flatten off, indicating that those who were already resident a year or so previously were much less likely to have moved a year or two before that, and it is possible that this phenomenon is linked to financial security or regularity of work.
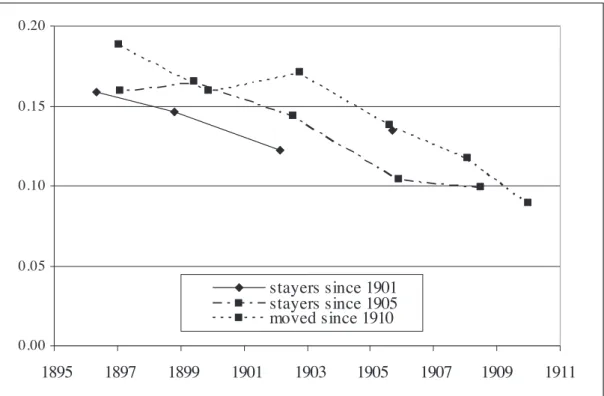
When mobility is particularly high at the family building stage of the life-cycle, it is especially pertinent to question the validity of assuming that housing and neigh-bourhood characteristics measured in 1911 also applied some years previously, when children were born and at risk of death. With mobility so high in the early years of marriage this holds true for all marital duration groups. If mortality risks were similar amongst those who moved and those who were residentially stable, this might not be a problem, but Figure 6 shows infant mortality rates calculated using techniques of indirect estimation for three groups of people in the 1911 census: those who had been at the same address since 1901 (stayers since 1901), those who had been at the same address since 1905 (stayers since 1905), and those who had moved since 1910 (movers since 1910). Clearly stayers since 1901 cannot include those married for less than ten years, nor very many of those married between ten
and fifteen years, and stayers since 1905 cannot include those married for less than five years, so these series do not provide data points carrying right up to 1911. Nevertheless the data series are long enough and distinct enough to conclude that children in more stable families were less likely to have died than children in high-ly mobile families. Mobility seems to have been associated with a higher risk of mor-tality in early childhood. What these figure do not show, is whether this correlation includes elements of causality in either direction: the act of moving may have con-tributed to high mortality, or the death of a child may have prompted a move away, perhaps to escape the scene of this distressing event or because fewer rooms were now needed; but it is perhaps more plausible that both mobility and mortality are driven by a third factor, such as social class or job security.
What is abundantly clear, however, is that trying to tie the housing and neigh-bourhood characteristics of an address, as depicted by the returns of the 1911 cen-sus, to the mortality of the children resident there on census night may not be a legitimate course of action to take. If people move around between housing of very similar characteristics and remain within the same neighbourhoods, then it may be admissible to take 1911 housing characteristics as an indicator of previous ones, but the fact that movement is strongly linked to life-cycle stages suggests that move-ment, in the early years of marriage, at least may be between different types of hous-ing with facilities which, for many people, improve with each subsequent move. People’s housing trajectories will be explored in the next part of the project and it is anticipated that it will be possible to clarify these issues in future work.
0.00 0.05 0.10 0.15 0.20 1895 1897 1899 1901 1903 1905 1907 1909 1911 stayers since 1901 stayers since 1905 moved since 1910
Fig. 6. Infant mortality estimations from Belfast 1911 census, according to mobility status
7. Conclusion. This paper has explored ways of looking at fertility and infant
mor-tality using the censuses of the British Isles. It has drawn attention to the enormous potential of the retrospective information on ‘children ever born’ and ‘children dead’ in the 1911 census, which will soon be available for wider public and acade-mic use. The paper has emphasised the greater potential of individual, as opposed to aggregate, level data for discriminating analysis and uncovering the relationships between the various influences on fertility and infant mortality. In particular, it has shown that social class differentials in infant mortality are largely created by the clustering of different social classes within neighbourhoods, enjoying or enduring the local micro-environment, which would, in turn, have a close influence on the health of the inhabitants. It is important to remember that cross-sectional, retro-spective and longitudinal sources each give a different perretro-spective on the same events. In combination they can give a very full picture of the operation of a demo-graphic regime, but they seldom occur together. When examining sources such as the 1911 census, which contain both a cross-sectional survey, and valuable retro-spective information embedded within it, the unwary must be careful to keep the two aspects separate, and not leap to unwarranted conclusions. As our data from the various nations comprising the British Isles have shown, those analysing the 1911 census must take particular care when using cross-sectional information recorded in the census schedules to inform the construction of variables treated as influences on, or correlates of, fertility and child mortality experiences which were reported retrospectively. In many cases census indicators, such as female occupa-tion or housing characteristics, are unlikely to have applied throughout the time the couples were at risk of the fertility or mortality events captured by the 1911 census schedules and this must be borne in mind when interpreting the relationships and casual mechanisms suggested by this very rich data source.
Acknowledgement. We are very grateful to the ESRC, the Wellcome Trust and the Leverhulme
Trust for their support of our research. We must thank the General Register Office Scotland for access to the civil registers of Skye and Kilmarnock, and Mary Lennon for her permission to use data from the Belfast Street Directories website. We also wish to thank Prof. Lucia Pozzi, Prof. Liam Kennedy, Ros Davies and other members of the Cambridge Group for the History of Population and Social Structure for their advice and encouragement, and two anonymous refer-ees for their pertinent and helpful comments.
1The statistics on births, marriages and deaths can be found in the Quarterly, Annual and Decennial Reports of the Registrars General of each country. The Annual Reports and Decennial Supplements for England and Wales, 1837-1920, and the Annual Reports and Detailed Annual Reports for Scotland, 1855-1919 may be consulted at www.histpop.org, The Annual Reports for Ireland from 1887-1921 may be found at www.nisra.gov.uk/demography. Origi-nal versions of all three series may be found in
British Parliamentary Papers.
2The values for the index of marital fertility, I g, used here were reported by Coale and Treadway (1986, 164, 166 and 169). See also Teitelbaum (1984).
3These studies utilized the concept of ‘natural fertility’, now discredited in some circles. 4 An outline of civil registration in Ireland is given at www.groireland.ie/history.htm, see also Linehan 1997/8.
conducted in 1937 while that of the Irish Free State was taken in 1936, although Coale and Treadway’s 1986 Igfigures for all Irish counties are dated 1936. Teitelbaum 1984, also makes no reference to the different dates of the cen-suses, but reports figures for all counties as being from 1936. Census reports for England and Wales, Scotland and Ireland 1871-1911 and for Northern Ireland 1926 and 1937 may be found at www.histpop.org. The 1926 and 1936 census reports for the Irish Free State, ‘Saorstat Eireann’, may be consulted at the website of the Central Statistics Office Ireland, www.cso.ie/cen-sus/Census_1926_Results.htm and www.cso.ie/ census/Census_1936_Results.htm.
6For further discussion see M. Anderson 1998 and Ó. Gráda 1991.
7For example Anderson 1997 considers fertil-ity decline at the national level, Teitelbaum 1984 and Coale and Treadway 1986 consider it at the county level, Woods 1982 at registration district level, Szreter 1996, considers the fertil-ity behaviour of occupational and social groups and Garrett et al. 2001, study family building using individual level data. Woods et al. 1988; Woods, Shelton 1997; Watterson 1988; Woods, Williams 1995; Woods, Smith 1983; Lee 1991; Williams 1992; Williams, Galley 1995; Williams, Mooney 1994; Reid 1999; Sneddon 2006; James 2006; Garrett 2006; Hall, Drake 2006; Mooney, Tanner 2006 are examples of studies considering infant mortality at different scales and for different groups.
8H. Rhodri Davies was able to undertake work on civil registers for one Welsh community, see Davies 1994a and 1994b.
9 For the Kingston project see: http:// fass.kingston.ac.uk/research/local-history/pro-jects/klhp. Details of the study of Ipswich may be found as Study SN5413 at the UK Data
Archive: http://www.esds.ac.uk. See also James 2006 and Hall and Drake 2006.
10 For studies utilizing Scottish civil register materials see, ESRCfunded project R000223696
by J.J. Smyth ‘Life and Death in the Coffin Close: Anatomy of a Slum Circa 1855-1914’ (the research report may be consulted at www.esrc.ac.uk/my-esrc/grants/ R000223696/ read/reports), Kemmer 1997, the North Orkney Population History Project based at Pennsylvania State University and alluded to in Sparks 2009; Blaikie et al. 2005; 2006; Garrett 2006; Reid et al. 2002; Davies, Garrett 2005. 11 For more information on the censuses see Higgs 1996; National Archives for Scotland
2003; Sinclair 2000; Linehan 1997/8 and www.census.nationalarchives.ie/help/history.h tml (accessed 11.07.2010).
12Slightly different rules concerning access to the census material have operated in the each of the countries. Scotland for some years had a ’90 year rule’ and the authorities in Dublin granted public access to original census returns ahead of their counterparts in Northern Ireland. The 1911 census schedules for England and Wales and Scotland have been made available to the public slightly ahead of the usual ‘full century’ limit.
13 See, for example, www.ancestry.co.uk and www.findmypast.co.uk.
14The Economic and Social Data Service can be accessed at www.esds.ac.uk.
15The Integrated Census Microdata (I-CeM) «will make the British census enumerators» books from the decennial censuses of 1851-1911 available to the research community in a standardised comparable form’, see www.essex.ac.uk/history/research/icem/About_ Project.aspx for further details. The 1901 and 1911 censuses of Ireland are available at www.census.nationalarchives.ie and the Belfast Family History project has made selected Belfast census records available at www. belfastfamilyhistory.com.
16 The National Archives of Ireland website: http://www.census.nationalarchives.ie/help/hi story.html states that: «The original census returns for 1861 and 1871 were destroyed shortly after the censuses were taken. Those for 1881 and 1891 were pulped during the First World War, probably because of the paper shortage. The returns for 1821, 1831, 1841 and 1851 were, apart from a few sur-vivals, notably for a few counties for 1821 and 1831, destroyed in 1922 in the fire at the Public Record Office at the beginning of the Civil War». Further discussion of the records’ destruction may be found in Murphy 2001. 17See Grabill, Cho 1965. This method is diffi-cult to apply to the 1841 census as relation-ship to head was not reported, and therefore co-resident spouses cannot be identified with certainty – although see Hacker 2003.
18 Even in 1911 census tables were not pro-duced showing infant mortality by social class or occupation for different geographic units. 19 Such age specific curves of marital fertility will only apply to surviving women. Later developments of Grabill and Cho’s 1965 method incorporated the reverse survival of mothers as well as those of children – see for
example Hacker 2003. However such addi-tional sophistications require heroic assump-tions concerning differential survival of mar-ried women, or even fertile marmar-ried women, vs. all women for whom survival rates are most often available. In addition, given the interests of this paper, allowances would have to be made for changes in various social, economic and demographic indicators which cannot be assessed from the census returns. It was there-fore decided not to take up the more recent adaptions of Grabill and Cho’s method. 20 The original techniques of indirect estima-tion were developed by William Brass 1975, but his original multipliers have since been more thoroughly tested and refined, see Trussel 1975. See also Sullivan 1972. The mul-tipliers used here are the Coale-Demeny West variant multipliers provided in United Nations 1983, 82.
21The Brass relational logit life table system is used here together with the England and Wales life table for 1910-12 to transform estimates into infant mortality. See Newell 1988, chapter 13 on relational model life tables. See Feeney 1980 for the derivation of time-trending multi-pliers, although those used here are given in United Nations 1983, 83.
22See Garrett et al. 2001, Appendix A, for a thorough description of the application of indirect techniques to the 1911 census of England and Wales, a procedure which is very closely followed here.
23 In general the techniques are considered robust against differences in the age structure of mortality, but they have not been extensive-ly tested against subgroups within populations. 24Very few married women in this community returned non-textile occupations. Although a sizeable proportion took in boarders to aug-ment the family income, these were not con-sidered to be in paid employment (Garrett et al. 2001, 305).
25The important issue of the incidence of cou-ples having very small families is explored in Anderson 1999.
26See www.belfastfamilyhistory.com.
27 See Corfield 1984; Lewis 1975; Mills 2001; Shaw, Tipper 1996 and Shaw 1979, 1982 for the background and development of trade directories, and their usage in urban and rural analysis.
28 Armstrong 2008 provides a comprehensive history of street directories in Northern Ireland.
29We are very grateful to Mary Lennon for per-mission to extract data for the streets in our study areas.
30This procedure may result in the erroneous matching of some families who were succeed-ed or precsucceed-edsucceed-ed by a different family of the same name, but this is not very likely, and probably balanced by missed matches due to the mis-recording of names.
31 Belfast had become a city in 1888 and in 1896 its boundaries were extended, virtually doubling its area. In the 1891 census it still comprised just 5 wards but in 1896 these were subdivided and, with the addition of new wards, by 1901 Belfast was made up of 15 wards. It is therefore very difficult to compare and contrast census figures from before and after 1896.
32It is unusual to measure mobility backwards in time, and the level of new house building in Belfast means that there will have been some houses not available to be inhabited in previ-ous years, but these percentages are not too different from those found in other studies of residential persistence. For example, Colin Pooley in his study of Victorian Liverpool found that only 17% of households were resi-dent at the same addresses ten years later (Pooley 1979).
Bibliography
M. Anderson 1998, Fertility decline in Scotland, England and Wales, and Ireland: comparisons from the 1911 Census of Fertility, «Population Studies», 52, 1-20. M. Anderson 1999, Highly restricted fertility:
very small families in the British fertility decline, «Population Studies», 52, 177-199. D. Armstrong (ed.) 2008, Belfast and Ulster
Street Directories 1805-1914: Guide and Directory, Library and Information Services Council (NI), Local History Panel. http://
www.liscni.co.uk/docs/Belfast_and_Ulster_ Street_Directories.pdf
A. Blaikie, E. Garrett, R. Davies 2005, Migration, living strategies and illegitimate childbearing: a comparison of two Scottish settings, 1871-1881, in A. Levene, T. Nutt, S. Williams (eds.), Illegitimacy in Britain, 1700-1920, Palgrave Macmillan, Basingstoke, 141-167.
A. Blaikie, A. Reid, R. Davies, E. Garrett 2006, Vulnerability among Illegitimate Children in Nineteenth Century Scotland, «Annales de Démographie Historique», 111, 1, 89-113. W. Brass 1975, Methods for estimating fertility
and mortality from limited and defective data, Chapel Hill, North Carolina.
British Parliamentary Papers 1912-13, Census of Ireland, 1911. Area, houses, and popula-tion… Province of Ulster, City or County Borough of Belfast, BPP1912-13 CXVI [Cd.
6051].
British Parliamentary Papers 1917, 1911 Census of England and Wales, Vol XIII ‘Fertility of Marriage’ Part I, BPP 1917-18
XXXI.1 [Cd. 8678].
British Parliamentary Papers 1923, 1911 Census of England and Wales, Vol. XII ‘Fertility of marriage’ Part II, BPP1923.
A.J. Coale, R. Treadway 1986, A summary of the changing distribution of overall fertility, marital fertility and the proportion married in the provinces of Europe, in A.J. Coale, S. Cotts Watkins, The decline of fertility in Europe, Princeton University Press, Prin-ceton, NJ., 31-178.
B. Collins 1983, The Edwardian City in J.C. Beckett et al. Belfast the making of the city, 1800-1914, Appletree Press, Belfast, chap-ter 11.
P.J. Corfield, S. Kelly 1984, “Giving directions to the town”: the early town directories, «Urban History Yearbook», 11, 22-35. H.R. Davies 1994a, Automated record linkage
of census enumerator’s books and registration
data: obstacles, challenges and solutions, «History and Computing», 4, 1, 16-26. H.R. Davies 1994b, Nominal record linkage of
historical data: procedures and applications in a North Wales parish, unpublished Ph.D. thesis, University of Southampton.
R. Davies, E. Garrett 2005, ‘More Irish than the Irish’? Nuptiality and fertility patters on the Isle of Skye, 1881-1891, in R.J. Morris, L. Kennedy (eds.), Ireland and Scotland: order and disorder, 1600-2000, John Donald, Edinburgh, 85-98.
Demographic and Health Survey 2011, Interviewers Manual http://www.mea-suredhs.com/pubs/pdf/DHSM1/DHS6_Int erviewer_Manual_22July2011.pdf, accessed 13thAugust 2011.
G. Feeney 1980, Estimating infant mortality trends from child survivorship data, «Popu-lation Studies», 34, 109-128.
E. Garrett 2006, Urban-rural differences in infant mortality: a view from the death regis-ters of Skye and Kilmarnock, in Garrett et al., Infant mortality: a continuing social problem, Ashgate, London, 119-148.
E. Garrett, C. Galley, N. Shelton, R. Woods 2006, Infant Mortality: a continuing social problem, Ashgate, London.
E. Garrett, A. Reid, K. Schürer, S. Szreter 2001, Changing family size in England and Wales; place, class and demography, 1891-1911, Cambridge University Press, Cambridge. W.H. Grabill, L.J. Cho 1965, Methodology for
the measurement of current fertility from pop-ulation data in young children, «Demo-graphy», 2, 50-73.
D. Hacker 2003, Rethinking the “early” decline of marital fertility in the United States, «Demography», 40, 605-620.
E. Hall, M. Drake 2006, Diarrhoea, the central issue?, in Garrett et al., Infant mortality a continuing social problem, Ashgate, London, 149-168.
E. Higgs 1996, A clearer sense of the Census, HMSO, London.
C.H. Lee 1991, Regional inequalities in infant mortality in Britain, 1861-1971, patterns and hypotheses, «Population Studies», 45, 55-65. T. James 2006, Infant mortality in Nor-thamptonshire; a vaccination register study, in Garrett et al., Infant mortality: a continuing social problem, Ashgate, London, 99-118. D. Kemmer 1997, Infant Mortality in Aberdeen
and Dundee in the Early Twentieth Century, «Scottish Economic and Social History», 17, 1, 1-19.
C.R. Lewis, 1975, Trade directories – a data source in urban analysis, «National Library of Wales Journal», 19, 181-193.
T.P. Linehan 1997/8, The development of offi-cial Irish statistics, «Journal of the Statistical and Social Inquiry Society of Ireland», 27, 5, 47-98.
D. Mills 2001, Rural Community History from Trade Directories, A Local Population Studies supplement, Hertfordshire Publications, Hatfield.
G. Mooney, A. Tanner 2006, Infant mortality, a spatial problem: Notting Dale special area in George Newman’s London, in Garrett et al., Infant mortality: a continuing social problem, Ashgate, London, 169-190.
S. Murphy 2001, Memorandum on the fate of the destroyed returns of the census of Ireland 1861-91, in Centre for Irish Genealogical and Historical Studies A Guide to the National Archives of Ireland: Internet Edition http://.eir-com.net/~seanmurphy/nai/censusmemo.htm (accessed 12 August 2011).
National Archives of Scotland 2003, Tracing your Scottish ancestors, Mercat Press, Edinburgh.
M. Nissel 1987, People count: a history of the General Register Office, HMSO, London.
C. Newell 1988, Methods and models in demog-raphy, Bellhaven Press, London.
C. Ó Gráda 1991, New evidence on the fertility transition in Ireland, 1880-1911, «Demo-graphy», 28, 535-548.
C. Pooley 1979, Residential Mobility in the Victorian City, «Transactions of the Institute of British Geographers», New Series 4, 258-277.
S. Preston, M. Haines 1991, Fatal years: child mortality in late nineteenth century America, Princeton University Press, Princeton. A.M. Reid 1997, Locality or Class? Spatial and
Social Differentials in Infant and Child Mortality in England and Wales, 1895-1911, in C.A. Corsini, P.P. Viazzo (eds.), The Decline of Infant and Child Mortality: The European Experience: 1750-1990, Martinus Nijhoff , Leiden, 129-154.
A.M. Reid 1999, Infant and child health and mortality in Derbyshire: the Great War to the mid-1920s, unpublished Ph.D. thesis, Uni-versity of Cambridge.
A.M. Reid 2006, Health visitors and “enlight-ened motherhood”, in Garrett et al., Infant mortality: a continuing social problem, Ashgate, London, 191-214.
A. Reid, R. Davies, E. Garrett 2002 (published
2006), Nineteenth-century Scottish demogra-phy from linked censuses and civil registers: a ‘sets of related individuals approach’, «Hi-story and Computing», 14, 61-86.
G. Shaw, A. Tipper 1996, British directories: a bibliography and guide to directories pub-lished in England and Wales (1850-1950) and Scotland (1773-1950), 2ndedition, Leicester University Press, Leicester.
G. Shaw 1982, British Directories as sources in historical geography, Historical Geography Research Series, 8.
G. Shaw 1979, The content and reliability of nineteenth century trade directories, «Local Historian», 13, 205-209.
C. Sinclair 2000, Jock Tamsin’s Bairns: a history of the records of the General Register Office for Scotland, GROS, Edinburgh.
S. Sneddon 2006, A double penalty, Infant mor-tality in the Lincolnshire Fens, 1870-1900, in Garrett et al, Infant mortality a continuing social problem, Ashgate, London, 79-98. C. Sparks 2009, An application of the
variable-r method to subpopulation gvariable-rowth variable-rates in a 19th century agricultural population, «Demo-graphic Research», 21, 2, 23-64.
J.M. Sullivan 1972, Models for the estimation of the probability of dying between birth and exact ages in early childhood, «Population Studies», 26, 79-97.
S.R.S. Szreter 1996, Fertility, class and gender in Britain, 1860-1940, Cambridge University Press, Cambridge.
S.R.S. Szreter 2011, Theories and heuristics: how best to approach the study of historic fer-tility declines?, «Historical Social Re-seach/Historische Sozialforschung», 36, 2, 65-100.
M.S. Teitelbaum 1984, The British fertility decline: demographic transition in the cru-cible of the industrial revolution, Princeton University Press, Princeton.
T.J. Trussell 1975, A re-estimation of the multi-plying factors for the Brass technique for determining childhood survivorship rates, «Population Studies», 29, 97-107.
United Nations 1983, Manual X: indirect tech-niques of demographic estimation, United Nations, New York.
P.I. Watterson 1988, Infant mortality by father’s occupation from the 1911 census of England and Wales, «Demography», 25, 289-306. N. Williams 1992, Death in its season: class,
environment and the mortality of infants in nineteenth century Sheffield, «Social History of Medicine», 5, 71-94.