Atmospheric Propagation Conditions of Weather
Radar Echoes – Extended English Summary
11. AIM AND OVERVIEW
1.1. Introduction
This PhD Thesis is mainly related with one of the factors that affect the quality of weather radar observations: the degree of refraction of the radar beam. As in any other microwave-based communication system, atmospheric conditions control the way electromagnetic energy transmitted and received by a weather radar propagates through the atmosphere. The variability of the propagation conditions, their effects in radar quantitative precipitation estimates and the feasibility of forecasting operationally propagation conditions are some of the aspects examined.
1.2. Objectives
The objectives of this work may be summarized in five different aspects:
1). Acquisition of the theoretical background, concepts and methodology related to the study of weather radar propagation conditions. A bibliographic search on this issue was proposed, covering microwave propagation fundamentals, radio meteorology and weather radar observations in the atmosphere.
2). Development and implementation of analysis tools to study weather radar propagation conditions. Programming and adapting software and visualization and statistical tools were the main targets of this point.
3). Characterization of propagation conditions affecting an operational weather radar. The Vallirana radar, located near Barcelona, installed by the University of Barcelona and operated by the Catalan Meteorological Service as the first unit of the Catalan radar network, was chosen for this purpose. The Mediterranean sea has been traditionally considered as a
region prone to superrefraction (Bean and Dutton, 1968; Battan, 1973; Pittman, 1999). The development of this topic consists of using Barcelona radiosonde observations to obtain mean and extreme propagation conditions, degree of departure of standard conditions (anomalous propagation), etc.. and compare them with nearby locations. This analysis allowed the derivation of practical results such as, among others, the local value of the equivalent Earth radius, as suggested in the EU COST-73 Final Report (Newsome, 1992), devoted to weather radar networking.
4). Analysis of the propagation effects upon radar quantitative precipitation estimates. Among the effects of anomalous propagation studied in EU funded projects where we have participated, such as DARTH (ENV4-CT96-0261) or CARPE DIEM (EVG1-2001-00031), topographic beam blockage was one of the selected topics. The complex orography of Catalonia requires this kind of correction to obtain reliable radar precipitation estimates. The US NEXRAD beam blockage correction, applied to a number of targets observed from the Vallirana radar, was chosen to study the sensitivity of this type of procedure to microwave propagation variability.
5). Assessment of the feasability of radar propagation conditions operational forecasts. In the framework of the EU COST-717 action (Rossa, 2000), devoted to the use of weather radar observations in NWP and hydrological models, there is great interest in developing quality control techniques for radar data. In particular, this topic is included in the activity related to radar data characterization of COST 717 (Früwhald, 2000) where we participate. In this case, real time operational available tools, such as radiosonde observations and mesoscale NWP model data, are considered to evaluate a possible quality control for weather radar observations.
2. WEATHER RADAR BEAM PROPAGATION CONDITIONS
2.1. Air refractivity
The variation of the air refractive index plays a key role when characterizing the propagation conditions of a radar beam. In particular, the vertical profiles of the air temperature, moisture and pressure are mostly responsible for the way the radar energy will propagate in a given atmosphere. A number of assumptions on these vertical profiles are usually taken, assuming the so-called "standard propagation conditions" which are associated to the average state of the atmosphere accepted as the most representative. However, due to
the inherent variability of the atmosphere, it is a well-known fact that propagation conditions may differ, sometimes significantly, from those considered standard resulting in anomalous propagation (AP). Super refraction of a weather radar beam produces more bending towards the ground surface than expected for standard conditions and therefore increases and intensifies ground clutter echoes (AP or anaprop echoes). This situation is particularly negative for automated quantitative precipitation estimates (QPE) such as those required for operational weather surveillance and hydrological flood warning. Quality control procedures for QPE have traditionally dealt with anaprop and, in general, clutter echoes (see, for example, Kitchen et al., 1994; Joss and Lee, 1995; Anderson et al., 1997; da Silveira and Holt, 1997; Fulton et al., 1998; Archibald, 2000; Sánchez-Diezma et al., 2001, or Steiner and Smith, 2002, among others)
However, the fact that AP echoes may be detected and cleaned with techniques such as those above mentioned, does not prevent that radar observations may be affected because of the difference in their expected height. If this difference is important enough, any procedure which requires a precise knowledge of the echo altitude may be potentially affected by AP. For example, if radar data (either echo intensity or Doppler winds) are to be assimilated in a NWP model or if the radar echo intensity is corrected for beam blockage due to mountain sheltering (Bech et al., 2003), the effect may be relevant.
As anomalous propagation is due to relatively small variations of the air refractive index
n, the magnitude known as refractivity N, defined as one millionth of n-1, is commonly used
in anaprop studies. Bean and Dutton (1968) showed that N can be written as:
where T is the air temperature (K), p atmospheric pressure (hPa) and e is the water vapour pressure (hPa). N is sometimes considered as the sum of two terms of (1): the dry term, Nd, which depends only on p and T and the wet term, Nw, which is also function of e. A related magnitude is the modified refractivity M, which is defined as:
where z is altitude and r is the radius of the Earth in m. Modified refractivity is very useful to characterize propagation conditions as for constant M the curvature of the ray path is that of
) 1 ( , 4810 6 . 77 10 ) 1 ( 6 + ⋅ = − = T e p T n N ) 2 ( , 10 6r z N M = + −
may be bent towards the surface and then radio waves get trapped like in a wave guide (ducting). Propagation characteristics may vary largely, depending on the type of air mass (Gossard, 1977). When characterizing the radio propagation environment it is usual to consider the vertical refractivity gradient of the air of the first kilometre above ground level to estimate propagation effects such as ducting, surface reflection and multipath on terrestrial line-of-sight links. However, the effect on weather radar beam refraction not only depends on the refractivity gradient of a layer but also on the angle of incidence between the beam and the trapping layer considered or the frequency of the electromagnetic wave.
For weather radar applications, if the vertical refractivity gradient of the first kilometre (VRG) of the atmosphere is around –1/4a (i.e. –39 N units km-1 or 118 M units km-1, where a is the Earth’s radius) then standard propagation will occur for any angle of incidence (Doviak and Zrnic, 1992). An increase in VRG bends the radar beam more slowly than normal (subrefraction) and reduces the microwave radar horizon. With regard to ground clutter echoes, subrefraction implies a decrease in their frequency and intensity. On the other hand, a decrease in VRG generates the opposite effect, bending the beam faster than normal (super refraction) for the interval between –78.7 km-1 and –157 km-1. Trapping, or ducting, the most extreme case of anomalous propagation, occurs for values lower than –157 km-1, and in this case the microwave energy may travel for long distances before intercepting ground targets producing anomalous propagation (i.e., anaprop or AP) echoes. In fact, a careful analysis of the fluctuation of target reflectivity may be a way to monitor variations in atmospheric conditions as shown by Fabry et al. (1997).
Super refraction, and ducting in particular, is usually associated with temperature inversions or sharp water vapour gradients. During cloudless nights, radiation cooling over land favours the formation of ducts which disappear as soon as the sun heats the soil surface destroying the temperature inversion. This process may be sometimes clearly observed in the daily evolution of clutter echoes, as reported by Moszkowicz et al. (1994) and others.
2.2. Radiosonde data
As radiosoundings have been traditionally the only source of upper air information available on a routine basis, they have been used for years to calculate long term averages of propagation conditions –see, for example, Gossard (1977) or Low and Huddak (1997)–. Since 1997, radiosonde observations have been made in Barcelona to support the operations of the regional government's Subdirectorate of Air Quality and Meteorology. Observations were
collected launching Vaisala RS-80 sondes (from 41.38ºN, 2.12ºE and 98 m asl) which sampled every 10 s providing much higher vertical resolution than the usual standard operational radiosounding observations. This allowed better characterization of the air refractive index variability and the detection of thinner super refractive layers that may not be detected by standard radiosounding observations but may have significant effects in the propagation of the radar beam. Data used was collected between 1997 and 2002, at 00 and 12 UTC. From the original 2485 radisoundings available, 86% passed the quality control process (based both in data format and content analysis, adapted from Météo-France, 1997).
2.3. Surface refractivity
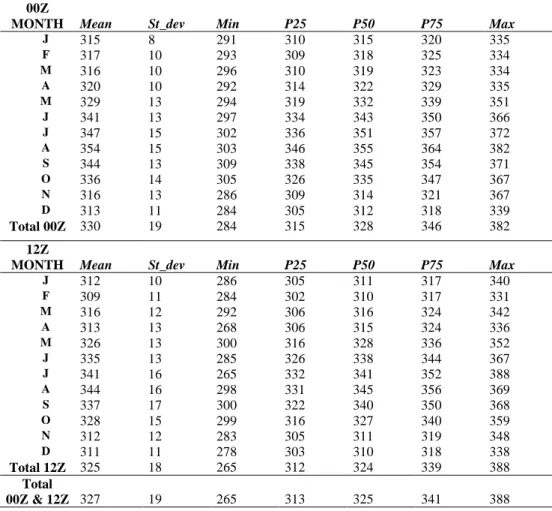
Surface refractivity is an important magnitude in radiometeorology; it appears in the refractivity exponential model and is one of the terms used in the standard computation of the VRG (ITU, 1997). Table 2-1 shows Barcelona Ns statistics.
00Z
MONTH Mean St_dev Min P25 P50 P75 Max
J 315 8 291 310 315 320 335 F 317 10 293 309 318 325 334 M 316 10 296 310 319 323 334 A 320 10 292 314 322 329 335 M 329 13 294 319 332 339 351 J 341 13 297 334 343 350 366 J 347 15 302 336 351 357 372 A 354 15 303 346 355 364 382 S 344 13 309 338 345 354 371 O 336 14 305 326 335 347 367 N 316 13 286 309 314 321 367 D 313 11 284 305 312 318 339 Total 00Z 330 19 284 315 328 346 382 12Z
MONTH Mean St_dev Min P25 P50 P75 Max
J 312 10 286 305 311 317 340 F 309 11 284 302 310 317 331 M 316 12 292 306 316 324 342 A 313 13 268 306 315 324 336 M 326 13 300 316 328 336 352 J 335 13 285 326 338 344 367 J 341 16 265 332 341 352 388 A 344 16 298 331 345 356 369 S 337 17 300 322 340 350 368 O 328 15 299 316 327 340 359 N 312 12 283 305 311 319 348 D 311 11 278 303 310 318 338 Total 12Z 325 18 265 312 324 339 388 Total 00Z & 12Z 327 19 265 313 325 341 388
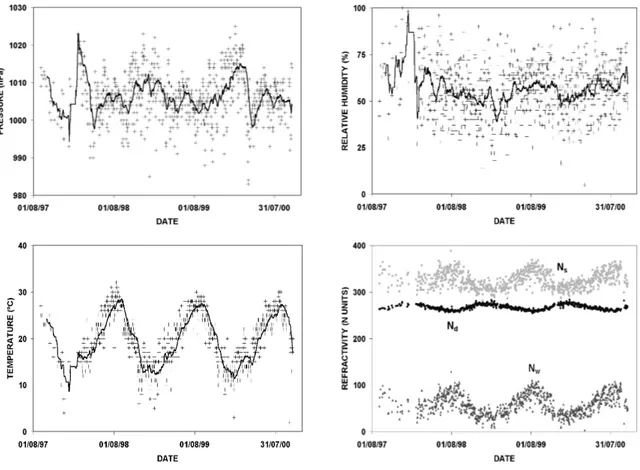
It may be noted that nocturnal Ns values were lower than noon values (about 5 N units in the monthly means) and also the existence of a marked seasonal pattern with a peak in August and a minimum in December. This yearly cycle may be explained by examining the behaviour of the magnitudes considered in the computation of refractivity and also by considering separately the dry and wet terms (Fig. 2-1).
Monthly variations of these magnitudes show different behaviours. While the temperature follows a very clear seasonal pattern (highs in summer and lows in winter, as expected), in the case of the pressure it is much weaker (aproximately winter maxima and summer minima). The humidity, changing constantly throughout the year, exhibits no apparent pattern. These behaviours are reflected in the evolution of Nd and Nw. The first one, proportional to pt-1, is nearly constant with maxima in summer and minima in winter; the second, proportional to et-2, is much more variable (because of e) but maxima and minima are swapped with respect to Nd (because of t-2). Therefore, Nw, which represents about 30% of N,
Fig. 2-1. Time series of 12 Z surface pressure, relative humidity and temperature (with 30-day moving averages) and surface refractivity Ns and its dry (Nd) and wet (Nw) terms.
contributes mostly to its variation: at short scale, adding variability and also, at monthly scale, modulating the summer maximum and winter minimum cycle which is slightly compensated by the opposite cycle shown by Nd.
2.4. Vertical refractivity gradient
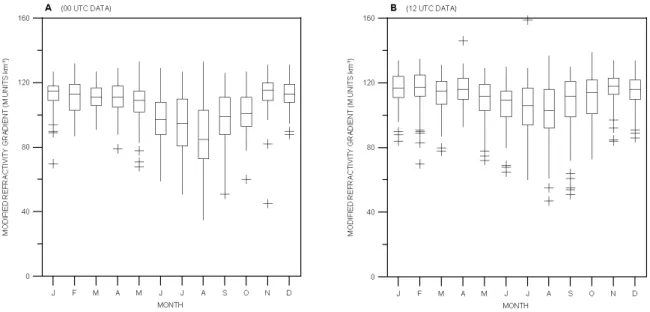
Vertical refractivity gradient in the first 1000 m (VRG) exhibits, like Ns, lower values for night conditions and a similar seasonal pattern both in the 00 Z & 12 Z data (Fig. 2.2).
This box plot shows that in summer not only there is a minimum monthly median (August), but also that the interquartile range (IQR) is increased compared to cold months. Another significant feature is that outliers seldom represent subrefractive events but are quite common for superrefraction; besides, they appear almost any month, in particular for 12Z data. These two features may also be appreciated in the time series plot for 2000 and 2001 (Fig. 2-3).
Fig. 2-2. Box-whisker plots of VRG in Barcelona for 00 Z and 12 Z data.
This seasonal pattern is already indicated in the VRG World Wide maps prepared by the International Telecommunications Union (ITU, 1997). In particular, in August, an area of maximum superrefraction affects the Western Mediterranean region, comparable in intensity to the maximum above the SW Pacific coast of N. America, and somewhat weaker than the Arabian Peninsula –where the world maximum is located for that month–. Using the
Historical Electromagnetic Propagation Condition Data Base from the US Naval Systems
Ocean Center (Patterson, 1987) a comparison with ten radiosonde stations located in the area was performed. Median monthly values allowed to check similar patterns both in Ns and VRG.
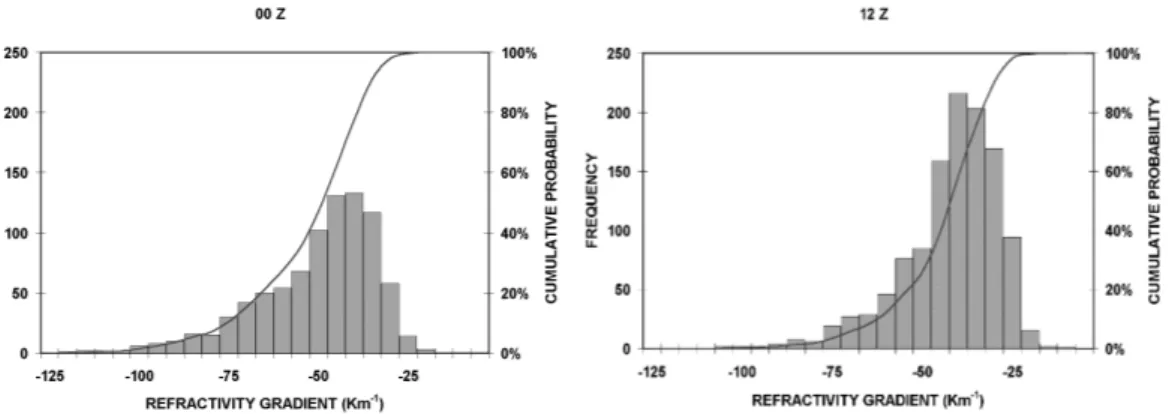
The frequency and cumulative probability distributions for Barcelona VRG are shown in Fig 2-4. A similar unimodal left skewed pattern, with stepper slopes for higher VRG values (tending to super refraction), is shown for both 00 and 12 Z data. However modal values are very near the nominal standard propagation value of -40 N units/km (-49 N units/km at night and -42 N/km units at noon).
The relationship between surface refractivity and the vertical refractivity gradient for the first kilometre was investigated during the sixties for data collected in the UK (Lane, 1961) and the US (Bean and Dutton, 1968). In both cases a high correlation was found for monthly averages of both magnitudes. For the data set collected in Barcelona, a correlation of 0.9745 was found.
2.5. Anaprop events
In order to illustrate the effect of intense VRG super refractive values on weather radar images, seven weeks of radiosonde and radar data collected between June and July 2003 were
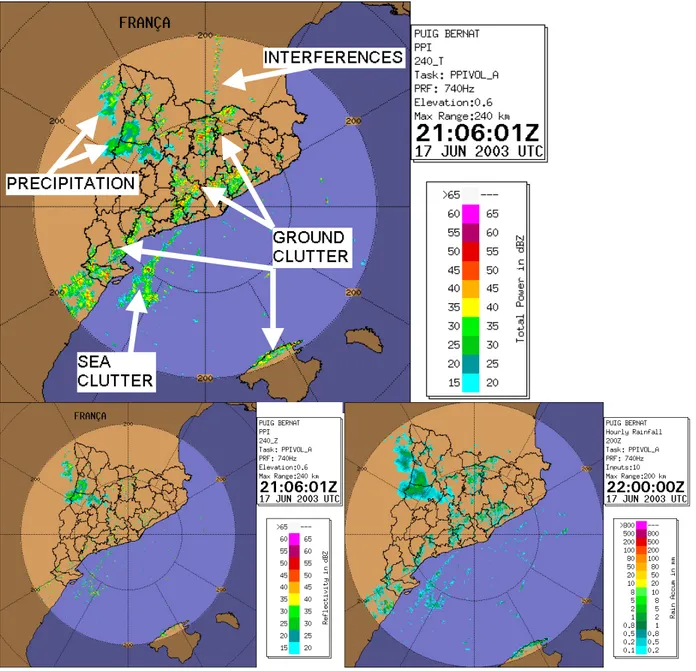
examined. In the beginning of June, SMC radars were updated with new RVP-8 digital signal processors and also with new RCP-8 antenna controllers, both manufactured by Sigmet, Inc.. These were major hardware changes allowing a better antenna pointing accuracy and also better ground clutter cancellation and substitution. In fact, with the new configuration, many of the ground clutter echoes left by the previous analog processor were correctly eliminated. Besides, interference caused by another nearby C-band transmitter, was cancelled thanks to the pulse to pulse phase randomization. This is exemplified in Fig. 2-5, where real precipitation echoes, ground and sea clutter and interferences appear simultaneously.
Fig. 2-5. Radar PPI observed at 21:06Z, 17th June 2003: uncorrected reflectivity, corrected reflectivity (bottom left) and 1 hour accumulation (bottom right).
In the example shown it may be appreciated that many of the clutter echoes of the total reflectivity image effectively dissapear when corrected by the processor, except for sea clutter where the correction is limited by sea movement. However, the clutter effect, though much lower than before correcting, still persists when producing 1 hour rainfall accumulations both at sea and ground. The VRG observed 3 h later in the radiosonde data was –97 N units/km. Other fifteen similar events, with VRG ranging between –80 and –114 N units/km, were examined finding in most cases similar anaprop patterns.
3. SENSITIVITY OF BEAM BLOCKAGE CORRECTIONS TO PROPAGATION CONDITIONS
3.1. Radar beam blockage
Weather radars operating in complex orographic areas usually suffer from partial or total beam blockage caused by surrounding mountains. This shielding effect may restrict seriously the use of the lowest antenna elevation angles which provide the most useful information for rainfall rate estimation at ground level as discussed by Joss and Waldvogel (1990), Sauvageot (1994), Collier (1996), or Smith (1998). Therefore, in mountaineous areas, beam blockage correction schemes may be applied in order to minimize the effect of topography, specially if quantitative precipitation estimations (QPE) are required. Such corrections are usually included in operational QPE procedures as can be seen in, for example, Harrold et al. (1974), Kitchen et al. (1994), Joss and Lee (1995), Fulton et al. (1998), or Seltmann and Reidl (1999) and may be combined with correction techniques based in the analysis of the 3-D echo structure (Krajewski and Vignal 2001, or Steiner and Smith 2002).
The idea that assuming normal propagation conditions for radar observations may not always be a good choice –though it is probably the best option as a first-guess– is by no means new and the use of climatological refractive data for a specific radar site was already proposed, for example, in the COST 73 Project (Newsome, 1992) and, in a different context, evaluated by Pittman (1999) to improve radar height measurements. In this section the effect of changing the radar beam propagation conditions upon an ordinary single polarization reflectivity blockage correction is examined. A simplified interception function between the radar beam and topography is proposed to simulate particular results for the Vallirana weather radar, located at 650 m above sea level near Barcelona (NE Spain) in a complex orography zone, considering real atmospheric propagation conditions.
3.2. Beam blockage simulation
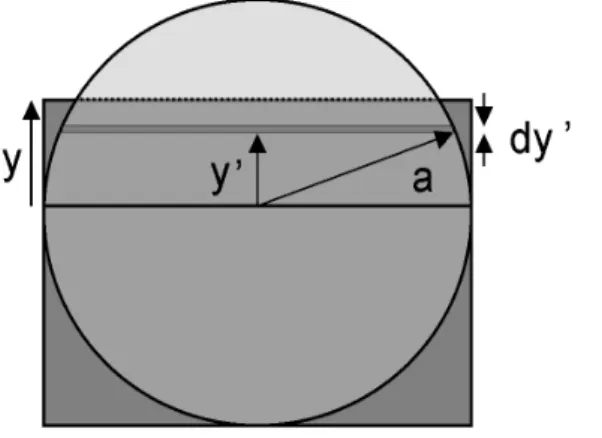
To describe in full detail the interception of the energy transmitted by the radar with the surrounding topography, a precise description of the antenna radiation pattern would be required. As this pattern is rather complex, it is common to assume the usual geometric-optics approach and consider that the radar energy is concetrated in the main lobe of the radar antenna pattern (Skolnik, 1980). Then, when a radar beam intercepts a mountain, two situations are possible: 1) only part of the beam cross section illuminates the intercepted topography (partial blockage) or 2) the radar beam is completely blocked (total blockage). The percentage area of the radar beam cross section blocked by topography may be expressed as a function of the radius of the beam cross section, a, and the difference of the average height of the terrain and the center of the radar beam, y (see Figure 3-1). Depending on the
relative position of the beam height respect to topography, y may be either positive or negative. According to these definitions, partial beam blockage occurs when –a < y < a , total beam blockage means that y ≥ a and, finally, y ≤ –a implies there is no blockage at all. Using
the notation introduced above, it can be seen that partial beam blockage, PBB, may be written as: (3) . a 2 a a y arcsin a y a y BB P 2 2 2 2 2 π π + + − =
Fig. 3-1. Elements considered in the radar beam blockage function: a, radius of the radar beam cross section, y, difference between the center of the radar beam and the topography, dy' differential part of blocked beam section and y' the distance from the center to dy'
On the other hand, the height of the centre of the radar beam, h, is given at a distance r by the expression (see, for example, Doviak and Zrnic, 1993):
where R is the Earth's radius, ke is the ratio between R and the equivalent Earth's radius, θ the
antenna elevation angle and H0 the antenna height. Information about atmospheric
propagation conditions is contained in ke, which may be written in terms of the refractivity
gradient as:
The usual value for ke in the first kilometer of the troposphere, assuming the normal
VRG of -40 km-1, is approximately 4/3. Substituting (5) and (4) in (3), an expression of the beam blockage in terms of the propagation conditions is obtained.
Three clutter targets (MNT, LML and MNY), which presented partial beam blockage under normal propagation conditions, were chosen to examine the effects of changing the VRG. The Vallirana radar (41 22' 28'' N, 1 52' 52'' E) is a C band Doppler system with a 1.3 º beam width antenna at 3 dB. The targets chosen are normally used to check the radar antenna alignment on a routine basis and are located within the region of interest of radar QPE. The targets were located at different ranges, had different heights and showed different degrees of blockage, in order to be representative of the topography surrounding the radar. They are located in the so called Pre-coastal Range sharing a similar propagation environment and comparable to that obtained by the Barcelona radiosonde. For example the area considered is usually influenced by a marked sea-breeze circulation pattern, just like the city of Barcelona (Redaño et al., 1991).
3.3. Beam blocking correction
To evaluate the effects of anomalous propagation, the partial beam blocking correction scheme used in the NEXRAD Precipitation Processing System has been considered. This scheme (Fulton et. al, 1998) is applied to radar beams partially shielded. In particular, this type of beam blockage correction is applied to radar pixels (or radar bins) whose shielding
( )
kR 2r k Rsin kR H , (4) r h = 2 + e 2 + e θ − e + 0 (5) . dh dN R 1 1 ke + =ranges between 10% and 60% and it consists of modifying radar equivalent reflectivity factor measurements by adding 1 to 4 dB depending on the degree of occultation. The correction is also applied to all pixels further out in range of the same blocked radar ray, neglecting diffraction below shadow boundary. The correction depends only on the percentage of beam cross section shielded and, in the description provided by Fulton et al. (1998), no specific mention is made about which part of the beam is shielded. This approach allows consideration of a simple interception function, as the one proposed in the previous section, assuming that the correction additive factors contain considerations about interception details such as the beam power distribution. This beam blockage procedure is used with other corrections such as a test on the vertical echo continuity and a sectorized hybrid scan (Shedd et al., 1991). Other approaches to this question with different degrees of sophistication have been used in the past (see for example Delrieu et al. 1995, Gabella and Perona 1998, Michelson et al. 2000). All of them have in common the assumption of standard propagation conditions of the radar beam.
3.4. Refractivity gradient vs beam blockage
The radar beam blockage under a particular VRG can be simulated considering both the observed propagation conditions and the interception function described in the previous sections. This may be achieved by assuming an homogeneous VRG for the whole radar beam and calculating the associated beam blockage for each selected target for a given initial antenna elevation angle.
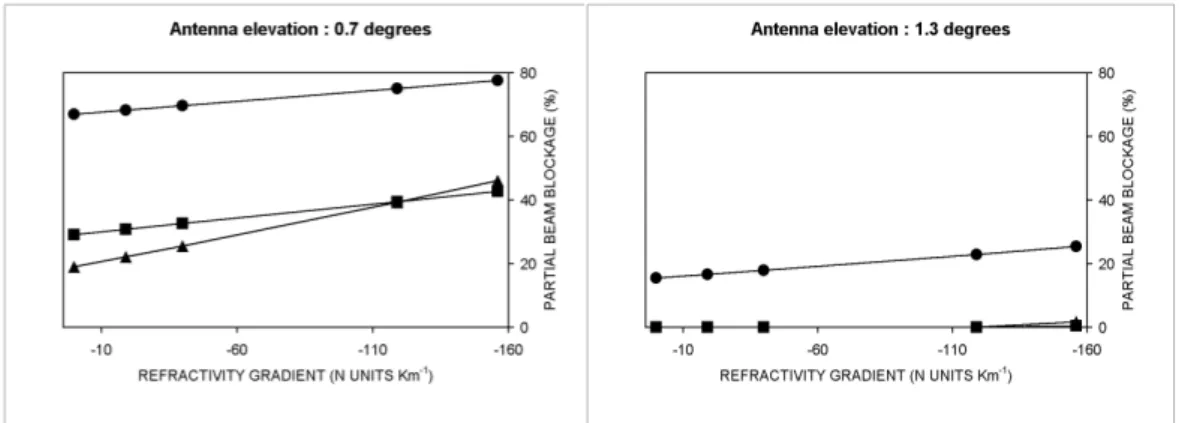
In Figure 3-2 a set of beam blockages vs VRG plots is shown for different antenna elevation angles. The refractivity gradient values considered contain the observed extreme VRG values (–119 km-1 and –15 km-1) and are also extended to include pure subrefraction (0 km-1) and almost ducting conditions (–156 km-1) to illustrate their effects. These extreme cases seem realistic taking into account the presence of thin ducting layers that may have high VRG embedded in others with lower VRG and considering the fact that the bending of the ray path is an additive process throughout the whole layer crossed by the radar beam.
As expected, as the antenna angle increases, beam blockage is reduced. For example, for an antenna elevation of 0.7 º a relatively high beam blockage rate is expected as the lowest part of the main lobe in a 1.3º beamwidth antenna is pointing to the surrounding hills, producing values of blockage ranging mostly between 30% and 80%. On the other hand, the 1.3º elevation beam blockage values are mostly below 20% and for some targets are always
Fig. 3-2. Simulated beam blockage vs vertical refractivity gradient for targets MNT, (cercle), LML (square) and MNY (triangle) at different antenna angles.
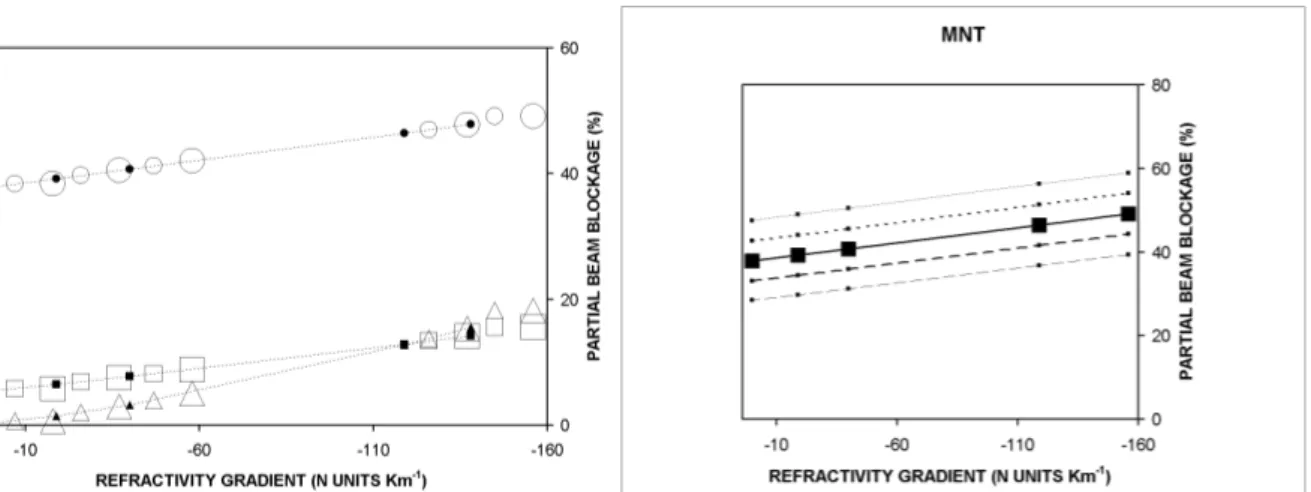
Fig. 3-3. Simulated beam blockage frequency and cumulative probability distributions (left) and the corresponding correction histograms (right) for 1º antenna elevation.
In Figure 3-3, the nearest targets, namely MNT and LML, show moderate (around 40%) to low (10%) rate of beam blockage, respectively. The most distant target, MNY, intercepts the radar beam mostly between 8% and 14%. The range of variations in the beam blockage observed in the above mentioned histograms oscillates from 8% (LML) and 10% (MNT) to 18% (MNY). From the cumulative probability plots may be noted that both MNT and LML show single classes representing more than 50% while a more smoothed distribution is found for MNY. The corresponding correction histogram is also shown Should the beam blockage correction have been a continous function, where for a particular value of blockage a different correction factor would be applied, then the spread of the beam blockage histograms would have been reflected in the spread of the correction histograms. However, this is not the case for the particular type of correction considered where only four different correction values are possible depending on the beam blockage. Therefore, a big variability in the beam blockage occurrence does not necessarily produce the same variability in the blockage correction.
This effect is illustrated by the distant target MNY where a relatively high variability in the blockage (10% to 16%) does produce only two possible different correction values, just like the other targets with less variability. The change from one correction factor to the other is produced always under super refractive conditions so, in this case, subrefraction is not relevant enough to produce significant changes in the beam , as might be anticipated from the VRG histogram, which shows a much shorter tail in the subrefractive area than in the super refractive one.
Despite the variance shown in the blockage correction, it is important to note that, in the three cases considered, the most usual blockage correction occurs more than 85% of the time, so, in principle, the beam blockage correction may be considered reasonably robust. However, the occurrence of intense ducts shown by the radiosonde data analysis indicates that greater differences in corrections values than those shown are possible. Though it is difficult to quantify the frequency at which these extreme VRG do occur, as discussed before, the effects of embedded ducting layers in apparently more smoothed VRG should be cautiously considered.
From the point of view of the radar beam blockage, diurnal VRG range implies quite a limited effect as may be noted in Figure 3-4. It shows a simulation of the beam blockage for an antenna elevation angle of 1º and also plots the simulated blockage considering two possible diurnal ranges (7 and 18 N units km-1). The differences in the blockage are between
1% and 2% so, in general, they do not have significant effects in the corrections. Another remark about the average VRG diurnal range is that, given its relatively low value, changes in the VRG usually happen at a larger scale than a single day and, therefore, are more noticeable on a month to month basis.
Another source of variability in the occultation corrections is the pointing accuracy of the antenna. It shows a simulation of the radar beam blockage produced with an antenna elevation of 1º at the three selected targets compared with the different blockage caused by mean standard errors of 0.10º and 0.05º in the antenna elevation. The 0.10º errors are very relevant and produce significant effects, comparable or even larger than those attributed to the variability of the VRG (around 10% in the beam blockage). The 0.05º pointing errors induce shielding variations of 5% in the beam blockage, more than twice the variation caused by an average VRG summer daily range.
4. FORECASTING PROPAGATION CONDITIONS
4.1. Monitoring propagation conditions with NWP data
Quantitative use of weather radar observations, such as assimilation for NWP, require an exhaustive quality control system (see for example Alberoni et al., 2003). The electromagnetic propagation conditions of the troposphere may lead to anomalous propagation of the radar beam, so this factor may affect the quality of observations.
Fig. 3-4. Left: diurnal effect of VRG range: small solid symbols correspond to 12 Z and medium and bigger symbols to 00 Z for an average and summer diurnal range, respectively (MNT, circle; LML, square; and MNY, triangle). Right: simulated beam blockage for an antenna elevation of 1º and the values correponding to standard errors in the antenna pointing accuracy of 0.10º and 0.05º evaluated at target MNT.
In this section, NWP mesoscale data is used to forecast the propagation environment in the Barcelona area (NE Spain). Four months of model forecasts are compared with radiosonde observations. Two magnitudes have been considered to monitor the radar propagation environment: the vertical refractivity gradient (VRG) of the first 1000 m above ground level and a ducting index (ID). The ducting index, which is adimensional, considers the degree of
departure from the threshold of the super refractive gradient in the 3 first km of air, examining both surface and surface based microwave ducts and selecting the highest ID found. Positive
ID values indicate superrefraction. Johnson et al. (1999) found a high correlation between this
index and weather radar anomalous propagation echoes.
4.2. NWP forecasts and radiosonde observations
The MASS model (Koch et al., 1985; Codina et al. 1997) was used to obtain vertical refractivity profiles from operational runs at 12 and 24 h. The version of the model was
hydrostatic, with a horizontal grid resolution of 15 km and 30 vertical levels.
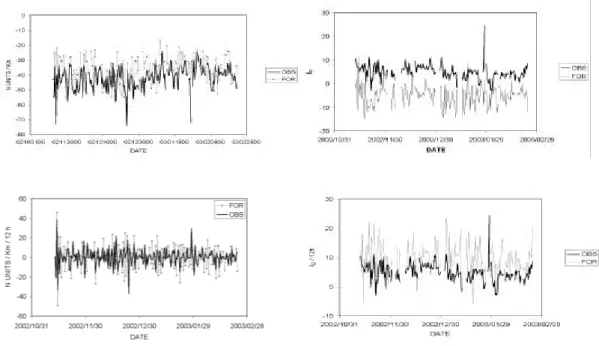
The time period considered ranged from November 2002 to February 2003 allowing the comparison of 183 pairs of model forecasts and radiosonde observations collected in Barcelona (Figure 4.1).
Fig. 4.1. Time series of VRG (left) and ID (right) forecasts and observations (top) and the corresponding 12 h tendencies (bottom).
It may be appreciated that model forecasts tend to underestimate super refraction; both VRG and ID are biased in this direction (5 N units/km and 10 ID units, respectively). The
mean absolute error were 8 units/km and 10 ID units. The VRG 12 h tendency was generally
in good agreement with the observations, particularly its sign while ID tendencies were
sistematically greater than those observed. Time averaging with moving windows of 2, 7 and 15 days (not shown) indicated that average conditions and tendencies were reasonably well simulated by the model for VRG and, to a lesser extent, for ID which presented more
variability.
To compare these results with the persistence of the observations, their autocorrelation function, mean error (ME), mean absolute error (MAE) and root mean squared error (RMSE) up to 10 days were examined (Figure 4.2). For example, the lowest MAE for the VRG observations was achieved with the 12 h persitence (6,77 N units/km) and the ME with the 24 h persistence (0,09 N units/km). Similar results were obtained for the ID persistence: 12h (–
0.02 ID units) and 36 h (2.31 ID units) for the MAE and ME respectively. These values are
better than those obtained with the model forecasts described earlier. So, taking into account these results, new modified forecasts were considered using both forecasts and previous observations.
4.3. Modified forecasts
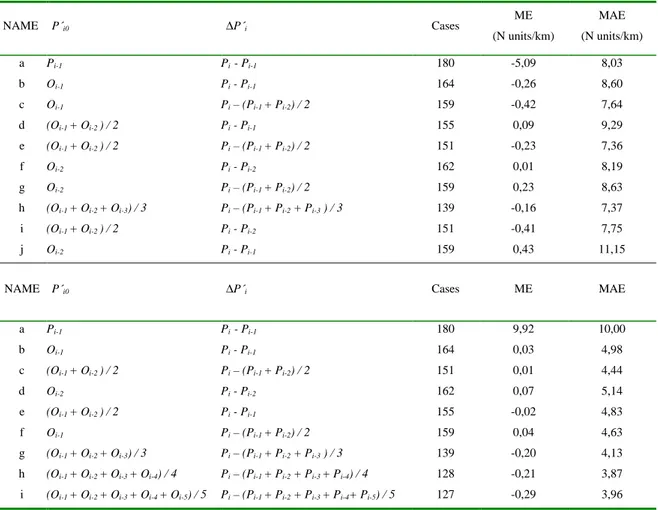
The modified forecasts, P´i, were built considering an initial value P´i0 and an increment
∆P´i:
P´i = P´i0 + ∆P´i .
Different P´i, a set of linear combinations of past observations (Oi-1, Oi-2, ... 12, 24 h old,
etc) in the initial value P´i0 and forecasts (Pi, Pi-1, ...) in the increment ∆P´i, were considered
in order to introduce both the average state of the magnitude and the tendency (Table 4.1; the a forecast is the original model output). ME of 0.01 N units/km were achieved for the VRG, though the MAE did not improve significantly respect the original VRG forecast. Similar improvements were obtained for the ID forecasts.
NAME P´i0 ∆P´i Cases ME (N units/km) MAE (N units/km) a Pi-1 Pi - Pi-1 180 -5,09 8,03 b Oi-1 Pi - Pi-1 164 -0,26 8,60
c Oi-1 Pi – (Pi-1 + Pi-2) / 2 159 -0,42 7,64
d (Oi-1 + Oi-2 ) / 2 Pi - Pi-1 155 0,09 9,29
e (Oi-1 + Oi-2 ) / 2 Pi – (Pi-1 + Pi-2) / 2 151 -0,23 7,36
f Oi-2 Pi - Pi-2 162 0,01 8,19
g Oi-2 Pi – (Pi-1 + Pi-2) / 2 159 0,23 8,63
h (Oi-1 + Oi-2 + Oi-3) / 3 Pi – (Pi-1 + Pi-2 + Pi-3 ) / 3 139 -0,16 7,37
i (Oi-1 + Oi-2 ) / 2 Pi - Pi-2 151 -0,41 7,75
j Oi-2 Pi - Pi-1 159 0,43 11,15
NAME P´i0 ∆P´i Cases ME MAE
a Pi-1 Pi - Pi-1 180 9,92 10,00
b Oi-1 Pi - Pi-1 164 0,03 4,98
c (Oi-1 + Oi-2 ) / 2 Pi – (Pi-1 + Pi-2) / 2 151 0,01 4,44
d Oi-2 Pi - Pi-2 162 0,07 5,14
e (Oi-1 + Oi-2 ) / 2 Pi - Pi-1 155 -0,02 4,83
f Oi-1 Pi – (Pi-1 + Pi-2) / 2 159 0,04 4,63
g (Oi-1 + Oi-2 + Oi-3) / 3 Pi – (Pi-1 + Pi-2 + Pi-3 ) / 3 139 -0,20 4,13
h (Oi-1 + Oi-2 + Oi-3 + Oi-4) / 4 Pi – (Pi-1 + Pi-2 + Pi-3 + Pi-4) / 4 128 -0,21 3,87
i (Oi-1 + Oi-2 + Oi-3 + Oi-4 + Oi-5) / 5 Pi – (Pi-1 + Pi-2 + Pi-3 + Pi-4+ Pi-5) / 5 127 -0,29 3,96
On the other hand, a number of skill scores were considered to evaluate the ability of new ID forecasts to predict a positive value of ID, (i.e., detection of super refraction). The
scores (Table 4.2) are calculated after computing the number of positive values of ID correctly
forecasted (A), positive ID forecasts not observed (B), positive ID observed but not forecasted
(C), and observed and forecasted non positive ID (D; and N=A+B+C+D).
VERIFICATION SCORE FORMULATION RANGE PERFECT
Probability of Detection POD=A/(A+C) [0,1] 1
Probability of False Detection POFD=B/(B+D) [0,1] 0
Frequency of Misses FOM=C/(A+C) [0,1] 0
Probability of a Null Event PON=D/(B+D) [0,1] 1
Succes Ratio SR=A/(A+B) [0,1] 1
False Alarm FAR=B/(A+B) [0,1] 0
Percentage Correct PC=100(A+D)/N [0,100] 100
Frequency BIAS FBI=(A+B)/(A+C) [0,inf] 1
Critical Succes Index CSI=A/(A+B+C) [0,1] 1
True Skill Statistic TSE=(AD-BC)/((A+C)(B+D)) [-1,1] 1
Equitable Threat Score(*) ETS=(AD-BC)/((B+C)N+(AD-BC)) [-1/3,1] 1
Heidke Skill Score(*) HSS=(AD-BC)/((A+B)(B+D)+(A+C)(C+D)) [-inf,1] 1
*: A different formulation considering climatology is also available.
The scores were calculated for 12 and 24 h persistence of observations and for all new forecasts. Table 4.3 lists scores for direct model output (PMASS), unbiased PMASS, and persistence of the observations at 12 and 24 h. Table 4.4 shows results for new forecasts. The result of the comparison pointed out that new forecasts improved significantly the original model output (for example a POD of 0.89 in front of 0.84 for the unbiased model forecasts). However, the best scores were obtained using persistence at 12 h (POD: 0.96; FAR: 0.04; etc).
ÍNDEX PMASS PMASS-ME P12H P24H POD 0,064 0,843 0,962 0,955 POFD 0,000 0,900 0,700 0,800 FOM 0,936 0,157 0,038 0,045 PON 1,000 0,100 0,300 0,200 SR 1,000 0,942 0,956 0,949 FAR 0,000 0,058 0,044 0,051 PC 11,5 80,2 92,2 91,0 FBI 0,064 0,895 1,006 1,006 CSI 0,064 0,801 0,921 0,909 TSS 0,064 -0,057 0,262 0,155 ETS 0,004 -0,015 0,159 0,089 HSS 0,007 -0,031 0,275 0,163 VARIABLE B C D E F G H I POD 0,796 0,821 0,769 0,800 0,800 0,851 0,880 0,896 POFD 0,800 0,800 0,900 0,700 0,700 0,700 0,889 0,889 FOM 0,204 0,179 0,231 0,200 0,200 0,149 0,120 0,104 PON 0,200 0,200 0,100 0,300 0,300 0,300 0,111 0,111 SR 0,940 0,937 0,930 0,943 0,943 0,942 0,932 0,928 FAR 0,060 0,063 0,070 0,057 0,057 0,058 0,068 0,072 PC 76,0 78,1 72,9 76,8 76,8 81,3 82,8 83,9 FBI 0,847 0,876 0,827 0,848 0,848 0,903 0,944 0,965 CSI 0,758 0,778 0,727 0,763 0,763 0,809 0,827 0,837 TSS -0,004 0,021 -0,131 0,100 0,100 0,151 -0,009 0,007 ETS -0,001 0,006 -0,028 0,025 0,025 0,049 -0,003 0,003 HSS -0,002 0,011 -0,058 0,049 0,049 0,094 -0,007 0,006
5. CONCLUSIONS AND OUTLOOK
5.1. Review
A point by point summarized review of the objectives of the Thesis is done in this section:
1). Acquisition of the theoretical background, concepts and methodology related to the study of weather radar propagation conditions. The bibliographic search performed allowed
Table 4.3. Verification scores for direct model output, PMASS, unbiased PMASS and 12 and 24 h persistence.
to obtain a grounded basis about the topic of this research. A summary was provided both in Chapter 2, describing fundamental concepts in radio meteorology, and Appendix 1 ("Basic concepts in general radar meteorology", which were considered relevant to follow the discussions regarding radar measurements and hardware). The extended bibliography is also a result of the work motivated by this objective.
2). Development and implementation of analysis tools to study weather radar propagation conditions. A collection of programs (mostly written in C and in awk and a
number of Unix shell scripts) were written to process the data (quality control and processing of five years of Barcelona radiosonde data, HEPCD data base analysis, beam blockage simulation, refractivity profiles retrieved from NWP model output, forecast verification scores, etc..). Besides, other software packages for visualization and statistical analysis were also used as postprocessing tools).
3). Characterization of propagation conditions affecting an operational weather radar.
Using five years of radiosonde data collected in Barcelona, a statistical study of the microwave propagation conditions has been performed. Average values of the vertical refractivity gradient confirm that standard propagation conditions (–40 N units/km in the first kilometre of the troposphere) dominate. However, a clear tendency to superrefraction is revealed by the observed frequency distribution. Moreover, a marked seasonal cycle with a superrefractive maximum in summer was found, in good agreement with other stations nearby contained in the Historical Electromagnetic Propagation Condition Data Base of the US Navy.
4). Analysis of the propagation effects upon radar quantitative precipitation estimates.
The analyses has focused in the effects of propagation variability in beam blockage corrections. The US NEXRAD blockage correction system was used with different targets around the Vallirana radar. The variability of the correction was generally small, and in moderately intense super refractive situations, exceeded 1 dB with respect to the correction under standard propagation conditions. However, severe super refractive cases might cause bigger differences. For instance, extreme anaprop cases could easily produce a wrong correction of 2 or even 3 dB in the beam blockage correction scheme. Such errors might be significant, specially if the propagation conditions persisted over a long period of time and, obviously, if they occurred at the same time that precipitation took place. The potential errors
derived from wrong beam blockage corrections in extreme anaprop cases may be more important than the usual limitations of operational radar hardware calibration and stability.
5). Assessment of the feasibility of radar propagation conditions operational forecasts.
NWP model data were used to derive refractivity profiles in order to estimate weather radar anomalous propagation conditions in the Barcelona area. In particular, the vertical refractivity gradient of the first km above ground level and a ducting index were calculated. Four months of model forecasts were verified with radiosonde observations. From this first comparison, and after examining the persistence of the observations, modified forecasts were tested. The new forecasts were built as linear combinations of previous observations and forecasts to improve both the average value and the tendency of original forecasts. Significant improvements were found with the new forecasts, in particular for the vertical refractivity gradient. However, radiosonde observations persistence at 12 h produced better skill scores when used to calculate the ducting index though both mean and mean absolute errors of new forecasts were improved with new forecasts.
5.2. Further work
1). Expand the statistical analysis of propagation conditions, studying possible relationships of meteorological variables with them, and considering the use of inferential techniques as more data is available in future.
2). Perform detailed case studies from the meteorological point of view (synoptical framework, associated mesoscale features,..). Mesoscale model data would be essential for this purpose.
3). Perform detailed case studies from the radar propagation point of view. This would require the use of an advanced propagation model based, as has been done in previous SMC projects, on solving the parabolic equation which describes the radar power distribution considering a bi or tridimensional refractivity field.
4). Compare in more detail propagation conditions with radar observations. High quality radar observations, ideally long time series, with strictly quality controlled hardware calibration would be necessary to allow such comparisons.
5). Study the performance of procedures of clutter identification and substitution in anaprop situations, specially when rainfall is present and mixed with clutter echoes. These cases are the most interesting from the hydrometeorological point of view.
6. ACKNOWLEDGEMENTS
I want to express my gratitude to many people that, in a wide variety of ways, have contributed to complete this work. Quite often I felt fortunate for the support offered by professors and colleagues that helped me to progress in this research. The achievements obtained are mainly results of constructive interaction with other people; on the other hand, any possible errors or omissions, are due to my only responsibility.
Jeroni Lorente and Bernat Codina, from the Department of Astronomy and Meteorology (DAM) of the Barcelona University, directed this PhD Thesis; they always offered their scientific and academic support unconditionally. Their experience and patience played a crucial rôle to shape and fill the content of this volume.
I am also indebted to other professors of DAM: A. Redaño for his enthusiastic support, both at the University and while working at the Catalan Meteorological Service (SMC); M. C. Llasat and M. R. Soler for comments about radiosonde quality control and boundary layer treatment, respectively. I'm also thankful for PhD courses given by J. M. Baldasano and L. Cremades where also took part J. Calbó and C. Soriano; some years later they also provided with useful documentation which I used in this work.
I'd like to thank all colleagues at DAM during the 1994-1997 period: C. Cerro and F. Pastor –the three of us worked together in rainfall and disdrometry related projects and over the years I've appreciated greatly this experience–, and also many thanks to A. Sairouni, T. Aniento, J. Vidal and J. Aymamí. To them and to all students involved in radiosonde launching and data acquisition in the Physics Faculty we must thank their anonymous task.
The summer of 1996 I enjoyed a very fruitful stay with the R+D team of radar meteorology at the UK Met. Office in Bracknell, sponsored by the Commission for Research Universities of the Catalunya Government. With P. Hardaker, E. Archibald and C. Pierce I started to work with real radar data and began to learn about the potential problems that may affect them. Next autumn, the Vallirana weather radar was installed and I realized the value of the practical lessons taken at Bracknell. The same term started the EU project DARTH, where we planned and began the research of this Thesis. I must thank specially the coordinator, A. Holt, and D. Bebbington (Essex University Essex), C. G. Collier (Salford University), M. Chandra (DLR and later at Chemnitz Universität), P. P. Alberoni and S. Nanni (SMR d'Emilia-Romagna), M. Monai (ARPAV Veneto) and T. Andersson and D. Michelson (Swedish Meteorological and Hydrological Service). All of them helped offering their experience, documentation, examples of anaprop or ideas which were very useful, specially in the very beginning. The follow-on of DARTH, the CARPE-DIEM project, both EU funded, was crucial to complete this work.
At the end of 1997 I joined the SMC. It was a substantial change; I still worked in the operation of the Vallirana radar but now the objective was really operationally oriented rather than academic. I thank those who trusted me, O. Puig, E. Vilaclara and S. Paricio. Their comments helped me to focus some aspects of the Thesis on more practical applications which I think has been very beneficial.
I must thank other colleagues at SMC, mostly coming from DAM, who offered valuable suggestions on different parts of this work: J. Moré, J. Toda, J. R. Miró, N. Pineda, R. Veciana, M. Aran, and T. Rigo.
While working at SMC I've dealt with some projects related with the topic of this research which had ultimately a positive effect in this work. I'm particularly thankful for comments and documentation provided by A. Broquetes and X. Fàbregas (Universitat Politècnica de Catalunya, UPC) regarding radar coverage computations; E. Vilar and C. Catalán (Portsmouth University, Institut d'Estudis Espacials de Catalunya) about the implementation of an advanced propagation model and D. Sempere and R. Sánchez-Diezma (Grup de Recerca Aplicada en Hidrometeorologia, UPC) for discussions about radar quantitative precipitation estimates. I also appreciate A. Rius and L. Cucurull (Institut d'Estudis Espacials de Catalunya and later at NCAR) for their comments about GPS meteorology and related applications.
From the instrumental point of view I must thank practical experience learnt with J. López (MCV, S.A) –sharing and suffering together many hours the SMC radars– and the Sigmet Inc. team, manufacturers of many key components of our radars (R. Passarelli, E. Saltikova and, particularly, F. O'Hara), for useful discussions during the training course done in Boston (US) in June 2002. Many thanks also for the kindness and hospitality offered by A. Bellon and I. Zawadki in a brief but intense visit at the Marshall Radar Observatory in Montreal (Canada).
A special mention should be dedicated to the EU COST-717 action, devoted to the use of weather radar observations in NWP and hydrological models. I must thank all people who help me participating in it, in particular to the chairman A. Rossa (MeteoSwiss) and also the coordinator of the working group I joined, D. Frühwald (Deutscher Wetterdienst).
I also should thank documentation and comments by C. Ramis (Universitat Illes Balears) and J. L. Camacho, R. Pascual, J. Cuixart, A. Jansà and J. Arús (Instituto Nacional de Meteorología). With the latter, and also A. Mestres, I enjoyed the task done at the Catalan Meteorological Association which allowed discovering the huge work of E. Fontserè and the old SMC.
Last, but not least, I must thank the human support from friends and relatives around me, in particular my parents, and very, very specially, those whom I share every day's life: (in reversal order of arrival) Laia, Oriol, Martí and Encarnació. To them I dedicate this Thesis.
7. REFERENCES
Alberoni, P. P., V. Ducrocq, G. Gregoric, G. Haase, I. Holleman, M. Lindskog, B. Macpherson, M. Nuret, and A. Rossa, 2003: Quality and Assimilation of Radar Data for NWP — A Review. COST 717 document. ISBN 92-894-4842-3, 38 pp.
Anderson, T., Alberoni, P. P., Mezzalsama, P., Michelson, D., Nanni, S., Anomalous propagation identification from terrain and sea waves using vertical reflectivity profile analysis, 28th Internat. Conf. On Radar
Meteor., Amer. Meteor. Soc., Austin, Texas, 93-94, 1997.
Archibald, E., Enhanced clutter processing for the UK weather radar network, Phys. and Chem. of the Earth.
Part B-Hydrology, Oceans and Atmosphere, 25, 823-828, 2000.
Battan, L. J. 1973: Radar Observation of the atmosphere. University of Chicago Press, Chicago, 324 pp. Bean, B. R., and E. J. Dutton, 1968: Radio meteorology. Dover Publications, 435 pp.
Bech, J. (1998), D. Bebbington, B. Codina, A. Sairouni, J. Lorente, "Evaluation of atmospheric anomalous
propagation conditions: an application for weather radars" EUROPTO Conference on Remote Sensing
for Agriculture, Ecosystems, and Hydrology .Barcelona, SPAIN. September 1998, SPIE Vol. 3499, pp. 111-115
Bech, J. (2000), A. Sairouni, B. Codina, J. Lorente, D. Bebbington, "Weather radar anaprop conditions at a
Mediterranean coastal site", Physics and Chemistry of the Earth (B), Vol. 25, No. 10-12, pp- 829-832,
2000, ISSN 1464-1909
Bech, J. (2002), B. Codina, J. Lorente, and D. Bebbington, “Monthly and daily variations of radar anomalous
propagation conditions: How “normal” is normal propagation?”. Proceedings 2nd European Conference on Radar Meteorology: 35–39. Copernicus GmbH © 2002.
Bech, J. (2002), Codina B., Lorente J., Bebbington D., "On the effect of anomalous propagation on weather
radar beam blockage corrections", EU COST 717 Working Document, WG2. 9 p.
Bech, J. (2003a), Codina B., Lorente J., Bebbington D., “The sensitivity of single polarization weather radar
beam blockage correction to variability in the vertical refractivity gradient”. J. Atmos. and Oceanic
Technol., 20, 845-855.
Bech, J. (2003b), Codina B., Lorente J.,"A quality control for weather radar data using NWP mesoscale output", EU COST 717 Working Document, WG2. 7 p.
Bech, J. (2003c), Codina B., Lorente J.,"Forecasting weather radar propagation conditions using NWP
mesoscale model data", 5 p., submitted to the 25th EWGLAM - 10th SRNWP meeting, October 2003, Lisbon.
Bech, J., A. Sairouni, B. Codina, J. Lorente, and D. Bebbington, 2000: Weather radar anaprop conditions at a Mediterranean coastal site. Phys. Chem. of the Earth (B), 25, 829-832.
Bech, J., Codina B., Lorente J., Bebbington D., 2003: The sensitivity of single polarization weather radar beam blockage correction to variability in the vertical refractivity gradient. J. Atmos. and Oceanic Technol., 20, 845-855.
Codina, B., A. Sairouni, J. Bech, A. Redaño, 1997: Operational aplication of a nested mesoscale numerical model in Catalonia (Meteo'96 Project). INM/WMO International Symposium of Cyclones and
Hazardous Weather in the Mediterranean, ISBN 84-7632-329-8, 657-667.
Collier, C.G., 1996: Applications of weather radar systems. John Wiley& Sons, 390 pp.
da Silveira, R. B., and Holt, A. R., A neural network application to discriminate between clutter and precipitation using polarisation information as feature space. 28th Internat. Conf. on Radar Meteor., Amer. Meteor.
Soc., Austin, Texas, 57-58, 1997.
Doviak, R. J., and Zrnic, D. S., Doppler radar and weather observations, Academic Press, 1992.
Fabry, F., C. Frush, I. Zawadki, and A. Kilambi, 1997: On the extraction of near-surface index of refraction using radar phase measurements from ground targets. J. Atmos, Oceanic Technol., 14, 978-897.
Frühwald, D., 2000: Using radar observations for parametrisations and validation of atmospheric models-strategy of COST 717 Working Group 2. Phys. Chem. Earth (B), 25, 1251–1253.
Fulton, R.A., Breidenbach, J.P., Seo, D., Miller, D., and O'Bannon, T., The WSR-88D Rainfall Algorithm. Wea.
Forecasting, 13, 377-395, 1998.
Gabella, M., and G. Perona, 1998: Simulation of the orographic influence on weather radar using a geometric-optics approach, J. Atmos. Oceanic Technol., 15, 1486-1495.
Gossard, E.E., 1977: Refractive index variance and its height distribution in different air masses. Rad. Sci. 12 (1), 89-105.
Harrold, T., E. English, and C. Nicholass, 1974: The accuracy of radar-derived rainfall measurements in hilly terrain. Quart. J.Roy. Meteor. Soc., 100, 201–208. 837–845.
ITU, ITU-R P.453-6 Recommendation, The Radio Refractive Index: Its Formula and Refractivity data, ITU Radiocommunication Assembly, ITU-R P-Series, 1997.
Johnson, C., D. Harrison, B. Golding, 1999: Use of atmospheric profile information in the identification of anaprop in weather radar images. Observation Based Products Technical Report No. 17, Forecasting Systems, UK Meteorological Office, 30 pp. [Available from the National Meteorological Library, London Road, Bracknell, RG12, 2SZ, UK]
Joss, J., and A. Waldvogel, 1990: Precipitation measurement and hydrology, a review. Radar in Meteorology, D. Atlas, Ed., American Meteorol. Soc., Boston, ed. D. Atlas, Chapter 29a, pp. 577-606.
Joss, J., and R. Lee, 1995: The application of radar-gauge comparisons to operational precipitation profile corrections, J. Appl. Meteor., 34, 2612-2630.
Kitchen, M., R. Brown, A.G. Davies, 1994: Real-time correction of weather radar data for the effects of bright band, range and orographic growth in widespread precipitation, Quart. J. Roy. Met. Soc., 120, 1231-1254.
Koch, S. E., W. C. Skillman, P. J. Kocin, P. J. Wetzel, K. F. Brill, D. A. Keyser, M. C. McCumber, 1985: Synoptic scale forecast skill and systematic errors in the MASS 2.0 model. Mon. Wea. Rev., 113, 1714-1737.
Krajewski, W. F., and B. Vignal, 2001: Evaluation of anomalous propagation echo detection in WSR-88D Data: a large sample case study. J. Atmos. Oceanic Technol., 18, 807-814.
Lane, J.A, The radio refractive index gradient over the British Isles, J. Atmosph. and Terrest. Phys., 21, 157-166, 1961.
Low, T. B., and D. R. Hudak, 1997: Development of Air Mass Climatology Analysis for the Determination of Characteristic Marine Atmospheres. Part I: North Atlantic, Theor. Appl. Climatol., 57, 135-153.
Météo-France, 1997: Quality control on GTS data at Météo-France. Météo-France, Service Centrale d'Exploitation de la Météorologie. 42, Av. Coriolis, 31057 Toulouse Cedex 1, France
Michelson, D. B., T. Andersson, J. Koistinnen, C. G. Collier, J. Riedl, J. Szturc, U. Gjertsen, A. Nielsen, S. Overgaard, 2000: BALTEX radar data centre products and their methodologies. RMK 90. Swedish Meteorological and Hydrological Institute, Norrköpping, Sweden.
Moszkowicz, S., Ciach G. J., Krajewski W. F., Statistical detection of anomalous propagation in radar reflectivity patterns, J. Atmos. Oceanic Technol., 11, 1026-1034, 1994.
Newsome, D.H., 1992: Weather Radar Networking COST Project 73 Final Report, Kluwer Academic Publishers, 254 pp.
Patterson, W. L., 1987: Historical Electromagnetic Propagation Condition Database Description. Technical Document 1149, ADA-A189 157, NOSC 1149, US NAVY, 71 pp.
Pittman, T.S., 1999: A climatology-based model for long-term prediction of radar beam refraction. Master’s Thesis, US Air Force Institute of Technology, 184 pp.
Redaño, A., J. Cruz and J.Lorente, 1991: Main features of sea breeze in Barcelona, Meteorol. Atmos. Phys., 46, 175-179
Rossa, A. M.: 2000, The COST 717 action: use of radar observations in hydrological and NWP models. Phys.
Sánchez-Diezma, R., Sempere-Torres, D., Delrieu, G., and Zawadki, I., An improved methodology for ground clutter substitution based on a pre-classification of precipitation types. 30th Internat. Conf. on Radar Meteor., Münich, Germany, Amer. Meteor. Soc., 271-273, 2001.
Sauvageot, H., 1994: Rainfall measurement by radar: a review. Atmos. Res., 35, 27-54.
Shedd, R., J. Smith, and M. Walton, 1991: Sectorized hybrid scan strategy of the NEXRAD precipitation-processing system. Hydrological Applications of Weather Radar, I. Cluckie and C. Collier, Eds. Ellis Horwood Limited, 151-159.
Skolnik, M., 1980: Introduction to radar systems. New York, McGraw-Hill, 581 pp.
Smith, P. L., Jr., 1998: On the minimum useful elevation angle for weather surveillance radar scans. J. Atmos.
Oceanic Technol., 15, 841-843.
Steiner, M., and Smith, J. A., Use of three-dimensional reflectivity structure for automated detection and removal of non-precipitating echoes in radar data. J. Atmos. Oceanic Technol., 19, 673-686, 2002. Wilson C., 2001: Review of current methods and tools for verification of numerical forecasts of precipitation.
OBSERVATIONAL ANALYSIS AND NUMERICAL MODELLING OF ATMOSPHERIC PROPAGATION CONDITIONS OF WEATHER RADAR ECHOES – EXTENDED ENGLISH
SUMMARY ... 1
1. AIM AND OVERVIEW... 1
1.1. Introduction ... 1
1.2. Objectives ... 1
2. WEATHER RADAR BEAM PROPAGATION CONDITIONS... 2
2.1. Air refractivity ... 2
2.2. Radiosonde data ... 4
2.3. Surface refractivity ... 5
2.4. Vertical refractivity gradient ... 7
2.5. Anaprop events ... 8
3. SENSITIVITY OF BEAM BLOCKAGE CORRECTIONS TO PROPAGATION CONDITIONS... 10
3.1. Radar beam blockage ... 10
3.2. Beam blockage simulation ... 11
3.3. Beam blocking correction... 12
3.4. Refractivity gradient vs beam blockage... 13
FORECASTING PROPAGATION CONDITIONS... 16
4.1. Monitoring propagation conditions with NWP data... 16
4.2. NWP forecasts and radiosonde observations ... 17
4.3. Modified forecasts ... 19
5. CONCLUSIONS AND OUTLOOK... 21
5.1. Review... 21
5.2. Further work... 23
6. ACKNOWLEDGMENTS... ¡ERROR!MARCADOR NO DEFINIDO. 7. REFERENCES... 25