91
RESULTS AND DISCUSSION
1. Structural and Regulatory features
1.1 Biochemical characterization of point mutants
1.1.1 Effector sites
The crystal structures of human cN-II describes two hypothetic activation sites, giving some hints of the aminoacid residues which could constitute the effector sites 1 and 2 (Walldén et al., 2007b;
Walldén et al., 2011).
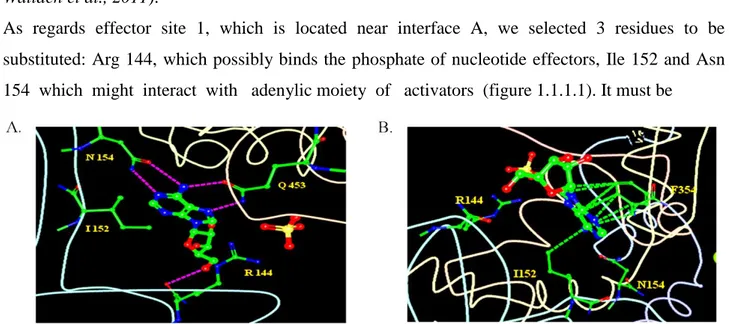
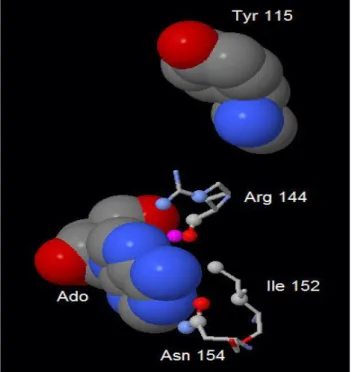
As regards effector site 1, which is located near interface A, we selected 3 residues to be substituted: Arg 144, which possibly binds the phosphate of nucleotide effectors, Ile 152 and Asn 154 which might interact with adenylic moiety of activators (figure 1.1.1.1). It must be
Figure 1.1.1.1: Effector site 1, indicating the position of R144, I152 and N154. The hydrogen bonds (A, fuchsia dashed lines) and hydrophobic interactions (B, green dashed lines) are depicted. Sulfates (red and yellow) and adenosine (red, green and blue) are shown as well (the images have been computed using RCSB PDB Ligand Explorer 3.5 software).
pointed out that we designed and built several point mutants basing on the crystal structures of cN-II in complex with adenosine and beryllium trifluoride which were published in 2007; last year, new crystal structures were presented giving a more detailed description
Figure 1.1.1.2: Effector site 1, indicating the position of R144 (red), I152 (green) and N154 (blue). The dimer is composed by subunit A (green) and B (light blue). Glycerol (red and grey),
magnesium (green) and
adenosine (red, grey and blue) are shown. The image has
been visualized using
Polyview-3D server, http:// polyview.cchmc.org/polyview 3d.html.
92 of the putative effector sites partially confirming previous data; fore more information refer to chapter “Introduction”. We replaced all these three aminoacids with negatively charged residues in order to disturb electrostatic interactions (R144E, I152D, N154D; figure 1.1.1.2). With respect to effector site 2, which binds adenosine in a less ordered manner than effector site 1 (remember that in the studies published in 2007 the ribose moiety was completely disordered, whereas the electron density clearly indicated only the location of adenine base), we chose 3 aminoacids to mutate:
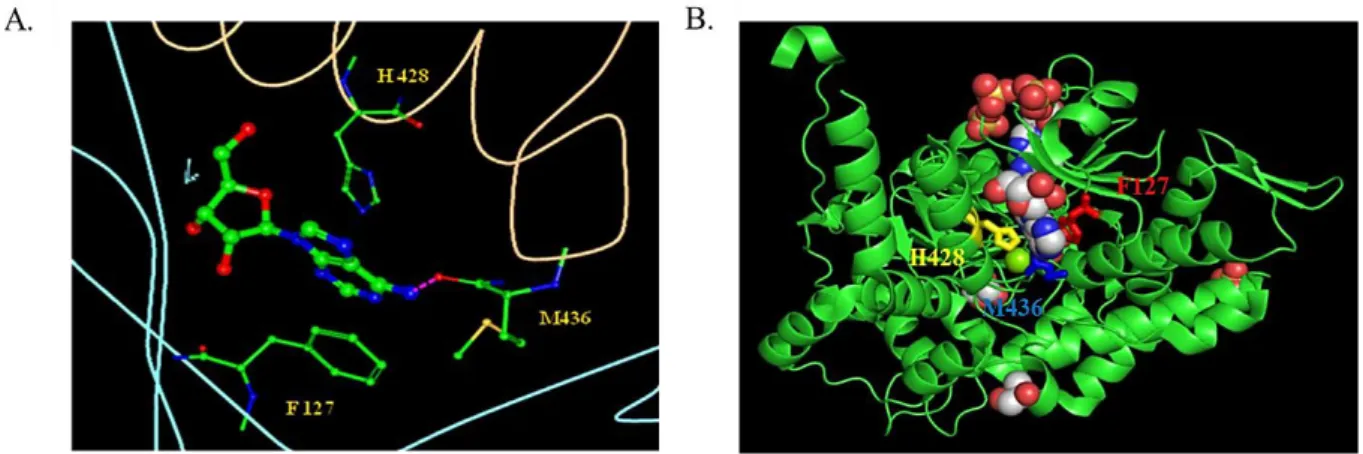
Figure 1.1.1.3: Effector site 2, indicating the position of F127, H428 and M436. A. The hydrogen bonds are depicted as fuchsia dashed lines. Adenosine is red, green and blue (the image has been computed using RCSB PDB Ligand Explorer 3.5 software); B. Image of one monomer. Sulfates (red and yellow), magnesium (green), glycerol (red and grey) and adenosine (red, grey and blue) are shown (the image has been visualized using Polyview-3D server,
http://polyview.cchmc.org/polyview3d.html ).
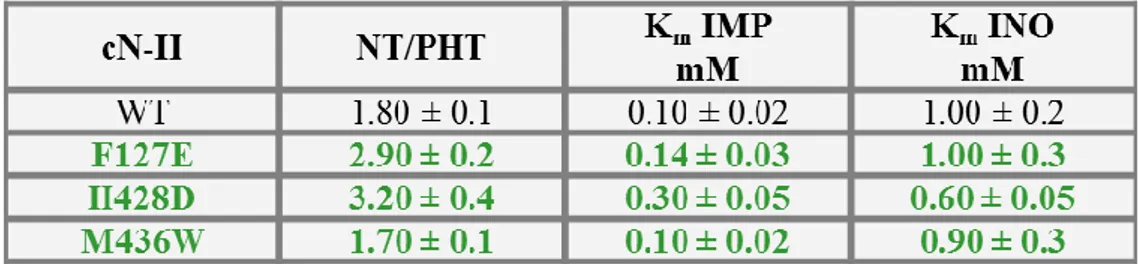
Phe 127 and His 428 as it seems that the purine ring is stacked between them and Met 436 which forms an hydrogen bond with adenine (figure 1.1.1.3). We substituted the first two residues with negatively charged aminoacids as to damp stacking and the third into Trp inable to form hydrogen bridges (F127E, H428D, M436W; figure 1.1.1.3).
As shown in table 1.1.1.1, the Km value for IMP and Inosine measured for the mutants of the
Table 1.1.1.1: Hypothetic effector site 1. Effect of point mutations on Km value of bovine recombinant cN-II.
Nucleotidase (NT) and phosphotransferase (PHT) activities were measured as described in “Materials and Methods”. The reported results are means ± SD of at least three independent assays (modified from Pesi et al., 2011).
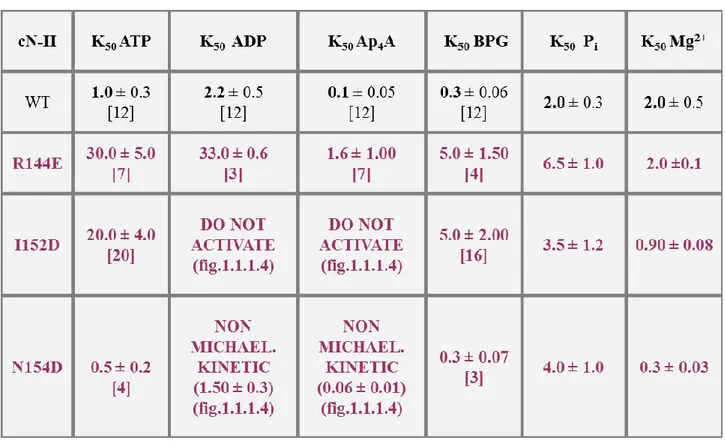
putative effector site 1 were unchanged, while we registered some interesting data regarding the concentration of half activation. In particular, R144E showed an increase of K50 and a decrease of
93 by ATP and 2,3-BPG without alteration of the affinity for these two effectors (table 1.1.1.2). Besides, the activation curve of N154D with Ap4A and ADP showed that they exerted an
Table 1.1.1.2: Hypothetic effector site 1. Effect of point mutations on various kinetic parameters of bovine recombinant cN-II. Nucleotidase (NT) and phosphotransferase (PHT) activities were measured as described in “Materials and Methods”. The reported results (in mM) are means ± SD of at least three independent assays. K50 values for Pi, ATP,
ADP and Ap4A were measured as phosphotransferase activity, while those for BPG and Mg2+ were measured as
nucleotidase activity. Numbers in round brackets indicate S0.5, while those in square brackets represent activation times
(modified by Pesi et al., 2010).
inhibitory effect above a concentration threshold (0.25 mM for Ap4A, 5 mM for ADP; figure
1.1.1.4). Moreover, high ionic strength (KCl 500 mM) increased N154D activity only 4 times in comparison to the 12-fold of WT. It is plausible that this mutation causes a stabilization of a “high activity” conformation, so that N154D results less sensitive to the effect of all the activators. In the end, we showed that Ap4A and ADP were not able to activate I152D, which showed an alteration of
affinity for ATP and 2,3-BPG too (figure 1.1.1.4).
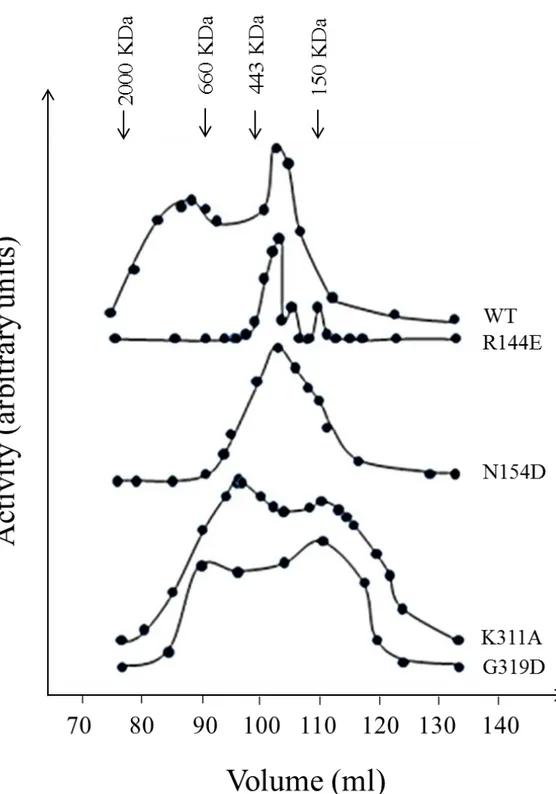
We performed also gel filtration experiments on the mutants R144E and N154D: these indicated that their chromatographic behaviours were similar to that registered for WT, where the tetrameric form was the smallest and the more represented aggregation state (figure 1.1.1.5).
Figure 1.1.1.4 (It follows in next page): Enzyme activity of I152D and N154D, mutants in effector site 1, as a function of mM concentration of four activators (as regards ATP, ADP and Ap4A it was measured as phosphotransferase
activity; respect to 2,3-BPG, it was measured as nucleotidase activity; read “Materials and Methods” for more information).
94
95
Figure 1.1.1.5:Activity chromatographic profiles of wild type cN-II, R144E (effector site 1), N154D (effectors site 1), K311A (interface B) and G319D (interface B). The gel filtration was performed as described in “Materials and Methods”. Enzyme activity was measured as phosphotransferase.
With regard to the hypothetic effector site 2, F127E and M436W showed the same kinetic behaviours of the wild type with all the activators except for the sigmoidicity of the ATP activation curve; anyway its activatory capacity was unaltered (tables 1.1.1.3 and 1.1.1.4). On the contrary
96 H428D was almost insensitive to all the effectors tested.
Table 1.1.1.3: Hypothetic effector site 2. Effect of point mutations on Km value of bovine recombinant cN-II.
Nucleotidase (NT) and phosphotransferase (PHT) activities were measured as described in “Materials and Methods”. The reported results are means ± SD of at least three independent assays (modified from Pesi et al., 2011).
Table 1.1.1.4: Hypothetic effector site 2. Effect of point mutations on various kinetic parameters of bovine recombinant cN-II. Nucleotidase (NT) and phosphotransferase (PHT) activities were measured as described in “Materials and Methods”. The reported results (in mM) are means ± SD of at least three independent assays. K50 values for Pi, ATP,
ADP and Ap4A were measured as phosphotransferase activity, while those for BPG and Mg2+ were measured as
nucleotidase activity. Numbers in round brackets indicate S0.5, while those in square brackets represent activation times
(modified by Pesi et al., 2010).
On the basis of these results we published an article proposing that the putative effector site 1 might be specific for the binding of ADP and Ap4A; while, with respect to the putative effector site
2, big doubts remain about its identity as a regulatory site. In fact, it seems that ATP and 2,3-BPG probably bind some other site (Pesi et al., 2010). This results were confirmed, one year later, by the crystallographic studies performed by Walldén and colleagues (refer to “Introduction”; Walldèn et
97 Before discussing next section, it is important
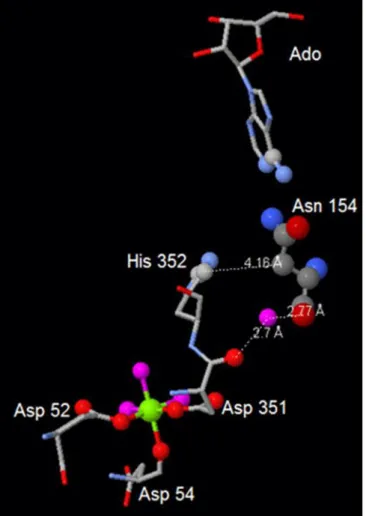
to linger over mutant N154D; not only it showed a decrease in the value of K50 for Mg2+,
as evident from table 1.1.1.2, but, more, it showed some activity even in the absence of added Mg2+, whereas all the other active mutants, as well as the wild-type enzyme, are completely dependent on addition of this bivalent ion. This behaviour might be due to the proximity of Asn 154 to the active site: mutating N154 could have caused a modification in the interaction of this residue with Asp 351 (directly involved in Mg2+ binding; refer to “Introduction”) and His 352, both belonging to motif III. Remarkably, mutant D396A (see further), in which the mutation is located in interface A, very close to effector site 1 and the active site, shows a similar increase in affinity for Mg2+ (figure 1.1.1.6).
1.1.2 Interfaces
The tetrameric cN-II consists of two identical dimers hold together by interface A through several hydrogen bonds, while the
contacts between the two monomers are at interface B, due also to salt bridges (Walldén et
al., 2007).
We chose various aminoacids to discourage the aggregation at interface A (Phe 36, Tyr 115, Asp 396; figure 1.1.2.1) and at interface B (Lys 311, Gly 319;
Figure 1.1.1.6: The interactions of Asn 154 with both His 352 and Asp 351 (Active site, Motif III, directly involved in Mg2+-binding; from Pesi et al., 2010).
Figure 1.1.2.1: Interface A (subunit A in green, B in light blue, C in
fuchsia and D in
yellow), indicating the position of F36 (red),
Y115 (yellow) and
D396 (blue). Sulfates
(red and yellow),
magnesium (green) and glycerol (red and grey) are shown (the image has been visualized using Polyview-
3D server,
http://polyview.cchmc.o rg/polyview3d.html ).
98 figure 1.1.2.2), replacing them with residues
characterized by different charge and/or hindrance. As shown in tables 1.1.2.1 and 1.1.2.2, F36R was inactive, while the other two mutations seemed to have disturbed the activatory effects of ADP, Ap4A and in one case also of ATP; but in each of
these three mutants the effect exerted by 2,3-BPG remained pretty much the same. This could be explained if we consider that interface A is close to the activation site 1, which probably interacts with Ap4A and ADP (figure 1.1.2.3).
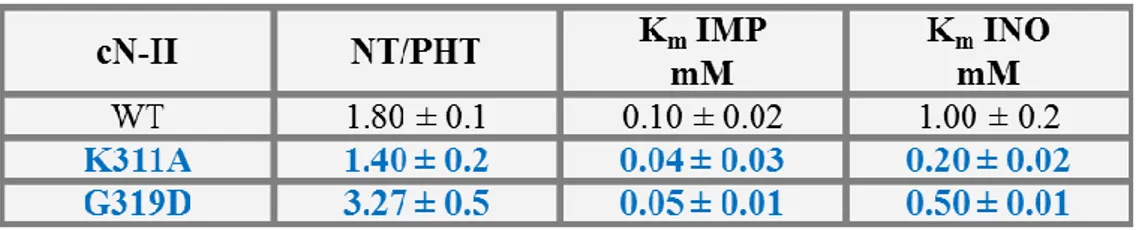
As regards the interface B, which was proposed to be responsible for the interaction of the two identical dimers, the two mutants showed unchanged Km values and activation kinetics
except for those concerning ADP and only in one case for ATP (tables 1.1.2.3 and 1.1.2.4; Walldén
et al., 2007b). Besides, preliminary gel filtration
chromatographies were performed both for K311A and for G319D, which indicated that the more represented state is compatible with a dimer; please, read next paragraph regarding a detailed experimental survey on WT and mutant structural peculiarities (figures 1.1.1.5 D and E).
Table 1.1.2.1: Interface A. Effect of point mutations on Km value of bovine recombinant cN-II. Nucleotidase (NT) and
phosphotransferase (PHT) activities were measured as described in “Materials and Methods”. The reported results are means ± SD of at least three independent assays (modified from Pesi et al., 2011).
Figure 1.1.2.2: Interface B (subunit A in green, B in light blue, C in fuchsia and D in yellow), indicating the position of K311 (blue) and G319 (red). Sulfates (red and yellow), magnesium (green) and glycerol (red and grey) are shown (the image has been visualized using Polyview- 3D server, http://polyview.cchmc.org/poly view3d.html ).
Figure 1.1.2.3: Detail of cN-II crystal structure showing the proximity of Tyr 115, which belongs to interface A, to Arg 144, one of the aminoacid included in effector site 1 (from Pesi et al., 2010).
99
Table 1.1.2.2: Interface A. Effect of point mutations on various kinetic parameters of bovine recombinant cN-II. Nucleotidase (NT) and phosphotransferase (PHT) activities were measured as described in “Materials and Methods”. The reported results (in mM) are means ± SD of at least three independent assays. K50 values for Pi, ATP, ADP and
Ap4A were measured as phosphotransferase activity, while those for BPG and Mg2+ were measured as nucleotidase
activity. Numbers in round brackets indicate S0.5 , while those in square brackets represent activation times (modified by
Pesi et al., 2010).
Table 1.1.2.3: Interface B. Effect of point mutations on Km value of bovine recombinant cN-II. Nucleotidase (NT) and
phosphotransferase (PHT) activities were measured as described in “Materials and Methods”. The reported results are means ± SD of at least three independent assays (modified from Pesi et al., 2011).
100
Table 1.1.2.4 (on previous page): Interface B. Effect of point mutations on various kinetic parameters of bovine recombinant cN-II. Nucleotidase (NT) and phosphotransferase (PHT) activities were measured as described in “Materials and Methods”. The reported results (in mM) are means ± SD of at least three independent assays. K50 values
for Pi, ATP, ADP and Ap4A were measured as phosphotransferase activity, while those for BPG and Mg2+ were
measured as nucleotidase activity. Numbers in round brackets indicate S0.5 , while those in square brackets represent
activation times (modified by Pesi et al., 2010).
It is worthy of underlining that Tyr 115 is located very close to Arg 144, which is part of effector site 1, and that - as the mutants at effector site 1 - showed an impairment in the activation by Ap4A
and ADP; this is a futher, although indirect, proof in favour of the hypothesis we explained before,
id est that effector site 1 is probably specific for the binding of Ap4A and ADP (figure 1.1.2.3).
1.2 Structural studies of WT and mutated recombinant cN-II
CN-II has been purified from various sources and has always been described as a homotetramer (Pinto et al., 1987; Spychala et al., 1988; Itoh and Yamada, 1990; Itoh, 1993; Oka et al., 1994;
Marques et al., 1998; Spychala et al., 1999; Walldén et al, 2007b).
The preliminary gel filtration experiments illustrated in figure 1.1.1.5 and performed on purified recombinant wild-type and mutated cN-II showed that the most represented state was the tetramer (240 KDa), even if heavier oligomerization states were present; the mutations of the residues located in interface B gave rise to the dimeric form, as expected, but without consequences on the catalytic activity, contrasting the hypothesis which correlates specific activity to the aggregation extent (refer to “Introduction” for more detailed; Spychala et al., 1999). Anyway, further studies were carried out in order to unravel this controversial point.
We began investigating the chromatographic behaviour of recombinant wild-type enzyme alone, in the presence of ATP as an activator and Pi as an inhibitor.
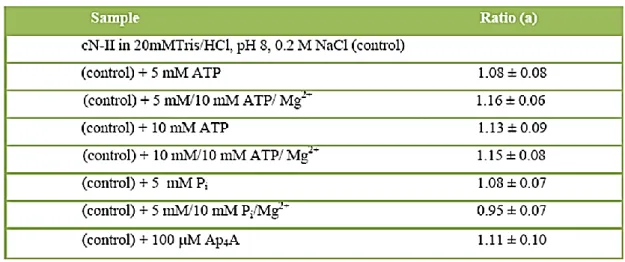
Table 1.2.1: Variation of the protein molecular mass in the presence of specific effectors as estimated by the ratio of the scattered light intensity. Values are means ± SD of at least three measurements. (a) Ratio of molecular mass in the presence of specific effectors to that of the free protein (modified from Pesi et al., 2010).
101 We began investigating the chromatographic behaviour
of recombinant wild-type enzyme alone, in the presence of ATP as an activator and Pi as an inhibitor.
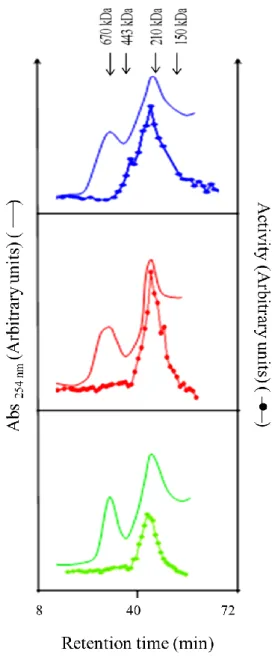
Figure 1.2.1 shows that the enzyme run and functioned as a tetramer (molecular mass 260 kDa) irrespectively of the presence of the effectors. This finding disagreed with other results obtained on recombinant human cN-II, which is almost identical to the bovine enzyme (refer to “Materials and methods”; Spychala et al., 1999).
Then, to further support these data, we teamed up with Dr. Giovanni Strambini and Dr. Margherita Gonnelli of the Institute of Biophysics (CNR, Pisa, Italy) to perform light scattering experiments, which confirmed that enzyme activation/inhibition is not followed by a change in enzyme subunit oligomerization state (table 1.2.1). Actually the chromatographic profiles I reported in figure 1.2.1 were revised after few considerations regarding one additional peak we removed from the chromatogram. As you can see in figure 1.2.2, the original profile of WT cN-II was constituted by three peaks (corresponding to 2x10⁶ Da, 7.2x10⁵ Da, 2.6x10⁵ Da). To analyse the identity of the first peak we adopted several strategies. First of all, we treated purified WT cN-II both with DNase and RNase: this caused the disappearance of the peak. Second, both protein specific staining and immunoblotting analysis (figures 1.2.2 and 1.2.3) confirmed that the first peak did not contain cN-II protein. This finding led to an intriguing hypothesis, which will be, probably, the basis
of an independent research project: cN-II as a DNA-binding protein? It is important to underline that Walldèn solved the crystal structure of cN-II by molecular replacement using the structure of the 31% sequence identical cN-II from Legionella pneumophila as template structure, which is classified as a DNA-binding protein (Walldén et al., 2007b).
Figure 1.2.1: FPLC profiles of wild-type cN-II alone (blue), or in the presence of 5 mM ATP and 10 mM MgCl2 (red), or in the
presence of 5 mM Pi and 10 mM MgCl2
(green). The column, prepared and eluted as described in “Material and methods”, was loaded with approximately 150 g of purified protein and the activity was measured as the rate of IMP production in the presence of inosine (phosphotransferase activity) as described in “Materials and methods” (modified from Pesi et al., 2010).
102 Another interesting point arose from the
original FPLC analysis of the purified recombinant WT cN-II was the presence of a peak compatible with a dodecamer (720 KDa), confirming our previous results (figures 1.2.1 and 1.1.1.5). Protein specific staining determined that the second peak is made of protein; moreover, immunoblotting indicated cross-reactivity with specific antibodies against cN-II (figures 1.2.2 and 1.2.3). This unusual and inactive oligomerization state of cN-II could depend on the fact that only a very small amount of cN-II is correctly folded and functioning. A decrease in growth temperature (20°C versus 37°C), in fact, resulted in an evident decrease of the heavier peak (figure 1.2.3).
Regarding the FPLC analysis of the recombinant proteins with point mutations at interface B (K311A, G319D; figure 1.2.4), we registered an active dimeric form in addition to the tetramer. However, stabilization of the dimeric form had no effect on the catalytic capacity of the enzyme. This was the first demonstration that the smallest active cN-II quaternary structure is the dimer; the monomer, in fact, is probably inactive.
To unambiguously confirm this hypothesis we tweaked a method which combines discontinuous native gradient gel
electrophoresis and the detection of 5’-nucleotidase activity on PVDF
Figure 1.2.2: Non-revised FPLC profiles of wild-type cN-II alone (green) and of wild-type cN-II after treatment with DNase/Rnase (blue), performed as described in “Material and methods”. In violet, chromatogram evaluated by protein specific staining according to Bradford (Bradford, 1976).
Figure 1.2.3: A. Non-revised FPLC profiles of wild-type cN-II purified from bacteria grown at 37°C (green) and at 20°C (blue), performed as described in “Material and methods”; B. On the left, SDS-PAGE (10% polyacrylamide gel) of the fractions specified in (A.) and, on the right, immunoblotting analysis with specific antibodies against cN-II of fractions
*, §, °.
103 membrane after western blotting. As illustrated in
figure 1.2.5 D and E, both K311A and G319D - submitted to this technique - showed three different oligomerization states, confirming the FPLC analysis (figure 1.2.4); moreover, it was proved that the dimeric band, which is not present in WT cN-II, is active (1.2.5 E). More, these results shed light on previuos contradictory data: preliminary gel filtration analysis showed the presence of a multimeric (heavier than the tetramer) active band, while following FPLC experiments not (figures 1.1.1.5 and 1.2.4). We may explain this contraddiction with the lack of resolution of the resin used for molecular exclusion chromatography; in fact, the detection of 5’-nucleotidase activity after native gradient electrophoresis did not show a multimeric active band.
The discontinuous native gradient gel electrophoresis, then, was applied also to recombinant WT and point mutant cN-II, in order to verify previous results.
Figure 1.2.5 A sets out the results obtained respect to effector site 1 (R144E, I152D, N154D): the electrophoretic pattern was similar to that of WT, confirming the data illustrated in figure 1.1.1.5. Same findings were obtained as regards effector site
2 (F127E, M436W; figure 1.2.5 B). Regarding interface A (F36R, Y115A; figure 1.2.5 C), it is important to pick up on what is happened with F36R: this mutant, which we demonstrated to be inactive through biochemical characterization, is present only in the dodecameric form (tables 1.1.2.1 and 1.1.2.2; figure 1.2.5 C); as we have shown before, this unusual oligomerization state was inactive; in this way, we could explain why this mutant have lost catalitic properties. Another confirmation was obtained by the detection of 5’-nucleotidase after native electrophoresis (figure 1.2.5 E).
Figure 1.2.4: FPLC profiles of wild-type cN-II (blue), of G319D (red) and of K311A (green). The column, prepared and eluted as described in “Material and methods”, was loaded with approximately 150 g of purified protein and the activity was measured as the rate of IMP production in the presence of inosine (phosphotransferase activity) as described in “Materials and methods” (modified from Pesi et
104
Figure 1.2.5: Discontinuous native gradient gel electrophoresis. A. Effector site 1 (R144E, I152D, N154D): run was performed on a 4-25% gradient gel, for 16 hours at 120 Volts; B. Effectors site 2 (F127E, M436W): run was performed on a 3-15% gradient gel, for 16 hours at 330 Volts; C. Interface A (F36R, Y115A): run was performed as described in (B); D. Interface B (K311A, G319D): run was performed on a 3-15% gradient gel, for 4 hours at 330 Volts; E. Detection of 5’-nucleotidase activity on PVDF membrane after western blotting (G319D, K311A, F36R, WT, R144E)
105
2. Physiological aspects
Cytosolic 5’-Nucleotidase II is fundamental for cell viability, as demonstrated by experiments of cN-II silencing in ADF cells and of cN-II overexpression in human epithelial 293 cells (Careddu et
al., 2008; Rampazzo et al., 1999). Nevertheless, the physiological role of cN-II remains to be
unravelled.
Trying to shed light on this important aspect, we designed and built two eukaryotic cellular models characterized by different cN-II expression levels. First, we will examine the galactose-inducible cN-II expressing model in yeast Saccharomyces cerevisiae and, then, the lentiviral vector-based, tetracycline-controllable cN-II silencing system applied to two human cell lines, the astrocytoma ADF cells and the human embryonic kidney 293T cells.
2.1 CN-II expression in Saccharomyces cerevisiae
The yeast Saccharomyces cerevisiae is an excellent genetic model to express human proteins and to investigate factors affecting homologous recombination (HR). For this reasons, in collaboration with Dr. Alvaro Galli of the Institute of Clinical Physiology (CNR, Pisa, Italy) and Dr. Simone Allegrini of the Department of Pharmacological Sciences (University of Sassari, Sassari, Italy) we expressed the bovine recombinant cN-II cDNA - under the control of the galactose inducible promoter Gal1 carried by the pYES2 vector (refer to “Material and Methods”) - in the diploid strain RS112 of S. cerevisiae and determined the effect on the growth and genome stability. The diploid RS112 strain, in fact, contains two alleles, ado 2-40 and ado 2-101, located in two homologous chromosomes that allow the measurement of interchromosomal recombination events (for the genotype of the diploid RS112 strain, read “Material and Methods”; Schiestl, 1989).
To better understand the role of cN-II in DNA repair, we determined the effect of the protein expression on DNA damage-induced recombination, after the biochemical characterization of the system, which demonstrated the substrate specificity and regulation of cN-II and, so, that RS112 carrying cN-II coding sequence was able to express cN-II protein (figure 2.1.1).
It is of enormous interest that yeasts expressing cN-II exposed to increasing concentrations of the alkylating agent methyl methanesulfonate (MMS) have a different trend of Ade2 interchromosomal recombination in comparison with the control, even if there are no changes in yeast viability: it seems that the presence of cN-II is able to interfere with MMS-induced DNA damage repair efficiency (figure 2.1.2). This finding could be explained by an alteration of intracellular nucleotide
106 pools caused by the presence of cN-II (we’d like to point out that MMS alkylates particularly adenine at the N3 position (3meA) and guanine at the N7 position (7meG) in DNA).
Figure 2.1.1: A. Biochemical characterization of diploid strain RS112 of S.cerevisiae expressing (+cN-II) or not (CTR) cN-II; enzyme activity was measured as phosphotransferase; B. SDS-PAGE (10 g of purified protein were loaded on a 10% polyacrylamide gel) of cellular content, purified as described in “Materials and methods”, of diploid strain RS112 of S. cerevisiae expressing (+cN-II) or not (CTR) cN-II; C. immunoblot analysis for cN-II of proteic extracts of diploid strain RS112 of S. cerevisiae carrying pYES2 (RS112 pYES2; lane 2, Ctr) or pYES2 _cN-II (RS112 pYES2_cN-II; lane 3, +cN-II) plasmid. Sts means “standards” (lane 1). Values are the mean of, at least, two independent experiments.
We tried, thus, to perform HPLC analysis of cellular content in order to verify this hypothesis. Very preliminary results seem to indicate an imbalance of all nucleotide pools in yeasts expressing cN-II: in particular, nucleoside triphosphate pools would have increased of about 30% in conparison with control.Anyway, further analysis have to be done to statistically validate these data.
107
Figure 2.1.2: Ade2 interchromosomal recombination and cell survival analysis of RS112 pYES2 and of RS112 pYES_cN-II yeasts for increasing concentration of MMS: the recovery of the HR by RS112 pYES2_cN-II yeasts is lower in comparison with the control, even if there are no changes in cell survival. Each experimental point was performed, at least, twice.
2.2 CN-II silencing in human cell lines
Gene silencing constitutes one of the most used technique to study the role of a protein of interest. For this reason and also for the scientific background demonstrating that cN-II silencing led ADF cells to apoptosis, we decided
to adopt RNA interference so as to conditional silence cN-II human cell lines (remember that cells or organs completely lacking cN-II activity have never been described!).
After having tuned an efficient PEI transfection method, we chose two different cell lines to be transduced, the human embryonic kidney 293T and the human astrocytoma ADF. We used the former to carry pilote experiments in order to evaluate the flexibility of our
Figure 2.2.1: A. and B. Bright field and wide-field fluorescence images of shCTR transduced 293T D8 after 24 hours of induction with 0.2 g/ml of doxycycline. C. and D. Bright field and wide-field fluorescence images of sh661 transduced 293T F3 after 24 hours of induction with 0.2 g/ml of doxycycline. The four pictures where taken at the same magnification (10x).
108 system and how it is regulated, while we studied the latter to examine what happens when cN-II is silenced in a quantitative manner.
As regards 293T expressing both the shCTR and the sh661, we isolated three genetically homogeneus populations grown from a single shCTR/sh661-GFP transduced cell (called D5, D7 and D8 for shCTR-293T and C9, E9 and F3 for sh661-293T). All the data presented (unless when specified) are obtained studying the populations D8 and F3 (figure 2.2.1).
Figure 2.2.2: A. Doxycycline responsiveness of the Tet-on system performed on the F3 293T cells (similar results were obtained with D8 293T cells, data not shown). In black, non-transduced 293T, in fuchsia non-induced F3 293T, in yellow F3 293T treated with 0.2 g/ml of doxycycline for 24 hours and in green 293T transduced with a virus derived from the transfection of the packaging cells with pLVTHM as transgene vector, in order to obtain a costitutive silencing system. B. Superposition of the single experiments, demonstrating the advantage of the conditional silencing system with respect to constitutive one.
109 After the demonstration of the inducibility of the system (figure 2.2.2), we showed the capability of this model to silence cN-II in a conditional manner. Whereas D8 293T cells, after 5 days from induction with different quantities of doxycycline, had no variation neither in enzyme activity nor in the presence of cN-II evaluated by immunoblot analysis in comparison with the control, F3 293T cells showed a decrease of enzyme activity of about 30% when treated for 5 days with 0.05 g/ml of the inducer (figure 2.2.3). This decrease was evident also by immunoblot analysis. Neverthless, cell viability seemed not to be affected by the abovementioned induction (figure 2.2.4).
Figure 2.2.3: A. CN-II phosphotransferase activity of crude extracts obtained from D8 293T (green) and F3 293T (red) induced for 5 days with different quantities of doxycycline (0, 0.01, 0.05 g/ml). In blue, non-transduced 293T (values are means of at least two measurements). B. Immunoblot analysis of the same extracts (40 g of protein were loaded on a 10% polyacrylamide gel for SDS-PAGE). -actin is used as reference gene.
Figure 2.2.4: Cell survival (MTT assay) of D8 293T (green) and F3 293T (red) induced for 5 days with different quantities of doxycycline. In blue, non-transduced 293T (values are means of at least six measurements). Similar results were obtained with D5/D7 and C3/E9 293T cells by using Trypan Blue (data not shown).
110 This results seem in contrast
with those obtained by Careddu and colleagues, who measured an increase of cell mortality up to 40% after 72 hours constitutive silencing in ADF. The explanation of this apparent contraddiction may be not only the different system used for the silencing, but also the fact that we didn’t obtained, with the concentration of doxycycline and the time of induction tested, levels of cN-II silencing as high as Careddu et al. (Careddu et al., 2011).
Having shown the effective silencing in 293T cells, we submitted the shCTR/sh661 transduced ADF cells to fluorescence-activated cell sorting (henceforth, we refer to them as shCTR ADF and sh661 ADF; figure 2.2.5; FACS was performed in the laboratory of Immunology directed by Professor Francesco Annunziato, University of Florence, Italy). Sorted cells were, then, induced with different quantities of doxycycline
Figure 2.2.5: A. and B. Bright field and wide-field fluorescence images of FACS sorted shCTR ADF after 24 hours of induction with 0.2 g/ml of doxycycline. C. and D. Bright field and wide-field fluorescence images of FACS sorted sh661 ADF after 24 hours of induction with 0.2 g/ml of doxycycline. The four pictures where taken at the same magnification (10x).
Figure 2.2.6: A. CN-II phosphotransferase activity of crude extracts obtained from FACS sorted shCTR ADF (green) and sh661 ADF (red) induced for 5 days with different quantities of doxycycline (0, 0.01, 0.05 g/ml). In blue, non-transduced ADF (values are means of at least two measurements). B. Immunoblot analysis of the same extracts (40 g of protein were loaded on a 10% polyacrylamide gel for SDS-PAGE). -actin is used as reference gene.
111 (figure 2.2.6). After 5 days of treatment with 0.05 g/ml of the inducer, sh661 ADF cells showed a decrease of about 32% of the enzyme activity in comparison with non-transduced cell, as demonstrated also by immunoblot analysis. Regarding shCTR ADF cells, no variations in cN-II expression were registered in comparison with non-transduced ADF.
Hence, in order to evaluate if a knockdown of cN-II affects cell viability, we induced shCTR and sh661 ADF cells with higher concentrations of doxycycline and for longer period (figures 2.2.7-2.2.11). During the induction, cells - after having been starved as described in “Materials and methods”- were maintained in a medium containing dialyzed FBS in order to remove a likely recovery by cN-II silenced cells due to the presence of nucleosides into the non-dialyzed FBS. In fact, there are evidences that mortality in cN-II silenced cells was partially rescued by the addition of inosine into the medium (Filoni et al., 2011).
6 hours from induction
Figure 2.2.7: A. Cell survival (MTT assay) of FACS sorted shCTR ADF (green) and sh661 ADF (red) induced for 6 hours with different quantities of doxycycline. In blue, non-transduced ADF (values are means of at least six measurements). B. Doxycycline responsiveness of the Tet-on system performed on FACS sorted shCTR ADF (green) and sh661 ADF (red) induced for 6 hours with different quantities of doxycycline (values are means of at least two measurements).
112
24 hours from induction
Figure 2.2.8: A. Cell survival (MTT assay) of FACS sorted shCTR ADF (green) and sh661 ADF (red) induced for 24 hours with different quantities of doxycycline. In blue, non-transduced ADF (values are means of at least six measurements). B. Doxycycline responsiveness of the Tet-on system performed on FACS sorted shCTR ADF (green) and sh661 ADF (red) induced for 24 hours with different quantities of doxycycline (values are means of at least two measurements).
Figure 2.2.9 (it follows in next page): A. Cell survival (MTT assay) of FACS sorted shCTR ADF (green) and sh661 ADF (red) induced for 48 hours with different quantities of doxycycline. In blue, non-transduced ADF (values are means of at least six measurements). B. Doxycycline responsiveness of the Tet-on system performed on FACS sorted shCTR ADF (green) and sh661 ADF (red) induced for 48 hours with different quantities of doxycycline (values are means of at least two measurements).
Figure 2.2.10 (it follows in next page): A. Cell survival (MTT assay) of FACS sorted shCTR ADF (green) and sh661 ADF (red) induced for 120 hours with different quantities of doxycycline. In blue, non-transduced ADF (values are means of at least six measurements). B. Doxycycline responsiveness of the Tet-on system performed on FACS sorted shCTR ADF (green) and sh661 ADF (red) induced for 120 hours with different quantities of doxycycline (values are means of at least two measurements).
113
48 hours from induction
114
142 hours from induction
Figure 2.2.11: A. Cell survival (MTT assay) of FACS sorted shCTR ADF (green) and sh661 ADF (red) induced for 142 hours with different quantities of doxycycline. In blue, non-transduced ADF (values are means of at least six measurements). Measuring the phosphotransferase activity after 142 hours from induction with 1.0 g/ml, we registered a decrease of about 36% in cell expressing sh661 in comparison with those carrying shCTR; this downturn is not much higher than that obtained after 120 hours from transduction, when no cell death was detected. This might be a proof of the importance of cN-II for cell survival: it seems as if cN-II expression could not be downregulated more than the 30-35% and that silencing that tries to carry the decrease of cN-II activity over that percentage is incompatible with cell life. B. Doxycycline responsiveness of the Tet-on system performed on FACS sorted shCTR ADF (green) and
FACS sorted sh661 ADF (red) induced for 142 hours with different quantities of doxycycline (values are means of at least two measurements).
As depicted in figure 2.2.11, after 142 hours from induction, sh661 ADF cells began to die: we measured a decrease of cell viability of 20% and of 30% when treating, respectively, with 0.1 g/ml and 1.0 g/ml of the inducer (read caption of figure 2.2.11 for speculations).
Therefore we investigated the death pathway the cells had undertaken: very preliminary results seems to underline the activation of initial caspases, but further investigation is strongly advisable. Using a GFP-certified apoptosis/necrosis detection kit, we were able to assess that cN-II silenced cells died by apoptosis (figure 2.2.12). This findings agreed with those of Careddu and colleagues, who didn’t find any changes neither in nucleotide and nucleoside intracellular pools nor in energy
115 charge. Very recently, however, it has been shown that cN-II silencing in cultured human myotubes caused a 2-fold increase in the AMP/ATP ratio (Kulkarni et al., 2011). To enlighten if cN-II
Figure 2.2.12: A., B. and C. Apoptotic ADF cells after 4 hours treatment with Staurosporine as indicated in the GFP-certified apoptosis/necrosis kit Enzo Life Sciences (positive control); D., E. and F. health ADF (negative control); G., H. and I. FACS sorted sh661 ADF induced for 142 hours with 1.0 g/ml of doxycycline; J., K. and L. FACS sorted shCTR ADF induced for 142 hours with 1.0 g/ml of doxycycline. Red cells are necrotic cells. All the pictures where taken at the same magnification (20x). At 100X magnification, using another fluorescence microscope, we registered also yellow cells, which means apoptotic cells at early stages; unfortunately we couldn’t took pictures.
116 silencing is, or not, correlated with an imbalance of nucleotide/nucleoside concentrations, we performed HPCE analysis on crude extract from cells treated with 1.0 g/ml of doxycycline for 142 hours. Very preliminary results indicate an alteration of nucleotide pools; experiments are in progress in order to statistically validate these data. It is important to specify that in the electropherograms of the crude extracts both from yeasts expressing cN-II and from sh661 transduced ADF cells there is an alteration of unidentified peaks in comparison with controls. We are waiting for mass spectrometry analysis to identify them.
Finally, this last experimental chapter we reported not only confirms the importance of cN-II for cell viability, but more, highlights - both with indirect and direct proofs (even if these latter data remain to be statistically validated) - the involvement of cN-II in the control of intracellular nucleotide levels.