Report by the Commission on the
Measurement of Economic
Performance and Social Progress
Professor Joseph E. S
TIGLITZ, Chair, Columbia University
Professor Amartya S
EN, Chair Adviser, Harvard University
Professor Jean-Paul F
ITOUSSI, Coordinator of the Commission, IEP
www.stiglitz-sen-fitoussi.fr
Rapporteurs
Anthony B. A
TKINSONWarden of Nuffield College
François B
OURGUIGNONSchool of Economics,
Jean-Philippe C
OTISInsee,
Angus S. D
EATONPrinceton University
Kemal D
ERVISUNPD
Marc F
LEURBAEYUniversité Paris 5
Nancy F
OLBREUniversity of Massachussets
Jean G
ADREYUniversité Lille
Enrico G
IOVANNINIOECD
Roger G
UESNERIECollège de France
James J. H
ECKMANChicago University
Geoffrey H
EALColumbia University
Claude H
ENRYSciences-Po/Columbia University
Daniel K
AHNEMANPrinceton University
Alan B. K
RUEGERPrinceton University
Andrew J. O
SWALDUniversity of Warwick
Robert D. P
UTNAMHarvard University
Nick S
TERNLondon School of Economics
Cass S
UNSTEINUniversity of Chicago
Philippe W
EILSciences Po
Jean-Etienne C
HAPRONGeneral Rapporteur
INSEE
Didier B
LANCHETINSEE
Jacques L
EC
ACHEUXOFCE
Marco M
IRAD’E
RCOLEOCDE
Pierre-Alain P
IONNIERINSEE
Laurence R
IOUXINSEE/CREST
Paul S
CHREYEROCDE
Xavier T
IMBEAUOFCE
EXECUTIVE SUMMARY
I. SHORT NARRATIVE ON THE CONTENT OF THE REPORT
Chapter 1: Classical GDP Issues . . . 21 Chapter 2: Quality of Life . . . 41 Chapter 3: Sustainable Development and Environment . . . 61
II. SUBSTANTIAL ARGUMENTS PRESENTED IN THE REPORT
Chapter 1: Classical GDP Issues . . . 85
Chapter 2: Quality of Life
. . . 143Chapter 3: Sustainable Development and Environment . . . 233
Why has this report been written?
1) In February 2008, the President of the French Republic, Nicholas Sarkozy, unsatisfied
with the present state of statistical information about the economy and the society, asked, Joseph Stiglitz (President of the Commission), Amartya Sen (Advisor) and Jean Paul Fitoussi (Coordinator) to create a Commission, subsequently called “The Commission on the Measurement of Economic Performance and Social Progress” (CMEPSP). The Commission’s aim has been to identify the limits of GDP as an indicator of economic performance and social progress, including the problems with its measurement; to consider what additional information might be required for the production of more relevant indicators of social progress; to assess the feasibility of alternative measurement tools, and to discuss how to present the statistical information in an appropriate way.
2) In effect, statistical indicators are important for designing and assessing policies aiming
at advancing the progress of society, as well as for assessing and influencing the functioning of economic markets. Their role has increased significantly over the last two decades. This reflects improvements in the level of education in the population, increases in the complexity of modern economies and the widespread use of information technology. In the “information society”, access to data, including statistical data, is much easier. More and more people look at statistics to be better informed or to make decisions. To respond to the growing demand for information, the supply of statistics has also increased considerably, covering new domains and phenomena.
3) What we measure affects what we do; and if our measurements are flawed, decisions may
be distorted. Choices between promoting GDP and protecting the environment may be false choices, once environmental degradation is appropriately included in our measurement of economic performance. So too, we often draw inferences about what are good policies by looking at what policies have promoted economic growth; but if our metrics of performance are flawed, so too may be the inferences that we draw.
4) However, there often seems to be a marked distance between standard measures of
important socio economic variables like economic growth, inflation, unemployment, etc. and widespread perceptions. The standard measures may suggest, for instance that there is less inflation or more growth than individuals perceive to be the case, and the gap is so large and so universal that it cannot be explained by reference to money illusion or to human psychology. In some countries, this gap has undermined confidence in official statistics (for example, in France and in the United Kingdom. only one third of citizens trust official figures, and these countries are not exceptions), with a clear impact on the way in which public discourse about the conditions of the economy and necessary policies takes place.
5) There may be several explanations for the gap between the statistical measurement of
– The statistical concepts may be correct, but the measurement process may be imperfect. – In many cases, there are debates about what are the right concepts, and the appropriate use of different concepts.
– When there are large changes in inequality (more generally a change in income distri-bution) gross domestic product (GDP) or any other aggregate computed per capita may not provide an accurate assessment of the situation in which most people find themsel-ves. If inequality increases enough relative to the increase in average per capital GDP, most people can be worse off even though average income is increasing
– The commonly used statistics may not be capturing some phenomena, which have an increasing impact on the well-being of citizens. For example, traffic jams may increase GDP as a result of the increased use of gasoline, but obviously not the quality of life. Moreover, if citizens are concerned about the quality of air, and air pollution is increasing, then statistical measures which ignore air pollution will provide an inaccurate estimate of what is happening to citizens’ well-being. Or a tendency to measure gradual change may be inadequate to capture risks of abrupt alterations in the environment such as climate change.
– The way in which statistical figures are reported or used may provide a distorted view of the trends of economic phenomena. For example, much emphasis is usually put on GDP although net national product (which takes into account the effect of depreciation), or real household income (which focuses on the real income of households within the economy) may be more relevant. These numbers may differ markedly. Then, GDP is not wrong as such, but wrongly used. What is needed is a better understanding of the appro-priate use of each measure.
6) Indeed, for a long time there have been concerns about the adequacy of current measures
of economic performance, in particular those solely based on GDP. Besides, there are even broader concerns about the relevance of these figures as measures of societal well-being. To focus specifically on the enhancement of inanimate objects of convenience (for example in the GNP or GDP which have been the focus of a myriad of economic studies of progress), could be ultimately justified – to the extent it could be – only through what these objects do to the human lives they can directly or indirectly influence. Moreover, it has long been clear that GDP is an inadequate metric to gauge well-being over time particularly in its economic, environmental, and social dimensions, some aspects of which are often referred to as sustainability.
Why is this report important?
7) Between the time that the Commission began working on this report and the completion
of this Report, the economic context has radically changed. We are now living one of the worst financial, economic and social crises in post-war history. The reforms in measurement recommended by the Commission would be highly desirable, even if we had not had the crisis. But some members of the Commission believe that the crisis provides heightened urgency to these reforms. They believe that one of the reasons why the crisis took many by surprise is that our measurement system failed us and/or market participants and government officials were not focusing on the right set of statistical
indicators. In their view, neither the private nor the public accounting systems were able to deliver an early warning, and did not alert us that the seemingly bright growth performance of the world economy between 2004 and 2007 may have been achieved at the expense of future growth. It is also clear that some of the performance was a “mirage”, profits that were based on prices that had been inflated by a bubble. It is perhaps going too far to hope that had we had a better measurement system, one that would have signalled problems ahead, so governments might have taken early measures to avoid or at least to mitigate the present turmoil. But perhaps had there been more awareness of the limitations of standard metrics, like GDP, there would have been less euphoria over economic performance in the years prior to the crisis; metrics which incorporated assessments of sustainability (e.g. increasing indebtedness) would have provided a more cautious view of economic performance. But many countries lack a timely and complete set of wealth accounts – the ‘balance sheets’ of the economy – that could give a comprehensive picture of assets, debts and liabilities of the main actors in the economy.
8) We are also facing a looming environmental crisis, especially associated with global
warming. Market prices are distorted by the fact that there is no charge imposed on carbon emissions; and no account is made of the cost of these emissions in standard national income accounts. Clearly, measures of economic performance that reflected these environmental costs might look markedly different from standard measures.
9) If the view expressed in the preceding paragraphs is not necessarily shared by all
members of the Commission, the whole Commission is convinced that the crisis is teaching us a very important lesson: those attempting to guide the economy and our societies are like pilots trying to steering a course without a reliable compass. The decisions they (and we as individual citizens) make depend on what we measure, how good our measurements are and how well our measures are understood. We are almost blind when the metrics on which action is based are ill-designed or when they are not well understood. For many purposes, we need better metrics. Fortunately, research in recent years has enabled us to improve our metrics, and it is time to incorporate in our measurement systems some of these advances. There is also consensus among the Commission members that better measures may enable us to steer our economies better through and out of crises. Many of the indicators put forward by the report will lend themselves to this purpose.
10) The report is about measurement rather than policies, thus it does not discuss how best our societies could advance through collective actions in the pursuit of various goals. However, as what we measure shapes what we collectively strive to pursue – and what we pursue determines what we measure - the report and its implementation may have a significant impact on the way in which our societies looks at themselves and, therefore, on the way in which policies are designed, implemented and assessed.
11) The Commission notes the important progress in statistical measurement that has occurred in recent years, and urges continued efforts to improve our statistical data base and the indicators that are constructed from this data base. The report indicates avenues for more or different measurement efforts in various domains, and we hope that it will influence future statistical policies in both developed and developing countries, as well as the work of international organisations that play a key role in the development of statistical standards worldwide.
By whom has the report been written?
12) This is a report written by economists and social scientists. The members of the Commission represent a broad range of specialisations, from national accounting to the economics of climate change. The members have conducted research on social capital, happiness, and health and mental well-being. They share the belief that it is important to build bridges between different communities – between the producers and users of statistical information, whatever their discipline – that have become increasingly distant in recent years. Commission members see their expertise as a complement to reports on similar topics that were written from a different perspective, for instance by scientists on climate change or by psychologists on mental health. Although the core of the report is rather technical, the summaries of the technical chapter have been written using, as much as possible, non-technical language.
To whom is the report addressed?
13) The Commission hopes that the Report will find a receptive audience among four distinct groups, and it has been written with that in mind. The Report is addressed, first of all, to political leaders. In this time of crises, when new political narratives are necessary to identify where our societies should go, the report advocates a shift of emphasis from a “production-oriented” measurement system to one focused on the well-being of current and future generations, i.e. toward broader measures of social progress.
14) Second, the report is aimed at reaching policy-makers who wish to get a better sense of which indicators are available and useful to design, implement and assess policies aimed at improving well-being and foster social progress. Policy-makers are reminded both of the richness and of the shortcomings of existing data but also of the fact that reliable quantitative information ‘does not grow on trees’ and significant investments need to be made to develop statistics and indicators that provide policymakers with the information they need to make the decisions confronting them.
15) Third, the report has been written for the academic community, statisticians, and intensive users of statistics. They are reminded of how difficult it can be to produce reliable data and of the numerous assumptions that underlay all statistical series. Academics will, hopefully, become more cautious in the confidence they place in certain statistics. Those in national statistical offices will, hopefully find helpful suggestions about areas where further developments might be particularly valuable.
16) Lastly, the report has been written for civil society organisations that are both users and producers of statistics. More generally, it is addressed to the public at large, whether from richer or poorer countries and whether rich or poor within societies. We hope that through a better understanding of the statistical data and indicators that are available (their strengths and limits), they can make a better assessment of the problems facing their societies. We hope the report will also serve journalists and the media who have a responsibility in enabling citizens to get a sense of what is happening in the society in which they are living. Information is a public good; the more we are informed about what is happening in our society, the better will our democracies be able to function.
What are the main messages and recommendations?
17) The report distinguishes between an assessment of current well-being and an assessment of sustainability, whether this can last over time. Current well-being has to do with both economic resources, such as income, and with non-economic aspects of peoples’ life (what they do and what they can do, how they feel, and the natural environment they live in). Whether these levels of well-being can be sustained over time depends on whether stocks of capital that matter for our lives (natural, physical, human, social) are passed on to future generations.
To organise its work, the Commission organized itself into three working groups,
focusing respectively on: Classical GDP issues, Quality of life and Sustainability. The
following main messages and recommendations arise from the report Towards better measures of economic performance in a complex economy
18) Before going beyond GDP and tackling the more difficult task of measuring well-being, it is worth asking where existing measures of economic performance need improving. Measuring production – a variable which among other things determines the level of employment – is essential for the monitoring of economic activity. The first main message of our report is that time has come to adapt our system of measurement of economic activity to better reflect the structural changes which have characterized the evolution of modern economies. In effect, the growing share of services and the production of increasingly complex products make the measurement of output and economic performance more difficult than in the past. There are now many products whose quality is complex, multi-dimensional and subject to rapid change. This is obvious for goods, like cars, computers, washing machines and the like, but is even truer for services, such as medical services, educational services, information and communication technologies, research activities and financial services. In some countries and some sectors, increasing “output” is more a matter of an increase in the quality of goods produced and consumed than in the quantity. Capturing quality change is a tremendous challenge, yet this is vital to measuring real income and real consumption, some of the key determinants of people’s material well-being. Under-estimating quality improvements is equivalent to over-estimating the rate of inflation, and therefore to under-estimating real income. The opposite is true when quality improvements are over-stated.
19) Governments play an important part in today’s economies. They provide services of a “collective” nature, such as security, and of a more “individual” nature, such as medical services and education. The mix between private and public provision of individual services varies significantly across countries and over time. Beyond the contribution of collective services to citizens’ living standards, individual services, particularly education, medical services, public housing or public sports facilities, are almost certainly valued positively by citizens. These services tend to be large in scale, and have increased considerably since World War II, but, in many cases, they remain badly measured. Traditionally, measures have been based on the inputs used to produce these services (such as the number of doctors) rather than on the actual outputs produced (such as the number of particular medical treatments). Making adjustments for quality changes is even more difficult. Because outputs are taken to move in tandem with inputs
productivity change in the provision of these services is ignored. It follows that if there is positive (negative) productivity change in the public sector, our measures under (over)-estimate economic growth and real income. For a satisfactory measure of economic performance and living standards it is thus important to come to grips with measuring government output. (In our present, admittedly flawed, system of measurement based on expenditures, government output represents around 20% of GDP in many OECD countries and total government expenditure more than 40% for the OECD countries.) 20) While there are methodological disagreements about how to make the adjustments to
quality or how to go about measuring government output, there is a broad consensus that adjustments should be made, and even about the principles which should guide such adjustments. The disagreements arise in the practical implementation of these principles. The Commission has addressed both the principles and the difficulties in implementations, in its Report.
From production to well-being
21) Another key message, and unifying theme of the report, is that the time is ripe for our measurement system to shift emphasis from measuring economic production to
measuring people’s well-being. And measures of well-being should be put in a context of
sustainability. Despite deficiencies in our measures of production, we know much more about them than about well-being. Changing emphasis does not mean dismissing GDP and production measures. They emerged from concerns about market production and employment; they continue to provide answers to many important questions such as monitoring economic activity. But emphasising well-being is important because there appears to be an increasing gap between the information contained in aggregate GDP data and what counts for common people’s well-being. This means working towards the development of a statistical system that complements measures of market activity by measures centred on people’s well-being and by measures that capture sustainability. Such a system must, of necessity, be plural – because no single measure can summarize something as complex as the well-being of the members of society, our system of measurement must encompass a range of different measures. The issue of aggregation across dimensions (that is to say, how we add up, for example, a measure of health with a measure of consumption of conventional goods), while important, is subordinate to the establishment of a broad statistical system that captures as many of the relevant dimensions as possible. Such a system should not just measure average levels of well-being within a given community, and how they change over time, but also document the diversity of peoples’ experiences and the linkages across various dimensions of people’s life. There are several dimensions to well-being but a good place to start is the measurement of material well-being or living standards.
Recommendation 1: When evaluating material well-being, look at income and consumption rather than production
22) GDP is the most widely-used measure of economic activity. There are international standards for its calculation, and much thought has gone into its statistical and conceptual bases. Earlier paragraphs have emphasized some of the important areas where more progress is needed in its computation. As statisticians and economists know very well, GDP mainly measures market production – expressed in money units – and as such it is
useful. However, it has often been treated as if it were a measure of economic well-being. Conflating the two can lead to misleading indications about how well-off people are and entail the wrong policy decisions. Material living standards are more closely associated with measures of net national income, real household income and consumption – production can expand while income decreases or vice versa when account is taken of depreciation, income flows into and out of a country, and differences between the prices of output and the prices of consumer products.
Recommendation 2: Emphasise the household perspective
23) While it is informative to track the performance of economies as a whole, trends in citizens’ material living standards are better followed through measures of household income and consumption. Indeed, the available national accounts data shows that in a number of OECD countries real household income has grown quite differently from real GDP per capita, and typically at a lower rate. The household perspective entails taking account of payments between sectors, such as taxes going to government, social benefits coming from government, and interest payments on household loans going to financial corporations. Properly defined, household income and consumption should also reflect in-kind services provided by government, such as subsidized health care and educational services. A major effort of statistical reconciliation will also be required to understand why certain measures such as household income can move differently depending on the underlying statistical source.
Recommendation 3: Consider income and consumption jointly with wealth
24) Income and consumption are crucial for assessing living standards, but in the end they can only be gauged in conjunction with information on wealth. A household that spends its wealth on consumption goods increases its current well-being but at the expense of its future well-being. The consequences of such behavior would be captured in a household’s balance sheet, and the same holds for other sectors of the economy, and for the economy as a whole. To construct balance sheets, we need comprehensive accounts of assets and liabilities. Balance sheets for countries are not novel in concept, but their availability is still limited and their construction should be promoted. Measures of wealth are central to measuring sustainability. What is carried over into the future necessarily has to be expressed as stocks – of physical, natural, human and social capital. The right valuation of these stocks plays a crucial role, and is often problematic. There is also a need to “stress test” balance sheets with alternative valuations when market prices for assets are not available or are subject to bubbles and bursts. Some more direct non-monetary indicators may be preferable when the non-monetary valuation is very uncertain or difficult to derive.
Recommendation 4: Give more prominence to the distribution of income, consumption and wealth
25) Average income, consumption and wealth are meaningful statistics, but they do not tell the whole story about living standards. For example, a rise in average income could be unequally shared across groups, leaving some households relatively worse-off than others. Thus, average measures of income, consumption and wealth should be accompanied by indicators that reflect their distribution. Median consumption (income,
wealth) provides a better measure of what is happening to the “typical” individual or household than average consumption (income or wealth). But for many purposes, it is also important to know what is happening at the bottom of the income/wealth distribution (captured in poverty statistics), or at the top. Ideally, such information should not come in isolation but be linked, i.e. one would like information about how well-off households are with regard to different dimensions of material living standards: income, consumption and wealth. After all, a low-income household with above-average wealth is not necessarily worse-off than a medium-income household with no wealth. (The desirability of providing information on the “joint distribution” of the dimensions of people’s well-being will be raised once again in the recommendations below on how to measure quality of life.)
Recommendation 5: Broaden income measures to non-market activities
26) There have been major changes in how households and society function. For example, many of the services people received from other family members in the past are now purchased on the market. This shift translates into a rise in income as measured in the national accounts and may give a false impression of a change in living standards, while it merely reflects a shift from non-market to market provision of services. Many services that households produce for themselves are not recognized in official income and production measures, yet they constitute an important aspect of economic activity. While their exclusion from official measures reflects uncertainty about data more than conceptual difficulties, there has been progress in this arena; still, more and more systematic work in this area should be undertaken. This should start with information on how people spend their time that is comparable both over the years and across countries. Comprehensive and periodic accounts of household activity as satellites to the core national accounts should complement the picture. In developing countries, the production of goods (for instance food or shelter) by households plays an important role. Tracking the production of such home-produced goods is important to assess consumption levels of households in these countries.
27) Once one starts focusing on non-market activities, the question of leisure arises. Consuming the same bundle of goods and services but working for 1500 hours a year instead of 2000 hours a year implies an increase in one’s standard of living. Although valuation of leisure is fraught with difficulties, comparisons of living standards over time or across countries needs to take into account the amount of leisure that people enjoy.
Well-being is multi-dimensional
28) To define what well-being means a multidimensional definition has to be used. Based on academic research and a number of concrete initiatives developed around the world, the Commission has identified the following key dimension that should be taken into account. At least in principle, these dimensions should be considered simultaneously:
i. Material living standards (income, consumption and wealth);
ii. Health;
iii. Education;
iv. Personal activities including work
vi. Social connections and relationships;
vii. Environment (present and future conditions);
viii. Insecurity, of an economic as well as a physical nature.
All these dimensions shape people’s well-being, and yet many of them are missed by conven-tional income measures.
Objective and subjective dimensions of well-being are both important
Recommendation 6: Quality of life depends on people’s objective conditions and capabilities. Steps should be taken to improve measures of people’s health, education, personal activities and environmental conditions. In particular, substantial effort should be devoted to developing and implementing robust, reliable measures of social connections, political voice, and insecurity that can be shown to predict life satisfaction.
29) The information relevant to valuing quality of life goes beyond people’s self-reports and perceptions to include measures of their “functionings” and freedoms. In effect, what really matters are the capabilities of people, that is, the extent of their opportunity set and of their freedom to choose among this set, the life they value. The choice of relevant functionings and capabilities for any quality of life measure is a value judgment, rather than a technical exercise. But while the precise list of the features affecting quality of life inevitably rests on value judgments, there is a consensus that quality of life depends on people’s health and education, their everyday activities (which include the right to a decent job and housing), their participation in the political process, the social and natural environment in which they live, and the factors shaping their personal and economic security. Measuring all these features requires both objective and subjective data. The challenge in all these fields is to improve upon what has already been achieved, to identify gaps in available information, and to invest in statistical capacity in areas (such as time-use) where available indicators remain deficient.
Recommendation 7: Quality-of-life indicators in all the dimensions covered should assess inequalities in a comprehensive way
30) Inequalities in human conditions are integral to any assessment of quality of life across countries and the way that it is developing over time. Most dimensions of quality-of-life require appropriate separate measures of inequality, but, as noted in par. 25, taking into account linkages and correlations. Inequalities in quality of life should be assessed across people, socio-economic groups, gender and generations, with special attention to inequalities that have arisen more recently, such as those linked to immigration.
Recommendation 8: Surveys should be designed to assess the links between various quality-of-life domains for each person, and this information should be used when designing policies in various fields
31) It is critical to address questions about how developments in one domain of quality of life affect other domains, and how developments in all the various fields are related to income. This is important because the consequences for quality of life of having multiple disadvantages far exceed the sum of their individual effects. Developing measures of
these cumulative effects requires information on the “joint distribution” of the most salient features of quality of life across everyone in a country through dedicated surveys. Steps in this direction could also be taken by including in all surveys some standard questions that allow classifying respondents based on a limited set of characteristics. When designing policies in specific fields, impacts on indicators pertaining to different quality-of-life dimensions should be considered jointly, to address the interactions between dimensions and the needs of people who are disadvantaged in several domains
Recommendation 9: Statistical offices should provide the information needed to aggregate across quality-of-life dimensions, allowing the construction of different indexes.
32) While assessing quality-of-life requires a plurality of indicators, there are strong demands to develop a single summary measure. Several summary measures of quality of life are possible, depending on the question addressed and the approach taken. Some of these measures are already being used, such as average levels of life-satisfaction for a country as a whole, or composite indices that aggregate averages across objective domains, such as the Human Development Index. Others could be implemented if national statistical systems made the necessary investment to provide the data required for their computation. These include measures of the proportion of one’s time in which the strongest reported feeling is a negative one, measures based on counting the occurrence and severity of various objective features of people’s lives, and (equivalent-income) measures based on people’s states and preferences.
33) The Commission believes that in addition to objective indicators of well-being, subjective measures of the quality-of-life should be considered.
Recommendation 10: Measures of both objective and subjective well-being provide key information about people’s quality of life. Statistical offices should incorporate questions to capture people’s life evaluations, hedonic experiences and priorities in their own survey.
34) Research has shown that it is possible to collect meaningful and reliable data on subjective as well as objective well-being. Subjective well-being encompasses different aspects (cognitive evaluations of one’s life, happiness, satisfaction, positive emotions such as joy and pride, and negative emotions such as pain and worry): each of them should be measured separately to derive a more comprehensive appreciation of people’s lives. Quantitative measures of these subjective aspects hold the promise of delivering not just a good measure of quality of life per se, but also a better understanding of its determinants, reaching beyond people’s income and material conditions. Despite the persistence of many unresolved issues, these subjective measures provide important information about quality of life. Because of this, the types of question that have proved their value within small-scale and unofficial surveys should be included in larger-scale surveys undertaken by official statistical offices.
Use a pragmatic approach towards measuring sustainability
35) Measuring and assessing sustainability has been a central concern of the Commission. Sustainability poses the challenge of determining if at least the current level of well-being can be maintained for future generations. By its very nature, sustainability involves the future and its assessment involves many assumptions and normative choices. This is
further complicated by the fact that at least some aspects of environmental sustainability (notably climate change) is affected by interactions between the socio-economic and environmental models followed by different countries. The issue is indeed complex, more complex than the already complicated issue of measuring current well-being or performance.
Recommendation 11: Sustainability assessment requires a well-identified dashboard of indicators. The distinctive feature of the components of this dashboard should be that they are interpretable as variations of some underlying “stocks”. A monetary index of sustainability has its place in such a dashboard but, under the current state of the art, it should remain essentially focused on economic aspects of sustainability.
36) The assessment of sustainability is complementary to the question of current well-being or economic performance, and must be examined separately. This may sound trivial and yet it deserves emphasis, because some existing approaches fail to adopt this principle, leading to potentially confusing messages. For instance, confusion may arise when one tries to combine current well-being and sustainability into a single indicator. To take an analogy, when driving a car, a meter that added up in one single number the current speed of the vehicle and the remaining level of gasoline would not be of any help to the driver. Both pieces of information are critical and need to be displayed in distinct, clearly visible areas of the dashboard.
37) At a minimum, in order to measure sustainability, what we need are indicators that inform us about the change in the quantities of the different factors that matter for future well-being. Put differently, sustainability requires the simultaneous preservation or increase in several “stocks”: quantities and qualities of natural resources, and of human, social and physical capital.
38) There are two versions to the stock approach to sustainability. One version just looks at variations in each stock separately, assessing whether the stock is increase or decreasing, with a view particularly to doing whatever is necessary to keep each above some critical threshold. The second version converts all these assets into a monetary equivalent, thereby implicitly assuming substitutability between different types of capital, so that a decrease in, say, natural capital might be offset by a sufficient increase in physical capital (appropriately weighted). Such an approach has significant potential, but also several limitations, the most important being the absence of many markets on which valuation of assets could be based. Even when there are market values, there is no guarantee that they adequately reflect how the different assets matter for future well-being. The monetary approach requires imputations and modelling which raise informational difficulties. All this suggests starting with a more modest approach, i.e. focusing the monetary aggregation on items for which reasonable valuation techniques exist, such as physical capital, human capital and certain natural resources. In so doing, it should be possible to assess the “economic” component of sustainability, that is, whether or not countries are over-consuming their economic wealth.
Physical indicators for environmental pressures
Recommendation 12: The environmental aspects of sustainability deserve a separate follow-up based on a well-chosen set of physical indicators. In particular there is a need for a clear
indicator of our proximity to dangerous levels of environmental damage (such as associated with climate change or the depletion of fishing stocks.)
39) For the reasons mentioned above, placing a monetary value on the natural environment is often difficult and separate sets of physical indicators will be needed to monitor the state of the environment. This is in particular the case when it comes to irreversible and/or discontinuous alterations to the environment. For that reason members of the Commission believe in particular that there is a need for a clear indicator of increases in atmospheric concentrations of greenhouse gases associated with proximity to dangerous levels of climate change (or levels of emissions that might reasonably be expected to lead to such concentrations in the future. Climate change (due to increases in atmospheric concentrations of greenhouse gases) is also special in that it constitutes a truly global issue that cannot be measured with regard to national boundaries. Physical indicators of this kind can only be identified with the help of the scientific community. Fortunately, a good deal of work has already been undertaken in this field.
What is next?
40) The Commission regards its report as opening a discussion rather than closing it. The report hints at issues that ought to be addressed in the context of more comprehensive research efforts. Other bodies, at the national and international level, should discuss the recommendations in this report, identify their limits, and see how best they can contribute to this broad agenda, each from its own perspective.
41) The Commission believes that a global debate around the issues and recommendations raised in this report provides an important venue for a discussion of societal values, for what we, as a society, care about, and whether we are really striving for what is important 42) At the national level, round-tables should be established, with the involvement of stakeholders, to identify and prioritise those indicators that carry to potential for a shared view of how social progress is happening and how it can be sustained over time.
43) The Commission hopes that this Report will provide the impetus not only for this broader discussion, but for on-going research into the development of better metrics that will enable us to assess better economic performance and social progress.
the Content of the Report
C
HAPTER
1 : C
LASSICAL
GDP
ISSUES
C
HAPTER
2 : Q
UALITY
OF
LIFE
1 - Introduction
1. Gross domestic product (GDP) is the most widely used measure of economic activity.
There are international standards for its calculation, and much thought has gone into its statistical and conceptual bases. But GDP mainly measures market production, though it has often been treated as if it were a measure of economic well-being. Conflating the two can lead to misleading indications about how well-off people are and entail the wrong policy decisions.
2. One reason why money measures of economic performance and living standards have
come to play such an important role in our societies is that the monetary valuation of goods and services makes it easy to add up quantities of a very different nature. When we know the prices of apple juice and DVD players, we can add up their values and make statements about production and consumption in a single figure. But market prices are more than an accounting device. Economic theory tells us that when markets are functioning properly, the ratio of one market price to another is reflective of the relative appreciation of the two products by those who purchase them. Moreover, GDP captures all final goods in the economy, whether they are consumed by households, firms or government. Valuing them with their prices would thus seem to be a good way of capturing, in a single number, how well-off society is at a particular moment. Furthermore, keeping prices unchanged while observing how quantities of goods and services that enter GDP move over time would seem like a reasonable way of making a statement about how society’s living standards are evolving in real terms.
3. As it turns out, things are more complicated. First, prices may not exist for some goods
and services (if for instance government provides free health insurance or if households are engaged in child care), raising the question of how these services should be valued. Second, even where there are market prices, they may deviate from society’s underlying valuation. In particular, when the consumption or production of particular products affects society as a whole, the price that individuals pay for those products will differ from their value to society at large. Environmental damage caused by production or consumption activities that is not reflected in market prices is a well-known example.
4. There is yet another problem. While talking about the concepts of “prices” and
“quantities” might be straightforward, defining and measuring how they change in practice is an altogether different matter. As it happens, many products change over time – they disappear entirely or new features are added to them. Quality change can be very rapid in areas like information and communication technologies. There are also products whose quality is complex, multi-dimensional and hard to measure, such as medical services, educational services, research activities and financial services. Difficulties also arise in 1. Evidence and references in support of the claims presented in this Summary are presented in a companion technical report.
collecting data in an era when an increasing fraction of sales take place over the internet and at sales as well as discount stores. As a consequence, capturing quality change correctly is a tremendous challenge for statisticians, yet this is vital to measuring real income and real consumption, some of the key determinants of people’s well-being. Under-estimating quality improvements is equivalent to over-estimating the rate of inflation, and therefore to under-estimating real income. For instance, in the mid-1990s, a report reviewing the measurement of inflation in the United States (Boskin Commission Report) estimated that insufficient accounting for quality improvements in goods and services had led to an annual over-estimation of inflation by 0.6%. This led to a series of changes to the US consumer price index.
5. The debate in Europe has tended to go the opposite way: official price statistics have
been criticized for under-estimating inflation. This has been partly because people’s perception of inflation differs from the national averages presented in the consumer price index, and also because it is felt that statisticians over-adjust for quality improvements in products, thereby painting too rosy a picture of citizens’ real income.
6. For market prices to be reflective of consumer’s appreciation of goods and services, it
is also necessary that consumers are free to choose and that they dispose of the relevant information. It takes little imagination to argue that this is not always the case. Complex financial products are an example where consumer ignorance prevents market prices from playing their role as carriers of correct economic signals. The complex and ever-changing bundles of services offered by telecommunications companies are another case in point where it is difficult to ensure the transparency and comparability of price signals.
7. All the above considerations imply that price signals have to be interpreted with care in
temporal and spatial comparisons. For a number of purposes, they do not provide a useful vehicle for the aggregation of quantities. This does not imply that the use of market prices in constructing measures of economic performance is generally flawed. But it does suggest prudence, in particular with regard to the often over-emphasized measure, GDP.
8. This Chapter suggests five ways of dealing with some of the deficiencies of GDP as an
indicator of living standards. First, emphasize well-established indicators other than GDP in the national accounts. Second, improve the empirical measurement of key production activities, in particular the provision of health and education services. Third, bring out the household perspective, which is most pertinent for considerations of living standards. Fourth, add information about the distribution of income, consumption and wealth to data on the average evolution of these elements. Finally, widen the scope of what is being measured. In particular, a significant part of economic activity takes place outside markets and is often not reflected in established national accounts. However, when there are no markets, there are no market prices, and valuing such activities requires estimates (“imputations”). These are meaningful, but they come at a cost, and we shall discuss them before turning to the other proposals.
2 - Imputations – comprehensiveness versus comprehensibility
9. Imputations exist for two related reasons. The first is comprehensiveness. There are
productive activities and associated income flows (typically non-monetary) that take place outside the market sphere, and some of them have been incorporated into GDP. The single most important imputation is a consumption value for the services that home-owners derive
from living in their own dwellings. There is no market transaction and no payment takes place, but the national accounts treat this situation as if home-owners paid a rent to themselves. Most people would agree that if two persons receive the same money income but one of them lives in his/her own house while the other rents, they are not equally well-off – hence the imputation in order to better compare incomes over time or between countries. This brings us to the second reason for imputations, the invariance principle: the value of the main accounting aggregates should not depend on the institutional arrangements in a country. For example, if exactly the same medical services are provided in one case by the public sector and in another case by the private sector, overall measures of production should be unaffected by a switch between the two institutional settings. The main advantage of adhering to the invariance principle is better comparability over time and between countries. Therefore, for instance, measures of “adjusted disposable income” for households (see below) include an imputation for government services provided directly to citizens.
10. The imputations can be smaller or larger, depending on the country and on the national
accounts aggregate considered. In France and Finland, for example, the main imputations account for about one-third of adjusted household disposable income and for just over 20% in the United States. Thus, in the absence of imputations the living standards of French and Finnish households would be understated relative to the United States.
11. But imputations come at a price. One is data quality: imputed values tend to be less
reliable than observed values. Another is the effect of imputations on the comprehensibility of national accounts. Not all imputations are perceived as income-equivalent by people, and the result may be a discrepancy between changes in perceived income and changes in measured income. This problem is exacerbated when we widen the scope of economic activity to include other services that are not mediated by the market. Our estimates below for household work amount to around 30% of conventionally-measured GDP. Another 80% or so are added when leisure is valued as well. It is undesirable to have assumption-driven data so massively influencing overall aggregates.
12. There is no easy way out of the tension between comprehensiveness and
comprehensibility except to keep both elements of information available for users and to maintain a distinction between core and satellite accounts. A full set of household accounts, for example, may not be well placed in the core of national accounts aggregates. But a satellite account that comes up with a valuation of comprehensive forms of household production would represent a significant improvement.
3 - What can be done within the existing measurement framework?
3.1 - Emphasize national accounts aggregates other than GDP13. A first step towards mitigating some of the criticism of GDP as a measure of living
standards is to emphasize national accounts aggregates other than GDP, for example, by accounting for depreciation so as to deal with net rather than gross measures of economic activity.
14. Gross measures take no account of the depreciation of capital goods. If a large amount
of output produced has to be set aside to renew machines and other capital goods, society’s ability to consume is less than it would have been if only a small amount of set-aside were
needed. The reason that economists have relied more heavily on GDP than on net domestic product (NDP) is, in part, that depreciation is hard to estimate. When the structure of production remains the same, GDP and NDP move closely together. But in recent years, the structure of production has changed. Information technology (IT) assets have gained importance as capital goods. Computers and software have a shorter life expectancy than do steel mills. On those grounds, the discrepancy between GDP and NDP may be increasing, and by implication, volume NDP may be increasing less rapidly than GDP. For example, real GDP in the United States rose by about 3% per year during the period 1985-2007. Depreciation rose by 4.4% over the same period. As a consequence, real net national product grew at a somewhat slower rate than GDP.
15. Of greater concern for some countries is that standard depreciation measures have not
taken into account the degradation in quality of the natural environment. There have been various attempts to widen the scope of depreciation to reflect environmental degradation (or improvements, if such is the case), but without much success. The hurdle is the reliable measurement and monetary valuation of changes in environmental quality.
16. The case of natural resource depletion is slightly different – there is at least a market
price, even if it does not reflect environmental damage attributable to the use of the natural resource. Depletion could be captured by excluding the value of the natural resources harvested from the production value of sectors like mining and timber. Their production would then consist only in a pure extraction or logging activity, with a corresponding decrease in GDP. A second possibility would be to take resource depletion into account in depreciation measures. In this case, GDP would be unchanged, but NDP would be lower.
17. In a world of globalization, there may be large differences between the income of a
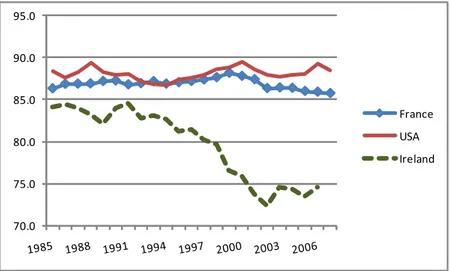
country’s citizens and measures of domestic production, but the former is clearly more relevant for measuring the well-being of citizens. We shall argue later that the household sector is particularly relevant for our considerations, and for households the income perspective is much more appropriate than measures of production. Some of the income generated by residents is sent abroad, and some residents receive income from abroad. These flows are captured by net national disposable income, a standard variable in national accounts. Figure 1.1 below shows how Ireland’s income declines relative to its GDP – a reflection of an increasing share of profits that are repatriated by foreign investors. While the profits are included in GDP, they do not enhance the spending power of the country’s citizens. For a poor developing country to be told that its GDP has gone up may be of little relevance. It wants to know whether its citizens are better-off, and national income measures are more relevant to this question than GDP.
Figure 1.1. Net national disposable income as percentage of gross domestic product
Source: OECD Annual National Accounts.
18. Moreover, the prices of imports evolve very differently from the prices of exports, and
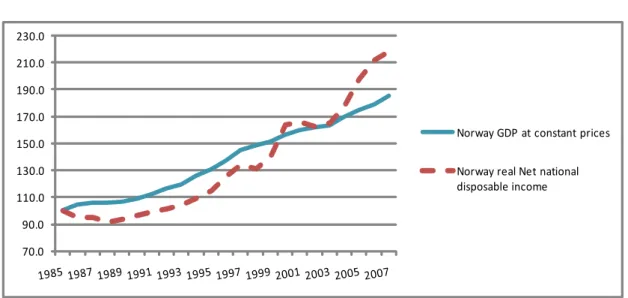
these changes in relative prices have to be taken into account in assessing living standards. The figure below shows the divergence between real income and production in Norway, an oil-rich OECD country whose income has risen faster than GDP in times of rising oil prices. In many developing countries, whose export prices have tended to fall relative to import prices, the opposite will be true.
Figure 1.2. GDP and disposable income in Norway
Source: OECD Annual National Accounts.
70.0 75.0 80.0 85.0 90.0 95.0 France USA Ireland 70.0 90.0 110.0 130.0 150.0 170.0 190.0 210.0 230.0 Norway GDP at constant prices Norway real Net national disposable income
3.2 - Improving the measurement of services in general
19. In today’s economies, services account for up to two-thirds of total production and
employment, yet measuring the prices and volumes of services is more difficult than for goods. Retail services are a case in point. In principle, numerous aspects should be taken into account in measuring the services provided: the volume of goods transacted but also the quality of service (accessibility of the shop, general service level of the staff, choice and presentation of products and so forth). It is difficult even to define these services, let alone to measure them. Statistical offices generally use data on the volume of sales as indicators for the volume of trade services. This method leaves aside most quality change in the trade services provided. What is true for retail holds for many other service industries, including those that are often publicly provided, such as health and education. A greater effort will be needed to come to grips with tracking the quantity and quality of services in modern economies.
3.3 - Improving the measurement of government-provided services in particular
20. Governments play an important part in today’s economies. Broadly speaking, they
provide two types of services – those of a “collective” nature, such as security, and those of an “individual” nature, such as medical services and education. This does not imply that government is necessarily the only provider of these services, and indeed, the mix between private and public provision of individual services varies significantly across countries. And while one can argue about the contribution of collective services to citizens’ living standards, individual services, particularly education, medical services and public sports facilities, are almost certainly valued positively by citizens. These services tend to be large in scale but badly measured. Traditionally, for government-provided non-market services, measures have been based on the inputs used to produce these services rather than on the actual outputs produced. An immediate consequence of this procedure is that productivity change for government-provided services is ignored, because outputs are taken to move at the same rhythm as inputs. It follows that if there is positive productivity growth in the public sector, our measures under-estimate growth.
21. Work has started in many countries to develop output measures for these
government-provided services that are independent of inputs, but the task is formidable. Take the following example: the United States spends more per capita on health care than many European countries, yet in terms of standard health indicators, outcomes are worse. Does this mean that Americans receive less health care? Or does it mean their health care is more expensive and/or delivered less efficiently? Or does it mean that health outcomes also depend on factors specific to American society other than health expenditure? We need to break down the change in health expenditure into a price and an output effect. But what exactly are the volumes of output that one is looking for? It is tempting to measure them by the population’s state of health. The problem is that the link between health care expenditure and health status is tenuous at best: expenditures relate to the resources that go into the institutions providing health services, whereas the health status of the population is driven by many factors – and the situation is much the same for education. For example, people’s lifestyles will affect health outcomes, and the time parents spend with their children will affect exam scores. Attributing changes in health or education status solely to hospitals or schools and the money spent on them neglects all these factors and can be misleading.
22. The quest is for more accurate measures of the volume growth of public services. A number of European countries as well as Australia and New Zealand have developed output-based measures for key government-provided services. One major challenge to these efforts is, once again, to capture quality change. Without a good measure of quality (or equivalently, a good estimate of increases in productivity), it is impossible to ascertain whether the conventional input measures underestimate or overestimate growth. If undifferentiated quantity measures are used, such as a simple number of students or of patients, changes in the composition and quality of the output may be missed. But one has to start somewhere and, because the numbers involved are important, the issue cannot be ignored, For example, with output-based measures, the U.K. economy grew at a rate of 2.75% per year between 1995 and 2003, whereas if the previous convention had continued to be used, the growth rate would have been 3% (Atkinson 2005). Similar effects could be observed in the case of France. A Danish study on the measurement of health output points the other way: output-based production of health services grew more rapidly than input-based production (Figure 1.3. Volume output of health services in Denmark).
23. An important criterion for the reliability of output-based measures is that they are based
on observations that are detailed enough to avoid mixing up true volume changes with compositional effects. We can ask how many students are educated, and simply count their numbers. If spending per student increases, one might conclude that the unit cost of educational services has increased. This may be misleading, however, if costs have gone up because students are taught in smaller classes or if there is a larger share of students that take up engineering studies, which are more costly. The measurement mistake arises because the simple number of students is too undifferentiated an output measure to be meaningful, so a more detailed structure is needed. It would help, for instance, to treat one hour taught to a graduate engineering student as a different product from one hour taught to a first-year arts student, and thus to account for some quality and compositional change. A similar reasoning applies for health care: the treatments of different diseases have to be considered as different medical services. As it turns out, the health-care systems of some countries do provide the administrative data needed to obtain this detailed information. We conclude that despite this being a daunting task, the better measurement of government-provided individual services is central to the better assessment of living standards. Exploiting new administrative data sources is one way of making progress in this direction. Ideally, the information would also capture service quality, for instance, the way patients are accommodated in hospitals or the time devoted to them by the medical staff, though such data may be hard to collect. In this case, new primary data sources such as surveys may be necessary.
Figure 1.3. Volume output of health services in Denmark
Source: Deveci, Heurlén and Sørensen (2008) “Non-Market Health Care Service in Denmark – Empirical
Studies of A, B and C Methods”; paper presented at the meeting of the International Association for Research on Income and Wealth, Slovenia.
24. Improving the volume measures of outputs does not dispense with the need to improve
– and publish – the volume measures of inputs. Only if both the outputs and inputs of service production are well captured will it be possible to estimate productivity change and undertake productivity comparisons across countries.
3.4 - Revisit the concept of “defensive” expenditures
25. Expenditures required to maintain consumption levels or the functioning of society
could be viewed as a sort of intermediate input – there is no direct benefit, and in this sense they do not give rise to a final good or service. Nordhaus and Tobin, in their seminal 1973 paper, for example, identify as “defensive” those activities that “are evidently not directly sources of utility themselves but are regrettably necessary inputs to activities that may yield utility”. In particular, they adjust income downwards for expenditures that arise as a consequence of urbanization and a complex modern life. Many such “defensive expenditures” are incurred by government, while others are incurred by the private sector. By way of example, expenditure on prisons could be considered a government-incurred defensive expenditure and the costs of commuting to work a privately-incurred defensive expenditure. A number of authors have suggested treating these expenditures as intermediate rather than final products. Consequently, they would not be part of GDP.
26. At the same time, difficulties abound when it comes to identifying which expenditures
are “defensive” and which are not. For instance, if a new park is opened, does this constitute defensive expenditure against the disamenties of urban life or is it a non-defensive recreational service? What are the possible ways forward? Some options include:
First, focus on household consumption rather than total final consumption. For many
purposes, the former is a more meaningful variable. And all of governments’ collective consumption expenditures (which would include things like prisons, military
100.0 102.0 104.0 106.0 108.0 110.0 112.0 114.0 116.0 2000 2001 2002 2003 2004 2005 Output‐based Input‐based
expenditure and the clean-up of oil spills) are automatically excluded from household final consumption.
Second, widen the asset boundary. In many cases, defensive expenditures include
elements of investment and capital goods. In those cases, they should be treated much like maintenance expenditures in the case of conventional production. For example, health expenditures could be seen as investment in human capital instead of as final consumption. If there is an asset that captures environmental quality, expenditures made to improve or maintain it could also be considered an investment. Conversely, the consequences of economic activity that is detrimental to this asset could be captured in an extended measure of depreciation or depletion so that the net measure of income or production is reduced accordingly. And net measures, it was argued earlier, should be our benchmark for living standards rather than gross measures.
Third, widen the household production boundary. Some “defensive” expenditures
cannot reasonably be treated as an investment. Take the case of commuting to work. Households produce transportation services – they use their time (labour input) and money (commuter ticket) for this purpose. With the exception of the consumer’s purchase of a ticket for a commuter train, which counts as final consumption, none of the above flows enter measures of production and income. This could be remedied by allowing for the household production of transportation services, which would be considered as an unpaid delivery of intermediate inputs to firms, “subsidized” by private households. Although this treatment would not change overall GDP, it would show a larger contribution to production by households and a smaller contribution by firms.
27. The biggest obstacle to these approaches lies in their implementation. How exactly
should the scope of defensive expenditures be determined? How should new assets and in-kind flows be valued? And, of course, widening the scope of asset and production measures brings with it more imputations.
3.5 - Income, wealth and consumption have to be considered together
28. Income flows are an important gauge for the standard of living, but in the end it is
consumption and consumption possibilities over time that matter. The time dimension brings in wealth. A income household with above-average wealth is better off than a low-income household without wealth. The existence of wealth is also one reason why low-income and consumption are not necessarily equal: for a given income, consumption can be raised by running down assets or by increasing debt, and consumption can be reduced by saving and adding to assets. For this reason, wealth is an important indicator of the sustainability of actual consumption.
29. The same holds for the economy as a whole. To construct the balance sheet of an
economy, we need to have comprehensive accounts of its assets (physical capital – and probably human, natural and social capital) and its liabilities (what is owed to other countries.) To know what is happening to the economy, we need to ascertain changes in wealth. In some instances, it may be easier to account for changes in wealth than to estimate the total value of wealth. Changes in wealth entail gross investments (in physical, natural, human and social capital) minus depreciation and depletion in those same assets.
30. Although information about some central aspects of household wealth is in principle available from national accounts balance sheets, it is often incomplete. Furthermore, certain assets are not recognized as such in the standard accounting framework, not least of all human capital. Studies that have computed monetary estimates of human capital stocks found that they account for an overwhelming part of all wealth (80% or more). A systematic measurement of human capital stock is of interest from a number of perspectives. It constitutes an integral part of an extended measure of household production (see below), and it is an input for the construction of sustainability indicators.
31. Note a fundamental problem with valuing stocks. When there are markets for assets, the
prices at which assets are bought and sold serve to value the stock as a whole. But there may be no markets for certain assets or no trading on the markets, as has recently been the case for certain financial assets. This raises the question of how to value them. And even when market prices do exist, transactions correspond only to a small fraction of the existing stock, and they may be so volatile as to put a question mark on the interpretability of balance sheets. That said, basic information on assets and liabilities is key to assessing the economic health of the various sectors and the financial risks to which they are exposed.
4 - Bringing out the household perspective
32. Income can be computed for private households as well as for the economy as a whole.
Some of citizens’ income is taken away in the form of taxes, and so is not at their disposal. But the government takes this money away for a reason: to provide public goods and services, to invest, for example, in infrastructure, and to transfer income to other (normally more needy) individuals. A commonly employed measure of household income adds and subtracts these transfer payments. The resulting measure is referred to as a measure of household disposable income. However, disposable income captures only monetary transfers between households and the government, thereby neglecting the in-kind services that government provides.
4.1 - Adjusting household income measures for government services in kind
33. Earlier in this text we mentioned the invariance principle, according to which a
movement of an activity from the public to the private sector, or vice versa, should not change our measure of performance, except to the extent that there is an effect on quality or access.
This is where a purely market-based measure of income meets its limits and where a measure that corrects for differences in institutional arrangements may be warranted for comparisons over time or across countries. Adjusted disposable income is a national accounts measure that goes some way towards accommodating the invariance principle, at least where “social transfers in kind” by government are concerned.
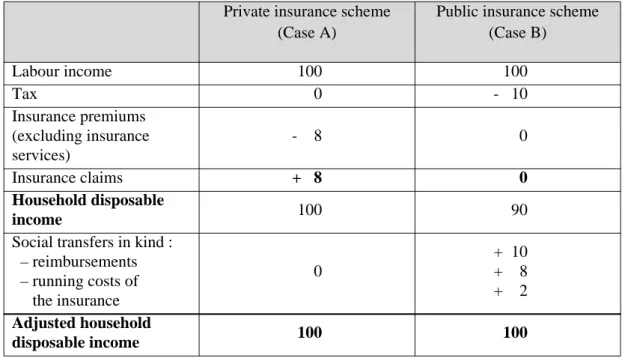
34. The meaning of adjusted disposable income is best explained by way of an example
(Table 1.1). Assume that a society’s labour income equals 100 and that individuals who are active in the labour market buy private health insurance. They make an annual payment for the insurance equal to 10, which can be decomposed into 8 units of insurance premiums (the actuarial value of a payment of 8) and 2 units of consumption of insurance services. At the same time, persons who are sick receive 8 units as reimbursement of their health expenditures. In this case – let us call it Case A – no taxes are paid and insurance claims and premiums offset each other, so that household disposable income equals 100. Now, assume