TSPO over-expression increases motility, transmigration and proliferation
properties of C6 rat glioma cells
Mariarosa Rechichi
a, Alessandra Salvetti
a, Beatrice Chelli
b, Barbara Costa
a, Eleonora Da Pozzo
b,
Francesca Spinetti
b, Annalisa Lena
a, Monica Evangelista
c, Giuseppe Rainaldi
c, Claudia Martini
b,
Vittorio Gremigni
a, Leonardo Rossi
a,⁎
aDipartimento di Morfologia Umana e Biologia Applicata, University of Pisa, Via Volta 4, 56126 Pisa, Italy
b
Dipartimento di Psichiatria, Farmacologia, Neurobiologia e Biotecnologie, University of Pisa, Via Bonanno Pisano 6, 56100 Pisa, Italy
c
Laboratorio di Terapia Genica e Molecolare, Istituto di Fisiologia Clinica, CNR, Via Moruzzi 1, 56100 Pisa, Italy Received 23 July 2007; received in revised form 9 November 2007; accepted 5 December 2007
Available online 15 December 2007
Abstract
Gliomas are one of the most malignant cancers. The molecular bases regulating the onset of such tumors are still poorly understood. The
translocator protein (TSPO), formerly known as the peripheral-type benzodiazepine receptor, is a mitochondrial permeability transition
(MPT)-pore protein robustly expressed in gliomas and involved in the regulation of apoptosis and cell proliferation. TSPO expression levels have been
correlated with tumor malignancy. Here we describe the production of C6 rat glioma cells engineered to over-express the TSPO protein with the
aim of providing the first direct evidence of a correlation between TSPO expression level and glioma cell aggressiveness. We observed that TSPO
potentiates proliferation, motility and transmigration capabilities as well as the ability to overcome contact-induced cell growth inhibition of
glioma cells. On the whole, these data demonstrate that TSPO density influences metastatic potential of glioma cells. Since several data suggest
that TSPO ligands may act as chemotherapeutic agents, in this paper we also demonstrate that TSPO ligand-induced cell death is dependent on
TSPO density. These findings suggest that the use of TSPO ligands as chemotherapeutic agents could be effective on aggressive tumor cells with a
high TSPO expression level.
© 2007 Elsevier B.V. All rights reserved.
Keywords: Peripheral-type benzodiazepine receptor; Glioma; Tumor invasiveness; Proliferation; Ligand-binding; Over-expression
1. Introduction
The translocator protein (18kDa) (TSPO), formerly known
as the peripheral-type benzodiazepine receptor (PBR)
[1]
, is an
abundant mitochondrial protein expressed in peripheral tissues,
as well as in astrocytes and microglial cells within the central
nervous system (CNS)
[2,3]
. Increased TSPO expression has
been observed in cancer, including brain tumors
[4–8]
. TSPO
has been implicated in many physio-pathological conditions
including apoptosis, microglial activation related to brain
damage, steroidogenesis, and cell proliferation
[9]
. In
mito-chondria, TSPO is associated with other proteins, including the
voltage-dependent anion channel (VDAC) and the adenine
nucleotide carrier (ANT), making up the mitochondrial
permeability transition (MPT)-pore
[10]
whose modulation
has been suggested as a critical event in the regulation of
processes underlying cellular survival/death
[2,10–12]
. It has
been demonstrated that specific TSPO ligands show
pro-apoptotic activity and may act, through the modulation of the
MTP-pore opening, as potential drugs useful in cancer therapy
[5,13
–17]
. Among tumors, gliomas represent an elective target
for TSPO ligand mediated chemotherapy; this protein being
virtually absent in the neurons and over-expressed in glioma
with respect to normal glial cells
[3,18–22]
.
It is interesting to note that TSPO expression level positively
correlates with cell malignancy in several tumors including
gliomas
[18,23–28]
. However, the role of TSPO up-regulation
in brain tumor cells is still puzzling. For these reasons over the
Biochimica et Biophysica Acta 1782 (2008) 118–125
www.elsevier.com/locate/bbadis
⁎ Corresponding author. Fax: +39 0502219101. E-mail address:[email protected](L. Rossi).
0925-4439/$ - see front matter © 2007 Elsevier B.V. All rights reserved. doi:10.1016/j.bbadis.2007.12.001
last years we have been focusing our attention on the study of
TSPO and TSPO ligand effects in glioma aggressiveness. Up to
now no studies have been performed by direct comparison of
brain tumor cells engineered to over-express TSPO with wild
type cells of the same cell line. Here, we describe the production
of glioma cells engineered to over-express the TSPO and
examine the relationship between TSPO up-regulation and
growth, motility, transmigration and susceptibility to the TSPO
ligand PK 11195-induced apoptosis of glioma cells.
2. Materials and methods
2.1. Cell cultures
Rat C6 glioma cells (a kind gift from Professor Damir Janigro, Cleveland Clinic Foundation, Cleveland, OH) were cultured as described in[15].
2.2. RNA isolation, reverse transcription-PCR, and cloning of rat
TSPO
Total RNA was extracted from 5 × 10⁶cells using the Nucleospin RNA II
kit (Macheray-Nagel) according to the manufacturer's instructions. For RT-PCR, about 1μg DNase-digested total RNA was reverse-transcribed using Superscript II reverse transcriptase (Invitrogen) following the recommenda-tions of the manufacturer. Full-length cDNA of TSPO was amplified using TSPO specific forward primer (5'CCCAAGCTTATGTCTCAATCCTGGG-TACC3') containing a restriction site for the endonuclease Hind III at the 5' end and a TSPO specific reverse primer (5'GCGAGGATCCAAAGCAG-GATGACCTCAACC3') containing a restriction site for the endonuclease BamH I at the 5' end. The conditions for PCR were as follows: 2min at 95°C, 30 cycles of 30s at 95°C, 1min at 55°C, and 30s at 72°C. A final extension was carried on at 72°C for 7min. The amplified fragment was Hind III and BamH I digested and then cloned into the vector pFLAG-cmv-2 (Sigma) in frame with a short flag epitope in the amino terminal position. After transformation in competent Escherichia coli cells, some clones were isolated and plasmid DNAs were sequenced by automated fluorescent cycle sequencing (ABI). One of these clones (TSPO-pFLAG-cmv-2) was used in the following applications.
2.3. Transfection
For transfection, 2μg of TSPO-pFLAG-cmv-2 or pFLAG-cmv-2 (control) were mixed with 10μL Lipofectamine 2000 reagent (Invitrogen) in 0.5mL of Optimem (Gibco). 90% confluent C6 glioma cells were transfected with the mixture and incubated for 6h according to the manufacturer's instructions. Then the transfection medium was replaced with complete medium and the cells were used for experiments.
2.4. Western blot analysis
Whole cell extracts of TSPO-pFLAG-cmv-2 or pFLAG-cmv-2 transfected C6 cells were used for Western blot analysis. 24, 48, 72 and 96h after transfection C6 cells were detached with 2mM EDTA, collected by centrifuga-tion (1000g for 5min) and lysed by adding 80μL of lysis buffer (1% Triton X100, 10% glycerol, 20mM Tris–HCl pH 7.5, 150mM NaCl, 10mM EDTA, 1mM phenylmethylsulphonyl fluoride (PMSF), 0.5μM aprotinin, 0.5μM leupeptin) for 30min on ice. Then samples were frozen–thawed for three times and centrifuged to collect the supernatants. Protein concentration was measured by using the Micro BCA protein assay kit (Pierce). 25μg of proteins were separated on a SDS-PAGE gel and electrotransferred onto a nitrocellulose membrane. After blocking with 5% non-fat dry milk (Biorad) in TPBS (50nM Tris, 150nM NaCl, 0.05% Tween 20) for 4h at room temperature, the FLAG-TSPO recombinant protein was detected by adding mouse anti-FLAG antibody (Sigma, 1:1000) in 3% non-fat dry milk in TPBS for 1h at room temperature. Filters were then washed in TPBS and incubated for 1h at room temperature with
1:100 000 dilution of POD-conjugated anti-mouse IgG antibody (Biorad). After several washes in TPBS, signal cross-hybridization was revealed by chemoluminescence using the Supersignal West Dura substrate (Pierce). To test that an equal amount of total proteins was loaded in each line, after FLAG-TSPO revelation, filters were stripped and re-probed with mouse anti-ERK antibody (Santa Cruz, 1:1000) and revealed as described above.
2.5. Radioligand binding assays
Membranes from transfected C6 glioma cells with TSPO-pFLAG-cmv-2 or pFLAG-cmv-2 (collected 24h after transfection) were prepared as previously described by Gorman et al. and Veenman et al. [28,29] with minor modifications. Briefly, confluent cells were washed with phosphate-buffered saline, harvested by scraping and collected by centrifugation at 1000×g for 10min at 4°C. Cell pellet was suspended in 5mM Tris–HCl buffer, pH 7.4 containing 160μg/ml benzamidine, 200μg/ml bacitracin and 20μg/ml trypsin inhibitor, homogenized using Ultraturrax homogenizer and centrifuged at 48 000×g for 15min at 4°C. Pellet was suspended in 50mM Tris–HCl buffer, pH 7.4 (assay buffer), homogenized and centrifuged at 48 000×g for 15min at 4°C. Protein content was estimated by the Bradford method[30]using the Bio-Rad Protein Assay reagent, according to the manufacturer's protocol, with bovine serum albumin (BSA) as standard.
[3H]PK 11195 (specific activity 69.9Ci/mmol) binding assays were
conducted incubating cell membranes (40μg of protein), with 0.5–26nM [3H]
PK 11195 in a final volume of 500μl of 50mM Tris/HCl, pH 7.4 buffer. Non-specific binding was determined in the presence of 1μM unlabelled PK 11195. Binding equilibrium was reached following a 90min incubation at 0°C. Samples were filtered rapidly under vacuum through GF/C glass fiber filters, and washed four times with 3ml of assay buffer. Finally, filters were placed in vials containing 4ml of scintillation liquid and bound radioactivity was measured by a scintillation counter (Tri-Carb 2800 TR, Perkin-Elmer).
Scatchard analyses of saturation binding data, graphic presentation and statistical analyses were performed using the non-linear multipurpose curve-fitting Graph-Pad Prism computer program (Graph Pad Software, version 4.0; San Diego, CA). In detail, for saturation binding experiments one-site binding curve-fitting was used.
2.6. Immunofluorescence microscopy
Approximately 2 × 10⁴TSPO-pFLAG-cmv-2 or pFLAG-cmv-2 transfected C6 cells were plated onto poly-D-lysine slides and incubated overnight. Cells were then fixed in paraformaldehyde (4%) for 30min at room temperature, washed in PBS and blocked in blocking solution (0.1% Triton X-100, 0,5% bovine serum albumin in PBS) for 30min. Then, cells were incubated for 1h at room temperature in blocking solution containing rabbit anti-FLAG antibody (Sigma, 1:100) and mouse anti-cytochrome c antibody (Santa Cruz, 1:50). After washing in PBST (0.1% Triton in PBS), cells were incubated for 1h at room temperature in blocking solution containing FITC-conjugate anti-rabbit secondary antibody, (1:200, Invitrogen) and rhodamine-conjugate anti-mouse secondary antibody (1:200, Santa Cruz). Slides were then mounted and analyzed under the Axioplan fluorescent microscope (Zeiss).
2.7. Cell proliferation assays
To determine the proliferation rate, the same number (4000 cells per well) of TSPO-pFLAG-cmv-2 or pFLAG-cmv-2 transfected C6 cells, were seeded in 24-well plates, immediately after transfection, and allowed to proliferate for 24, 48, 96h. Both attached and floating cells were taken for counting with a hemocytometer. We designed this experiment in way to maintain cells in the exponential phase of growth (not confluent) up to about 120h. For each cell line the experiment was performed on three independent transfections. The growth curves were confirmed repeating the entire experiment for three times. The number of TSPO-pFLAG-cmv-2 or pFLAG-cmv-2 transfected C6 cells was also evaluated after they had been confluent for 3days. For this last analysis, 90% confluent C6 glioma cells were transfected with TSPO-pFLAG-cmv-2 or pFLAG-cmv-2 vectors as described above. Three days after transfection the medium covering cells was collected, the adherent cells trypsinized, added to the
collected medium and counted with a hemocytometer. For each cell line the experiment was performed on ten independent transfections
To calculate the mitotic index of C6 cells over-expressing TSPO, 6-well plates containing 90% confluent C6 glioma cells were transfected with TSPO-pFLAG-cmv-2, TSPO-pFLAG-cmv-2, or pEGFP-C1 (a vector that drives the
expression of the Green Fluorescent Protein in the cytoplasm). Three independent transfections were performed for each vector. Six hours after transfection, cells of each well were detached and split into three 6-well plates (to reach 30% confluence) and allowed to proliferate for 24 and 72h.
Cells were then detached, collected by centrifugation and resuspended in 40μl of glycerol, acetic acid, PBS (1:1:13) solution containing 1× Hoechst. Two 5μl aliquots of cell suspension for each sample were spotted on a glass slide and allowed to dry. The number of mitotic figures was counted under the fluorescence microscope Axiovert 25 (Zeiss). Two 10μl aliquots for each sample were used to count the number of total cells with a hemocytometer. For each cell line the mitotic index [(mitotic figures/total cells) × 1000] was calculated in 9 replicate wells. Two independent experiments were performed.
2.8. Motility assay
Equal amounts of C6 cells were plated in 6-well plates (95% confluent), transfected with TSPO-pFLAG-cmv-2, pFLAG-cmv-2 or pEGFP-C1 and a scratch (to remove cells) was done along the diameter of all 6-well plates 6h after transfection. Photographs were taken immediately after scratching (T0) in three different points along the scratch. 20, 25, 40h after the scratch the same points were photographed at the same magnification to determine the colonization of the scratch. The scratch of each picture was measured by using the Adobe Photoshop ruler. The migration rate (cm/h) was calculated for each treatment considering the mean difference between the scratch width at T0 and at each time of analysis in the three photographed points. For each cell line the experiment was performed on six independent transfections.
2.9. Transmigration assay
Cell ability to transmigrate was assayed in modified Boyden chambers (Neuro Probe). 10% FBS in C6 growth medium supplemented with 0.1% BSA was placed in the lower chamber as source of chemoattractant. Polyvinylpyrro-lidone-free 8μm-pore polycarbonate filters were coated with 5mg/L porcine skin gelatin (Sigma) and placed between upper and lower chambers. TSPO-pFLAG-cmv-2 or pFLAG-TSPO-pFLAG-cmv-2 transfected C6 cells were trypsinized, resuspended in growth medium supplemented with 0.1% BSA and then placed in the upper chamber at a density of 2 × 10⁵cells for chamber. After 5h of incubation at 37°C in a humidified atmosphere, filters were fixed in absolute ethanol for 30s and stained with 2% toluidine blue (Sigma) for 10min at room temperature. Cells incapable of migrating were gently scraped from the upper side of the filter, while migrated cells were counted. Fifteen microscope fields (10×) for each filter were counted.
2.10. Cell viability analysis by MTS conversion assay
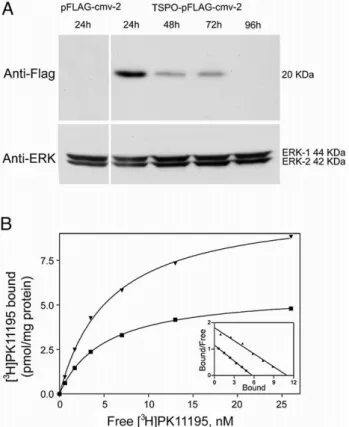
TSPO-pFLAG-cmv-2 or pFLAG-cmv-2 transfected C6 cells were seeded in 96-well plates at a density of 1 × 10⁴cells per well. The following day or 96h Fig. 1. TSPO-FLAG recombinant protein expression. (A) Western blot analysis
of TSPO-FLAG recombinant protein in TSPO-cmv-2 and pFLAG-cmv-2 transfected cells. The molecular weight is indicated on the right, anti-ERK has been used as loading control. (B) Saturation curves and Scatchard plots (inset) of specific [3H]PK 11195 binding to membranes of C6 glioma cells
transfected with TSPO-pFLAG-cmv-2 (▾) or with pFLAG-cmv-2 (
▪
). Membranes were incubated with increasing concentrations of [3H]PK 11195ranging from 0.5 to 26 nM. Non-specific binding was measured in the presence of 1μM PK 11195. Data are from a single experiment carried out in triplicate. For C6 glioma cells transfected with TSPO-cmv-2 or with pFLAG-cmv-2 the Kd values were, 6.0 and 5.0 nM and mean Bmax values were, 10.98 and 5.72 pmol/mg of protein, respectively.
Fig. 2. Assessment of the sub-cellular distribution of TSPO-FLAG recombinant protein in TSPO-pFLAG-cmv-2 transfected C6 cells by fluorescent microscopy. (A) Distribution of TSPO-FLAG recombinant protein as visualized by using anti-FLAG antibody. (B) Sub-cellular distribution of mitochondria as revealed by using anti-cytochrome c antibody. (C) Merged panels A and B show that in TSPO-pFLAG-cmv-2 transfected cell (arrow), TSPO-FLAG recombinant protein is expressed in the mitochondria.
after transfection, the culture medium was replaced with fresh medium supplemented with different PK 11195 concentrations (1–100μM). Each cell line has also been treated with the vehicle ethanol. Twentyfour hours after the treatment the number of living cells was measured by quantitative colorimetric MTS assay (Promega) using a microplate reader (Wallac Victor 2, 1420 Multilabel counter, Perkin-Elmer) as previously described by[15].
Each treatment was performed in duplicate and three independent experiments were performed.
Graphic presentation and data analysis were performed using the non-linear multipurpose curve-fitting Graph-Pad Prism computer program (Graph Pad Software, version 4.0; San Diego, CA).
3. Results
3.1. TSPO over-expression in C6 rat glioma cells
TSPO cDNA was isolated by RT-PCR using C6 total RNA as
template, and cloned in pFLAG-cmv-2 vector in frame with the
nucleotide sequence encoding the eight amino acid FLAG
peptide (at the N-terminus of TSPO). The cDNA sequence
isolated from C6 cell was identical to that deposited in DDBJ/
EMBL/GenBank under accession number NM_012515. To
assess the effectiveness of our expression system, the
expres-sion of the FLAG-tagged TSPO was initially monitored by
immunoblotting on whole extract of TSPO-pFLAG-cmv-2 or
pFLAG-cmv-2 cells obtained 24, 48, 72 and 96h after
transfection. Anti-FLAG antibody revealed the presence of a
cross-reactive band of the expected molecular weight (20kDa)
in TSPO-pFLAG-cmv-2 transfected samples. Interestingly, no
SDS and beta-mercaptoethanol resistant polymers were found
with anti-FLAG antibodies. The recombinant protein was
expressed at high level in samples collected 24h after
transfection and its expression was significantly reduced in
cell extracts collected 48 and 72h after transfection.
Recombi-nant protein was no longer detectable in the extracts collected
96h after transfection (
Fig. 1
A). No cross-reactive bands were
visible in whole extract obtained from pFLAG-cmv-2
trans-fected cells (control cells).
In order to verify if the introduction of the FLAG epitope at
the N-terminus of TSPO could modify the binding affinity for
the specific and selective TSPO ligand, PK 11195, homogenate
membranes of TSPO-pFLAG-cmv-2 transfected cells, collected
24h after transfection, were used for saturation studies of
specific [
3H]PK 11195 binding. Scatchard analysis of [
3H]PK
11195 binding saturation data revealed a single population of
binding sites with a dissociation constant (Kd)value of 5.0 +/−
0.52nM.C6 glioma cells transfected with TSPO-pFLAG-cmv-2
showed higher levels (about 2 folds) of [
3H]PK specific binding
sites than control cells (
Fig. 1
B).
We also analyzed the sub-cellular localization of
TSPO-pFLAG recombinant protein by immunofluorescence
micro-scopy. Anti-FLAG antibody revealed a cytoplasmic localization
of TSPO-FLAG protein that appeared accumulated in
well-defined sub-cellular structures (
Fig. 2
A). Co-localization
experiments performed by using anti-cytochrome c antibody
as a mitochondrial marker (
Fig. 2
B) revealed an exclusive
mitochondrial localization for TSPO-FLAG recombinant
pro-tein (
Fig. 2
).
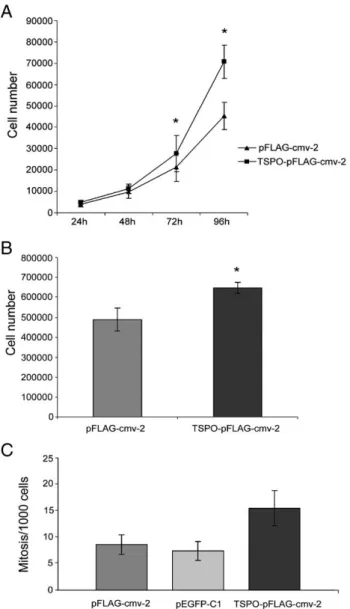
3.2. TSPO over-expression increases the proliferation
capabilities of C6 glioma cells
With the aim of analyzing the relationship between TSPO
expression level and cell growth (
Fig. 3
), we assessed
TSPO-pFLAG-cmv-2, pFLAG-cmv-2 or pEGFP-C1 transfected cell
mitotic index. As shown in
Fig. 3
C, TSPO-pFLAG-cmv-2
transfected cells showed a higher mitotic index then control
cells 1day after transfection. This difference became less
pronounced 3days after transfection when, according to
Western blot analysis, the expression of TSPO recombinant
protein is strongly reduced (data not shown). Further support for
Fig. 3. Assessment of TSPO transfected cell proliferation capabilities. (A) Cell proliferation curves of pFLAG-cmv-2 and TSPO-pFLAG-cmv-2 transfected cells. Each value is expressed as mean ± SD of three independent experiments done in triplicate. (*pb0.05, calculated by Student's t test). (B) Number of TSPO-pFLAG-cmv-2 or pFLAG-cmv-2 transfected C6 cells after they had been confluent for 3 days. Each value is expressed as mean ± SD of the cell number counted in ten independent transfections (*pb1×10− 5, calculated by Student's t test). (C) Mitotic index of pFLAG-cmv-2, pEGFP-C1 and TSPO-pFLAG-cmv-2 transfected cells 24 h after transfection. (*pb0.001, calculated by Student's t test between TSPO-pFLAG-cmv-2 and pFLAG-cmv-2).
TSPO positive influence on cell proliferation, derived from the
analysis of TSPO-pFLAG-cmv-2, pFLAG-cmv-2 or pEGFP-C1
transfected cell proliferation curves. As reported in
Fig. 3
A,
TSPO-pFLAG-cmv-2 transfected C6 cells have a higher
proliferation rate than control cells. Significant differences
appeared 72h after seeding (⁎p
b 0.05). Although this data could
appear in disagreement with the early effect of TSPO
up-regulation on mitosis, it has to be taken in mind that we
designed our experiments in way to maintain cells in the
exponential phase of growth up to about 120h. Thus, the
difference in cell number (also if small) that is produced by
TSPO over-expression during the first days is amplified in the
following days as long as one of the cell lines reaches the
confluence and reduces cell growth rate.
We also evaluated the ability of TSPO-pFLAG-cmv-2 or
pFLAG-cmv-2 transfected C6 cells to grow after having
reached the confluence to test TSPO influence on cell ability
to overcome contact-induced cell growth inhibition. As reported
in
Fig. 3
B the number of TSPO-pFLAG-cmv-2 transfected C6
cells was 25% higher (p
b 1 × 10
− 5) than that of control cells.
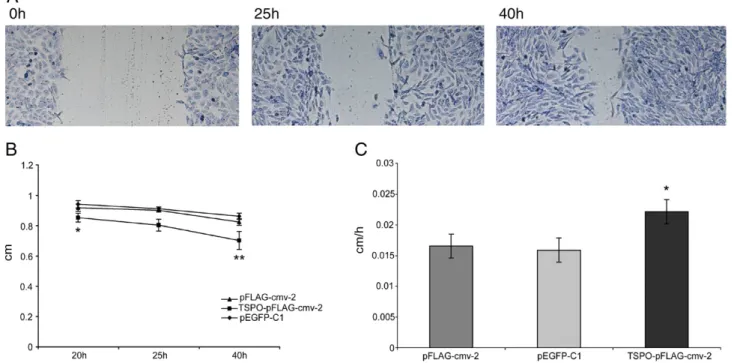
3.3. TSPO over-expression increases migration rate of C6
glioma cells
With the aim of analyzing the relationship between TSPO
expression level and cell migration capabilities, we assessed the
rate at which controls (pFLAG-cmv-2 and pEGFP-C1) or
TSPO-pFLAG-cmv-2 transfected cells recovered a scratch done on a
layer of confluent cells. Colonization of the scratch was monitored
20, 25 and 40h after the scratching. As reported in
Fig. 4
,
TSPO-pFLAG-cmv-2 transfected C6 cells reduced the clear area (
Fig. 4
A,B) and migrated into the scratch at a significantly higher rate
than that of controls cells (p
b 0.05) (
Fig. 4
C).
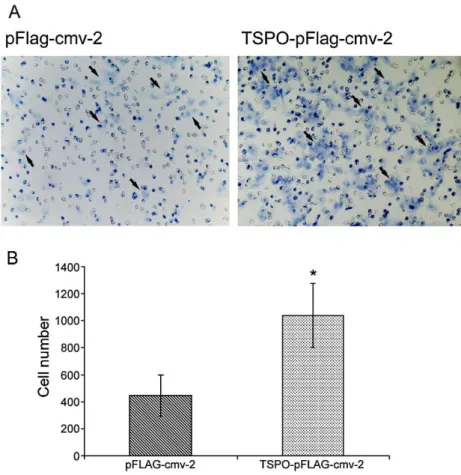
3.4. TSPO over-expression increases transmigration
capabilities of C6 glioma cells
One of the most important characteristics of aggressive
tumoral cells is the ability to penetrate anatomic barriers and
diffuse in cell matrix. Therefore, we assessed C6 tumor cell
transmigration across artificial barrier in vitro to evaluate tumor
cell invasion properties of TSPO-pFLAG-cmv-2 transfected
cells and control cells. We separated populations of cells able to
invade a gelatin layer and counted the number of cells that
reached the lower side of a polycarbonate filter. As reported in
Fig. 5
, the number of cells that more actively invade the gelatin
layer was significantly higher in TSPO-pFLAG-cmv-2
trans-fected C6 than control cells (p
b 0.05).
3.5. TSPO over-expression sensitizes C6 glioma cells to TSPO
specific ligand treatment
To assess whether the TSPO over-expression affects C6 cell
sensitivity to the pro-apoptotic activity of its specific ligand PK
11195, we evaluated cell viability of control and
TSPO-pFLAG-cmv-2 transfected cells following 24h exposure to micromolar
Fig. 4. Effect of TSPO over-expression on cell motility. (A) A representative example of TSPO-pFLAG-cmv-2 transfected C6 cells recovering the scratch surface. (B) Reduction of the scratch area 20, 25 and 40 h after scratching in pFLAG-cmv-2, pEGFP-C1 or TSPO-pFLAG-cmv-2 transfected cells. Mean values ± SD were obtained normalizing the scratch area at each time of analysis versus the scratch area measured immediately after scratching (⁎pb0.05, ⁎⁎pb0.01, calculated by Student's t test between TSPO-pFLAG-cmv-2 and pFLAG-cmv-2). (C) Migration rate (cm/h) of TSPO-pFLAG-cmv-2, pEGFP-C1 and pFLAG-cmv-2 transfected cells. Each bar shows the rate as mean ± SD calculated in three point of six independent transfections at 20, 25 and 40 h (⁎pb0.05, calculated by Student's t test between TSPO-pFLAG-cmv-2 and TSPO-pFLAG-cmv-2).
increasing PK 11195 concentrations. The 24h treatment was
started 24 or 96hours after transfection. As shown in Fig.
6
, PK
11195 caused a concentration-dependent inhibition of C6 cell
viability in both TSPO-pFLAG-cmv-2 transfected and control
cells treated starting from the 24th hour after transfection.
Interestingly, we observed that TSPO-pFLAG-cmv-2 transfected
C6 cells showed a higher sensitivity to the antiproliferative
activity of PK 11195 in comparison with control cells. These
differences were observed for each PK 11195 concentration.
According to the strong reduction in recombinant TSPO
expression that occurs 96h after transfection, no more differences
in sensitivity to PK 11195 were observable when the treatment
was initiated 96h after transfection.
4. Discussion
In recent years attention has been focused on TSPO role in
the regulation of cell proliferation, as several literature data
report that TSPO is strongly up-regulated in tumoral tissues or
tumor cell lines with respect to untransformed control tissues
[4–8]
. Much attention has been turned to TSPO as a promising
protein target for chemotherapy, suggesting its ligands as
potential therapeutic drugs
[13
–16,31–33]
. However, only
indirect data are available to elucidate the meaning of TSPO
up-regulation on tumor cells. TSPO is highly expressed in glioma
cells and to understand the role of its up-regulation in glioma
aggressiveness we produced, for the first time, genetically
modified glioma cells over-expressing TSPO protein and we
evaluated the influence of TSPO density on the typical features
that give an invasive/aggressive phenotype (i.e. proliferation,
motility and transmigration capabilities) to a tumor cell. Among
Fig. 5. Effect of TSPO over-expression on transmigration of C6 cells through an artificial barrier. (A) Cells were allowed to migrate through gelatin-coated filters in response to chemoattraction for 5 h. (B) Number of cells passed through the filter has been counted in 15 microscope fields (10×). Each bar shows the mean number ± S.D of cells counted in three independent experiments (⁎pb0.05, calculated by Student's t test).
Fig. 6. TSPO-pFLAG-cmv-2 and pFLAG-cmv-2 transfected C6 cell viability inhibition by PK 11195. Cells were treated with increasing concentrations (ranging from 1 to 100μM) of PK 11195 for 24 h. After incubation, cell viability was measured by MTS conversion assay. The results are expressed as a percentage of viable cells observed after treatment with PK 11195 vs vehicle treated cells (100%) and shown as mean ± SD. The data are obtained from three independent experiments done in duplicate.
glioma cell lines we selected C6 cells because we previously
characterized in this cell line TSPO expression and sub-cellular
localization and established cell response to TSPO ligand
treatment
[15,16]
.
By Western blot analysis, TSPO recombinant protein
expression was detectable 24h after transfection and some of
it remained up to 72h, a sufficiently long period to carry out
functional studies. Radioligand binding assays demonstrated
that the FLAG epitope addition to the amino terminus of TSPO
does not change the binding affinity for this ligand. Indeed, the
[
3H]PK 11195 binding affinity for FLAG-tagged TSPO resulted
comparable to that previously reported for native rat C6 glioma
cells
[29]
. Moreover, radioligand binding experiments showed
an increase of the [
3H]PK 11195 specific binding sites in cells
expressing TSPO recombinant protein with respect to control
cells, confirming Western blot results. By immunofluorescence
assays we also demonstrated that TSPO recombinant protein
accumulated at mitochondrion level accordingly with the main
distribution of TSPO in these cells, as previously demonstrated
by
[16]
.
These results demonstrate the success in producing C6 cells
over-expressing a recombinant TSPO protein with peculiarities
similar to those of the endogenous TSPO protein and pushed us
to undertake functional experiments to test the proliferation,
motility and transmigration properties of C6 cells
expressing the TSPO protein. We found that TSPO
over-expression increased C6 cell proliferation rate and the mitotic
index as well as the cell ability to overcome the
contact-dependent inhibition of cell growth, a feature that is linked to
tumor invasion capabilities. Moreover we found that TSPO
over-expression improved the motility rate and transmigration
capability of C6 cells, demonstrating that the increase of TSPO
expression level may contribute to the acquisition of an
invasive/aggressive phenotype in gliomas. This is the first
direct evidence that TSPO density influences glioma cell
aggressiveness and is consistent with previous reports that
correlate TSPO expression level and tumor malignancy grade
[18,23,24,28]
.
Our data agree with recent findings, obtained in breast cancer
cells, demonstrating that a siRNA mediated reduction of TSPO
endogenous level and TSPO over-expression induces a decrease
and an increase in cell proliferation, respectively
[34]
. However,
all these data are in contrast with a previous report describing
that TSPO knockdown by stable antisense transfection induces
an increase of in vitro tumorigenicity and a reduction of
apoptosis in C6 cells
[35]
. These authors have suggested that
increased cell proliferation in TSPO knockdown cells was due
to a loss of TSPO-related apoptosis. According to these
interpretations, we should have found an increase in apoptotic
cell death and a reduced proliferation rate in TSPO
over-expressing cells. Contrarily, in our experimental condition, we
did not find an increase in the number of dead cells and, in
addition, TSPO transfected cells proliferated at higher a rate
than controls. Although apparently contrasting, these findings
could be explained by the idea that TSPO could be found, inside
the outer mitochondrial membrane, as a monomer,
hetero-polymer or SDS and beta-mercaptoethanol resistant
homo-polymer. In the heteropolymers, TSPO is bound to the
mitochondrial permeability transition pore proteins
[9,36]
and
the heteropolymerization of TSPO in the pore complex is
limited by the density of VDAC
[37]
. The silencing of TSPO
expression affects the monomeric, the homopolymeric as well
as the heteropolymeric forms. On the contrary, the
over-expression of the FLAG-TSPO in the C6 cell mitochondrial
membranes preferentially acts by increasing the monomeric
TSPO. Indeed, the amount of the heteromeric TSPO is limited
by VDAC density and unlikely the number of heteropolymers
could increase without a parallel increase in VDAC expression.
Moreover, our Western blot analysis exclude that the majority
FLAG-TSPO protein is expressed as a SDS and
beta-mercaptoethanol resistant homopolymer. This explains why
the silencing and up-regulation have similar effects on the cell
growth. Indeed, the reduction of TSPO inside the pore makes
the cells more resistant to endogenous apoptotic stimuli, as
suggested by
[35]
while the increase of the monomeric form
promote cholesterol transport
[36]
and, as a consequence, the
biogenesis of the inner mitochondrial membrane that positively
correlate with cell proliferation, motility and invasiveness.
Finally, it is well known that micromolar PK 11195
concentrations induce apoptosis in C6 glioma cells
[18]
. In
the present study we tested the PK 11195 effects on cell viability
of C6 glioma cells expressing different TSPO levels. We found
that TSPO over-expression causes an increased susceptibility of
C6 glioma cells to the antiproliferative activity of PK 11195,
suggesting that this ligand may be useful also for the therapeutic
treatment of gliomas with aggressive phenotype and high TSPO
density.
Acknowledgement
This work was supported by a sponsorship grant from the
Programmi di Ricerca di Interesse Nazionale, MIUR, Italy.
References
[1] C. Braestrup, R.F. Squires, Specific benzodiazepine receptors in rat brain characterized by high-affinity [3H]diazepam binding, Proc. Natl. Acad.
Sci. U. S. A. 74 (1977) 3805–3809.
[2] P. Casellas, S. Galiegue, A.S. Basile, Peripheral benzodiazepine receptors and mitochondrial function, Neurochem. Int. 40 (2002) 475–486. [3] S. Venneti, B.J. Lopresti, C.A. Wiley, The peripheral benzodiazepine
receptor (translocator protein 18 kDa) in microglia: from pathology to imaging, Prog. Neurobiol. 80 (2006) 308–322.
[4] Y. Katz, A. Eitan, M. Gavish, Increase in peripheral benzodiazepine binding sites in colonic adenocarcinoma, Oncology 47 (1990) 139–142. [5] S. Galiegue, N. Tinel, P. Casellas, The peripheral benzodiazepine receptor:
a promising therapeutic drug target, Curr. Med. Chem. 10 (2003) 1563–1572.
[6] Z. Han, R.S. Slack, W. Li, V. Papadopoulos, Expression of peripheral benzodiazepine receptor (PBR) in human tumors: relationship to breast, colorectal, and prostate tumor progression, J. Recept. Signal Transduct. Res. 23 (2003) 225–238.
[7] S. Galiegue, P. Casellas, A. Kramar, N. Tinel, J. Simony-Lafontaine, Immunohistochemical assessment of the peripheral benzodiazepine receptor in breast cancer and its relationship with survival, Clin. Cancer Res. 10 (2004) 2058–2064.
[8] E. Pretner, H. Amri, W. Li, R. Brown, C.S. Lin, E. Makariou, F.V. Defeudis, K. Drieu, V. Papadopoulos, Cancer-related overexpression of the
peripheral-type benzodiazepine receptor and cytostatic anticancer effects of Ginkgo biloba extract (EGb 761), Anticancer Res. 26 (2006) 9–22. [9] V. Papadopoulos, M. Baraldi, T.R. Guilarte, T.B. Knudsen, J.J. Lacapère,
P. Lindemann, M.D. Norenberg, D. Nutt, A. Weizman, M.R. Zhang, M. Gavish, Translocator protein (18 kDa): new nomenclature for the peripheral-type benzodiazepine receptor based on its structure and molecular function, Trends Pharmacol. Sci. 27 (2006) 402–409. [10] F. Verrier, B. Mignotte, G. Jan, C. Brenner, Study of PTPC composition
during apoptosis for identification of viral protein target, Ann. N. Y. Acad. Sci. 1010 (2003) 126–142.
[11] D.R. Green, J.C. Reed, Mitochondria and apoptosis, Science 281 (1998) 1309–1312.
[12] G. Kroemer, B. Dallaporta, M. Resche-Rigon, The mitochondrial death/ life regulator in apoptosis and necrosis, Annu. Rev. Physiol. 60 (1998) 619–642.
[13] T. Hirsch, D. Decaudin, S.A. Susin, P. Marchetti, N. Larochette, M. Resche-Rigon, G. Kroemer, PK11195, a ligand of the mitochondrial benzodiazepine receptor, facilitates the induction of apoptosis and reverses Bcl-2-mediated cytoprotection, Exp. Cell. Res. 241 (1998) 426–434. [14] D. Decaudin, M. Castedo, F. Nemati, A. Beurdeley-Thomas, G. De Pinieux,
A. Caron, P. Pouillart, J. Wijdenes, D. Rouillard, G. Kroemer, M.F. Poupon, Peripheral benzodiazepine receptor ligands reverse apoptosis resistance of cancer cells in vitro and in vivo, Cancer Res. 62 (2002) 1388–1393. [15] B. Chelli, A. Lena, R. Vanacore, E. Da Pozzo, B. Costa, L. Rossi, A.
Salvetti, F. Scatena, S. Ceruti, M.P. Abbracchio, V. Gremigni, C. Martini, Peripheral benzodiazepine receptor ligands: mitochondrial transmembrane potential depolarization and apoptosis induction in rat C6 glioma cells, Biochem. Pharmacol. 68 (2004) 125–134.
[16] B. Chelli, L. Rossi, E. Da Pozzo, B. Costa, F. Spinetti, M. Rechichi, A. Salvetti, A. Lena, F. Simorini, R. Vanacore, F. Scatena, F. Da Settimo, V. Gremigni, C. Martini, PIGA (N,N-di-n-butyl-5-chloro-2-(4-chlorophenyl) indol-3-ylglyoxylamide), a new mitochondrial benzodiazepine-receptor ligand, induces apoptosis in C6 glioma cells, Chembiochem. 6 (2005) 1082–1088.
[17] J. Li, J. Wang, Y. Zeng, Peripheral benzodiazepine receptor ligand, PK11195 induces mitochondria cytochrome c release and dissipation of mitochondria potential via induction of mitochondria permeability transition, Eur J. Pharmacol. 560 (2007) 117–122.
[18] E. Vlodavsky, J.F. Soustiel, Immunohistochemical expression of peripheral benzodiazepine receptors in human astrocytomas and its correlation with grade of malignancy, proliferation, apoptosis and survival, J. Neurooncol. 81 (2007) 1–7.
[19] S. Pappata, P. Cornu, Y. Samson, C. Prenant, J. Benavides, B. Scatton, C. Crouzel, J.J. Hauw, A. Syrota, PET study of carbon-11-PK 11195 binding to peripheral-type benzodiazepine sites in glioblastoma: a case report, J. Nuclear Med. 32 (1991) 1608–1610.
[20] P. Cornu, J. Benavides, B. Scatton, J.J. Hauw, J. Philippon, Increase in omega 3 (peripheral-type benzodiazepine) binding site densities in different types of human brain tumours. A quantitative autoradiography study, Acta Neurochir. (Wien) 119 (1992) 146–152.
[21] C.H. Park, E. Carboni, P.L. Wood, K.W. Gee, Characterization of peripheral benzodiazepine type sites in a cultured murine BV-2 microglial cell line, Glia 16 (1996) 65–70.
[22] S. Lang, The role of peripheral benzodiazepine receptors (PBRs) in CNS pathophysiology, Curr. Med. Chem. 9 (2002) 1411–1415.
[23] H. Miettinen, J. Kononen, H. Haapasalo, P. Helen, P. Sallinen, T. Harjuntausta, H. Helin, H. Alho, Expression of peripheral-type benzodia-zepine receptor and diazepam binding inhibitor in human astrocytomas: relationship to cell proliferation, Cancer Res. 55 (1995) 2691–2695.
[24] N. Miyazawa, E. Hamel, M. Diksic, Assessment of the peripheral benzodiazepine receptors in human gliomas by two methods, J. Neurooncol. 38 (1998) 19–26.
[25] M. Hardwick, D. Fertikh, M. Culty, H. Li, B. Vidic, V. Papadopoulos, Peripheral-type benzodiazepine receptor (PBR) in human breast cancer: correlation of breast cancer cell aggressive phenotype with PBR expression, nuclear localization, and PBR-mediated cell proliferation and nuclear transport of cholesterol, Cancer Res. 59 (1999) 831–842. [26] R.C. Brown, B. Degenhardt, M. Kotoula, V. Papadopoulos,
Location-dependent role of the human glioma cell peripheral-type benzodiazepine receptor in proliferation and steroid biosynthesis, Cancer Lett. 156 (2000) 125–132.
[27] M. Hardwick, L.R. Cavalli, K.D. Barlow, B.R. Haddad, V. Papadopoulos, Peripheral-type benzodiazepine receptor (PBR) gene amplification in MDA-MB-231 aggressive breast cancer cells, Cancer Genet. Cytogenet. 139 (2002) 48–51.
[28] L. Veenman, E. Levin, G. Weisinger, S. Leschiner, I. Spanier, S.H. Snyder, A. Weizman, M. Gavish, Peripheral-type benzodiazepine receptor density and in vitro tumorigenicity of glioma cell lines, Biochem. Pharmacol. 68 (2004) 689–698.
[29] A.M. Gorman, G.B. O'Beirne, C.M. Regan, D.C. Williams, Antiproli-ferative action of benzodiazepines in cultured brain cells is not mediated through the peripheral-type benzodiazepine acceptor, J. Neurochem. 53 (1989) 849–855.
[30] M.M. Bradford, A rapid and sensitive method for the quantitation of microgram quantities of protein utilizing the principle of protein–dye binding, Anal. Biochem. 72 (1976) 248–254.
[31] A.P. Sutter, K. Maaser, P. Grabowski, G. Bradacs, K. Vormbrock, M. Höpfner, A. Krahn, B. Heine, H. Stein, R. Somasundaram, D. Schuppan, M. Zeitz, H. Scherübl, Peripheral benzodiazepine receptor ligands induce apoptosis and cell cycle arrest in human hepatocellular carcinoma cells and enhance chemosensitivity to paclitaxel, docetaxel, doxorubicin and the Bcl-2 inhibitor HA14-1, J. Hepatol. 41 (2004) 799–807.
[32] W. Xia, S. Spector, L. Hardy, S. Zhao, A. Saluk, L. Alemane, N.L. Spector, Tumor selective G2/M cell cycle arrest and apoptosis of epithelial and hematological malignancies by BBL22, a benzazepine, Proc. Natl. Acad. Sci. U. S. A. 97 (2000) 7494–7499.
[33] D.E. Muscarella, K.A. O'Brien, A.T. Lemley, S.E. Bloom, Reversal of Bcl-2-mediated resistance of the EW36 human B-cell lymphoma cell line to arsenite- and pesticide-induced apoptosis by PK11195, a ligand of the mitochondrial benzodiazepine receptor, Toxicol. Sci. 74 (2003) 66–73.
[34] W. Li, M.J. Hardwick, D. Rosenthal, M. Culty, V. Papadopoulos, Peripheral-type benzodiazepine receptor overexpression and knockdown in human breast cancer cells indicate its prominent role in tumor cell proliferation, Biochem. Pharmacol. 73 (2007) 491–503.
[35] E. Levin, A. Premkumar, L. Veenman, W. Kugler, S. Leschiner, I. Spanier, G. Weisinger, M. Lakomek, A. Weizman, S.H. Snyder, G.W. Pasternak, M. Gavish, The peripheral-type benzodiazepine receptor and tumorigenicity: isoquinoline binding protein (IBP) antisense knockdown in the C6 glioma cell line, Biochemistry 44 (2005) 9924–9935.
[36] F. Delavoie, H. Li, M. Hardwick, J.C. Robert, C. Giatzakis, G. Péranzi, Z.X. Yao, J. Maccario, J.J. Lacapère, V. Papadopoulos, In vivo and in vitro peripheral-type benzodiazepine receptor polymerization: functional sig-nificance in drug ligand and cholesterol binding, Biochemistry 42 (2003) 4506–4519.
[37] V. Papadopoulos, N. Boujrad, M.D. Ikonomovic, P. Ferrara, B. Vidic, Topography of the Leydig cell mitochondrial peripheral-type benzodiaze-pine receptor, Mol. Cell Endocrinol. 104 (1994) R5–R9.