Pulsar Analysis in Data Challenge 2
LAT Data Challenge 2 (DC2) has been an unique opportunity for LAT scientists to gain practice with a rich and highly-detailed γ-ray sky with thousands of fixed and variable sources.
The DC2 pulsar population described in previous Chapter acted as an useful tool for studying several aspects of pulsar analysis.
First of all the data generated for the DC2 were useful for testing and studying pulsar analysis tools currently present in the LAT SAE, with the possibility to exercise them in order to find possible bugs and suggest useful upgrades.
The DC2 data also helped as benchmark for new analysis techniques, as some analysis for detecting point sources or for finding pulsars using blind searches without knowing ephemerides of the pulsars.
Another very interesting opportunity was the possibility to use these simulated data to derive some first LAT capabilities for detection and study of γ-ray pulsars.
In this Chapter I will present the analysis, the tools and the techniques that I have developed for analyzing the Radio-Loud components of the DC2 pulsars. This analysis has been performed without looking before at the detail of the sky model, in order to be in a more realistic situation without knowing the DC2 truth, i.e. the input to the simulations.
During this analysis the blind searches techniques have not been explored, so the Radio-Quiet pulsars have been ignored during the analysis. However, during DC2 other mem-bers of the LAT Collaboration studied techniques for blind searches of pulsars (Atwood et al., 2006).
8.1
Automated Analysis Procedure for DC2 pulsars
Thanks to its sensitivity and effective area the GLAST Large Area Telescope is expected to detect many new γ-ray pulsars. As described in Ch. 4 the estimates on the number of detected pulsars varies depending on many parameters, as for example the lightcurve, the duty-cycle or the galactic position.
In addition a critical aspect in such estimates is the assumed emission scenarios. Since Polar Cap models and Outer Gap models show a different cutoff spectrum, the number of detected pulsars will differ significantly, as shown in several studies (Thompson, 2001; Gonthier et al., 2002; Romani & Yadigaroglu, 1995). The number of new discovered
pulsars has been found to range from some tens to some hundreds.
The increased statistics available with the LAT and the much powerful computing power presently available with respect to EGRET poses some interesting challenges in data analysis. In particular an automated processing system for detecting γ-ray pulsars can be developed. The DC2 was a perfect opportunity for designing a similar system and study its performances.
The basic idea of this automated analysis is to look for pulsars with a radio counterparts, using the ephemerides present in the pulsar Database that was released during DC2 in order to look for periodicity.
The automated procedure has been carried with two different situations. The first part of the analysis was devoted to the study of radio pulsars within a γ-ray source detected in the DC2 sky as point source, as for example using the the maximum likelihood. During the DC2 a LAT Catalog of source was released as it will be done after the first year of LAT data taking. This catalog contained all the point sources detected by the various algorithms developed for DC2 and the corresponding estimated position and flux. The second analysis is a complete scan over all the radio pulsars present in the Database, in order to look if some of them, even though not detected as point sources, can be detected using the timing signature. This was the case of the PSR B1951+32, that was detected with EGRET by folding the γ-rays at the period of the radio pulsar (Ramanamurthy et al., 1995). The analysis can be summarized in the following steps:
8.1.1
Identification of the pulsars
This first step depends whether the radio pulsar have or not a counterpart in the LAT database. In the first case a search was performed in order to find all radio pulsars in the database close to a LAT Catalog source.
Otherwise a list of all radio pulsars in the database was prepared. In both cases a list of pulsar to analyze is provided and the selection of the region of the sky is started.
8.1.2
Selection of the Region of Interest
After a radio pulsar has been found a selection of the region around radio pulsar has been performed in order to maximize the number of photons from the source compared with the background photons. This region will be indicated as Region Of Interest(ROI). This task is not trivial since the LAT Point Spread Function depend on the energy: At
100 MeV it is about 3◦, while it decreases to about 0.1◦ for energies above 10 GeV.
For EGRET an energy-dependent cut was adopted, since the radius of the Region of Interest (ROI) around the pulsar varied with energy. Such approach should be more efficient but at the DC2 time similar PSF-dependent selection were not implemented, then it was decided to apply two sets of cuts depending on energy:
• Radius of ROI fixed to 3◦ for energies above 100 MeV (Selection A);
• Radius of ROI fixed to 0.5◦ for energies above 1 GeV (Selection B );
The Selection A is more suitable for detecting pulsar that have a sharp cutoff and/or are fainter, since with this selection a major number of photons is considered. Conversely the
MSPs) and/or are brighter. In this case such a selection lower the statistics but does not reduce too much the signal/background ratio.
The results of this trade off between angular resolution and statistics can be seen by
0 0.1 0.2 0.3 0.4 0.5 0.6 0.7 0.8 0.9 1 300 320 340 360 380 400 420 Phase curve of PSR_J1640m4648 0 0.1 0.2 0.3 0.4 0.5 0.6 0.7 0.8 0.9 1 10 20 30 40 50 60 70 Phase curve of PSR_J1640m4648 Phase curve of PSR_J1640m4648
Figure 8.1: Example of DC2 pulsar J1640-4648, that can be detected with both Selection
A and B. Left: Selection A (E>100 MeV and r<3◦). Right: Selection B (E>1 GeV and
r<0.5◦).
looking at some examples of reconstructed lightcurves of DC2 pulsars with Selection A or Selection B. For each one of these examples the periodicity has been tested using χ2
-Test and the lightcurve has been built.
Fig. 8.1 show the case of the simulated PSR J1640-4648, a DC2 pulsar with a period
of 0.17 s. and located almost on the Galactic plane (galactic latitude b=0.2◦). The
total flux above 100 MeV is about 10−7 ph cm−2s−1 and the spectrum has a cutoff
energy at about 10 GeV and a spectral index g ≃-1.2. This spectral characteristics made this pulsar detectable with both selections A and B (even if Selection A has more background), and the lightcurve can be distinguished with both Selections.
Fig. 8.2 show the case of the simulated PSR J1741-2019, a DC2 pulsar with a period
0 0.1 0.2 0.3 0.4 0.5 0.6 0.7 0.8 0.9 1 100 120 140 160 180 200 220 240 260 280 Phase curve of PSR_J1741m2019 0 0.1 0.2 0.3 0.4 0.5 0.6 0.7 0.8 0.9 1 0 1 2 3 4 5 6 Phase curve of PSR_J1741m2019 Phase curve of PSR_J1741m2019
Figure 8.2: Example of DC2 pulsar J1741-2019, that can be detected with Selection A
but not by Selection B. Left: Selection A (E>100 MeV and r<3◦). Right: Selection B
(E>1 GeV and r<0.5◦).
of 3.9 s. and located at galactic latitude b=0.2◦. The total flux above 100 MeV is
a spectral index g ≃-1.1.
We can see that using Selection A the lightcurve is visible and the pulsar is also easily detectable, while with selection B the detection is not possible and the lightcurve it is not clearly visible. This is an example where the diffuse background can deteriorate the observation at high energies, especially for pulsar like this, whose spectrum has a cutoff at few GeV.
Fig. 8.3 show the case of the simulated PSR J1841-0501, a DC2 pulsar with a period
0 0.1 0.2 0.3 0.4 0.5 0.6 0.7 0.8 0.9 1 400 420 440 460 480 Phase curve of PSR_J1841m0501 0 0.1 0.2 0.3 0.4 0.5 0.6 0.7 0.8 0.9 1 10 20 30 40 50 60 Phase curve of PSR_J1841m0501 Phase curve of PSR_J1841m0501
Figure 8.3: Example of DC2 pulsar J1841-0501, that can be detected with Selection B
but not with Selection A. Left: Selection A (E>100 MeV and r<3◦). Right: Selection
B (E>1 GeV and r<0.5◦).
of 0.04 s. and located at galactic latitude b=-0.14◦. The total flux above 100 MeV is
about 4.5×10⁻⁷ ph cm−2s−1 and the spectrum has a cutoff energy at about 33 GeV and
a spectral index g ≃-1.48.
We can see that with Selection B the two-peaked lightcurve is clearly visible and the pulsar is also easily detectable, while with Selection A the detection is not possible and the lightcurve cannot be easily distinguished. This is mainly due to the fact that, because of the cutoff at high energy and the spectrum harder than the diffuse background, many high-energy photons are produced. Due to relatively low flux and the position (almost on the Galactic plane), at lower energies the diffuse background exceed the pulsar signal, then Selection A is not very efficient. Selection B select only high energies, where pulsar has more photons than background, then with Selection B the lightcurve is clearly visible.
These examples show how the diffuse background can deteriorate the observation at high energies, especially for pulsars that cut off at few GeV.
This situation is better visible for pulsars near the Galactic plane as most of the DC2 pulsars. For other galactic latitudes other selection cuts can be studied. Indeed this is a first example of a selection strategy that is important to study extensively in order to improve the possibility of detecting pulsars with the LAT.
Other cuts have been implemented by selecting the events by class, i.e. selecting those that converted in the front or in the back section of the LAT Tracker, but we ignored such property and select all photons, in order to maximize the statistics of photons. The analysis has been performed using these two selection methods independently and then compare results at the end of the analysis chain. In this way the detections have been compared in order to see what pulsar has been detected with two cuts and which
pulsar appeared with only one particular cut.
8.1.3
Barycentric corrections
Once the region of the sky is selected, the barycentric corrections have been performed in order to convert the arrival time of the TT to arrival times to the Solar System
Barycenter in TDB1
.
In order to do that, the position of the radio source has been used and the orbit file of the DC2, that contains the position of GLAST around Earth during the simulated DC2 period. The details of the barycentering procedure are explained in Ch. 5.
8.1.4
Periodicity Tests
After these preliminary steps performed for each pulsar the next step is the periodicity testing. This phase is critical since it permit to know if the γ-rays coming from the ROI are modulated at the same frequency of the radio source.
Not all radio pulsars have a γ-ray emission or it is too faint, then this test fails to reveal a source. In the DC2 data there is only this second possibility, since we included some pulsars with low fluxes as described in previous Chapter. This low fluxes serve to give an estimate of the lower detectable flux with the LAT.
The periodicity tests available in DC2 analysis are those presented in Ch. 2. For sake
of simplicity we perform this first analysis using the χ2
-Test. In following analysis we also used the H-Test in order to reduce the dependence of the method upon the shape of the lightcurve, but in general the results are almost the same.
8.2
Pulsar Detection
For each analyzed pulsar a periodicity test has been performed using the correspondant
ephemerides in the pulsar database and the Chance Probability Pc is found for every
pulsar. This Chance Probability is described in Ch. 2 and means the probability that
a non periodic source give by chace a value of the χ2
statistic greater or equal to the value found in the data.
According to the literature the γ-ray pulsars detected in the EGRET era are 7
High-Confidence and three marginal or Low-Confidence detections as described in Ch. 4
(Thompson, 2001).
In order to have a kind of rough comparison with the pulsars detected using EGRET
we fixed some limits in Pc and define three range of detection:
• High-Confidence detection when Pc < 10−9, determined from the Chance
Prob-ability of PSR B1951+32, the faintest of the EGRET pulsars (Ramanamurthy et al., 1995);
• Low-Confidence detection when 10−9 < Pc <2×10⁻³, determined from the Chance
Probability of PSR B0656+14 (Ramanamurthy et al., 1996);
• No detection when Pc >2 × 10⁻³;
According to these values each pulsar is classified and then the general properties of the detected pulsars are studied, as the distributions together with the lower flux and other important characteristics.
8.3
The pyPulsar Analysis Package
The implementation of the analysis procedure described in Sec. 8.1 has been developed using three main tools.
The first one is the LAT pulsar analysis tools present in the SAE, since one of the goal of this analysis is to test the possible use of these tools in an automatic approach.
The second tool used in this analysis is the Python scripting language2
that has revealed to be very useful for managing long analysis because of it flexibility.
Automated analysis can also be carried out with several other scripting languages, as the classic bash or tcsh Linux shell. Instead of those Python language has been preferred since many operations are fairly simple, as the parsing operations on ASCII files. For this reasons the manipulation of long lists of output results from analysis is very simple. In particular Python has many extensions to the most common software package,
in-cluding an extension to manage FITS files called pyFits3
and an extension to the classes
of the ROOT framework called pyROOT4
.
We collect these useful software in a collection of classes and scripts called pyPulsar that will be described in the following.
A basic scheme of pyPulsar is shown in Fig. 8.4. The basic component is a set of classes interfacing with the Science Tools. These classes, as for example pyGtbary.py, contain methods for setting parameters and running the correspondant tool in the SAE. All these classes are linked to a main class called pyPulsar.py that contains all the rel-evant parameters of each pulsar together with the methods to do specific operations on it (selection, barycentering, phase assignment, etc..). For each pulsar under analysis an object of pyPulsar.py class is created.
The pyPulsar.py class uses pyFits for managing I/O on FITS files and pyROOT for plotting output, as for example the lightcurve or the skymap relative to a specific pulsar under analysis.
Because pyPulsar.py is implemented and all the classes corresponding to the pulsar SAE tools are also available, the analysis can be carried on simply creating some scripts that perform in sequence the steps described in the previous Section. In particular the out-put files can be filtered in order to group the pulsars with same characteristics, e.g the
High-Confidence pulsars.
All the procedure has been tested on a desktop computer and also using the SLAC
computing farm5
. In this second case two approach have been followed. A serial anal-ysis, where all pulsars were analyzed in sequence, and a parallel analanal-ysis, where each single-pulsar analysis was sent to an independent batch jobs on the SLAC computing farm and then the final results were collected in a final report.
2
http : //www.python.org
3See:
http : //www.stsci.edu/resources/sof twarehardware/pyf its 4See
http : //wlav.web.cern.ch/wlav/pyroot/
5See
Figure 8.4: A scheme of the pyPulsar automated Python-based automated pulsar anal-ysis
8.4
Analysis of pulsars detected as point sources
During the first part of the analysis we are interested to study the detection of pulsars that have been also detected as point sources using the source detection algorithms, e.g the maximum likelihood.
As a product of such algorithms is a source catalog called LAT Source Catalog that contains list of point sources detected and their properties, e.g. estimated position, flux, etc. This DC2 LAT Source Catalog is a prototype of the real LAT Catalog of the sources that will be detected during the mission.
This is an important situation, since the brightest pulsars will be hopefully the firsts to be detected by looking at the photons coming from the point source that lie nearby a known radio pulsar.
8.4.1
Finding the counterparts
In DC2 sky there was a set of radio pulsars that represent a realistic population of radio pulsars in the sky, some of them have a γ-ray detectable emission. In order to determine which γ-ray source can be detected as pulsar using the radio ephemerides the first step to perform is a search for coincidences between the LAT Source Catalog and the radio pulsars contained in the official pulsar database of DC2.
In order to do that a Python script has been created, that searched if a radio pulsar in the DC2 pulsar database was within the localization error box of a LAT Catalog source. In LAT Catalog a localization error box was associated to each source detected as a point source. In the LAT Catalog provided during the DC2 to each LAT source there was an associated localization error box, meaning the radius of 95% confidence
limit obtained using maximum likelihood. The error box depend on the energy band where the highest confidence detection occurred. Four energy bands with the associated
localizarion errors were used: 1) 2.2◦ for 100 MeV <E<300 MeV; 2) 0.95◦ for 300 MeV
<E<1 GeV; 3) 0.38◦for 1 GeV <E<3 GeV, and 4) 0.17◦for E> GeV. Using this method
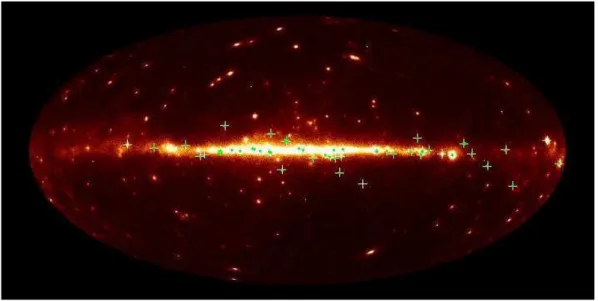
Figure 8.5: The coincindences between simulated radio pulsars in DC2 (crosses) and γ-ray point sources (circles) detected in the LAT Catalog
a sample of 49 radio pulsars were found to be concident to sources in the LAT Catalog as shown in Fig. 8.5. The ephemerides of these radio pulsars have been then used to apply periodicity test and look for pulsed emission.
8.4.2
Results
After running the automatic analysis procedure to these pulsars selecting photons above 100 MeV and with a radius of 3 degrees around radio pulsar positions, turned out that 22 pulsars were detected as high-confidence and 14 as low-confidence detections.
The spatial distribution of these pulsars is shown in Fig. 8.6 compared with pulsars in ATNF Catalog, where it can be seen that most of them lie on the Galactic Plane.
By looking at the P - ˙P diagram of Fig. 8.7 some interesting information can be
derived for the detected pulsars. Using the characteristic age and surface magnetic field estimated as in Chap. 3 we can see that the yougest pulsars detected are Vela and Crab,
with ages of about 103
yr and magnetic fields that can be estimated as BS ≈ 10
11
G. This is not surprising since Vela and Crab are the brightest γ-ray pulsars in the sky so we expect to detect them easily.
Another interesting issue is the detection of 5 MSPs, four of them with high-confidence
level. These MSPs appear to be older (τc ≈ 10
8
yr) and have low magnetic fields
(BS <10
9
G). These characteristics are in agreement with the original values used for simulations, showing that at least an order-of-magnitude estimate on pulsar parameters can be done from this diagram. Pulsars with a γ-ray emission detected as a point sources allow the possibility to study the flux distribution, where the flux is the one estimated
Figure 8.6: Skymap showing the pulsars detected in the DC2 LAT Catalog with High-Confidence (squares) and Low-High-Confidence (triangles). The pulsars present in the ATNF Catalog (May 2006) are also shown for comparison.
Figure 8.7: The P- ˙P Diagram for pulsars detected in the DC2 LAT Catalog with
High-Confidence (squares) and Low-High-Confidence (triangles).The pulsars present in the ATNF Catalog (May 2006) are also shown for comparison.
using maximum likelihood algorithm.
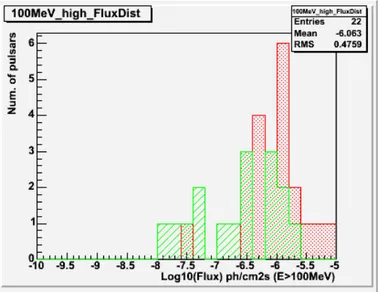
The flux distribution is presented in Fig. 8.8. From such a distribution we can see that in the DC2 observing time the lowest detected flux is of the order of log(F)≈-7.5 for high-confidence detections and log(F)≈-8 for low-confidence detections. Of course these have to be considered as crude estimates, but at the same time they provide a good way to determine an estimate on the flux limit for pulsed emission.
Figure 8.8: Flu distribution for pulsars detected in the DC2 LAT Catalog with High-Confidence (dot-shaded) and Low-High-Confidence (line-shaded)
change of slope that we can interpret as due to the LAT sensitivity. In the Fig. 8.9 this cumulative distribution has been obtained collecting the information of all pulsars detected both High-Confidence detection and Low-Confidence detection.
Figure 8.9: The logN-logS distribution for pulsars detected in the DC2 LAT Catalog with both High Confidence and Low-Confidence detections. The change of slope is visible, that can be interpreted as due to the limit of the LAT sensitivity.
8.5
Beyond the LAT Source Catalog
The study of periodicity of sources detected from Maximum Likelihood Analysis is of particular importance for estimating the fluxes that LAT can reach for pulsed emission. Using the simple Chi-Square periodicity test it has been shown that fluxes as low as
10−8 ph cm−2s−1 could be detected in about 55 days. The information about timing
Figure 8.10: Skymap showing the pulsars detected from the scan of the whole LAT DC2 database. In this case the selected photons have energies greater than 100 MeV and are
within 3◦ from the radio source. High-Confidence pulsars are indicated by squares and
Low-Confidence pulsars by triangles. The pulsars present in the ATNF Catalog (May 2006) are also shown for comparison.
that is available from the database of the radio pulsars simulated for DC2 provide the possibility to see if some radio pulsar is also emitting γ-rays, by looking at the periodicity of the photons coming from a region within the radio source position. With a similar approach the periodicity is searched even if there is no clear evidence for γ-ray point source emission.
Historically this approach has been successfully during the EGRET era, since the γ-ray emission from PSR B1951+32 has been discovered by looking if photons coming from the region around the radio pulsar were periodic. Using periodicity testing techniques it has been found that PSR B1951+32 was also a γ-ray pulsar (Ramanamurthy et al., 1995). In this second part of the analysis a scan is performed on the whole sample of pulsars in the DC2 pulsar database and for each radio pulsar a cut is performed around radio pulsar and periodicity is tested. For DC2 the pulsar database contain 98 radio pulsars, while the real LAT pulsar database will contain several hundreds of radio pulsars according to the LAT timing program that is going to be established. As a comparison we should remember that during the CGRO mission the pulsar database of monitored pulsars contained about 500 pulsars.
The scan over the DC2 pulsar database has been repeated with two different sets of energy and angular selections as explained in the beginning of this Chapter.
A first analysis has been performed by selecting photons above 100 MeV and within a
Figure 8.11: Skymap showing the pulsars detected from the scan of the whole LAT DC2 database. In this case the selected photons have energies greater than 1 GeV and are
within 1◦ from the radio source. High-Confidence pulsars are indicated by squares and
Low-Confidence pulsars by triangles. The pulsars present in the ATNF Catalog (May 2006) are also shown for comparison.
Figure 8.12: The P- ˙P Diagram for pulsars detected from the scan of the DC2 pulsar
database.In this case the selected photons have energies greater than 100 MeV and are
within 3◦ from the radio source. High Confidence detections are indicated by squares
and Low-Confidence pulsars by Triangles
performed selecting photons above 1 GeV and within a radius of 1◦ (Selection B ).
The skymaps of the detected pulsars using these two cuts are shown in Fig. 8.10 and Fig. 8.11.
Low-Confidence detections, while the selection of photons above 1 GeV lead to 25 High-Confidence detections and 34 Low-High-Confidence detections.
The difference between the number of pulsar detected using the two selection methods depends from the spectrum of pulsars and from a selection effect due to flux. Selecting photons above 1 GeV few photons are considered then only the brightest pulsars should be detectable.
At the same time for E greater than 1 GeV the MSP are favoured since their spectrum is harder than pure Slot Gap pulsars presented in previous Chapter. In this way there is a major number of photons above 1 GeV where the PSF is better and then the signal to background is increased.
This can also be seen by looking at the P- ˙P diagram for these two cases as shown in
Fig. 8.12 and Fig. 8.13 with a comparison the pulsars in ATNF catalog.
This is also confimed by looking at the P- ˙P diagram. Pulsars detected using photons
above 1 GeV show that there is a greater number of MSP detected with respect to the MSP detected selecting photons above 100 MeV. At the same time the fainter pulsars that were detected above 100 MeV disappear when analyzed using photons above 1 GeV because of the lower statistics.
Figure 8.13: The P- ˙P Diagram for pulsars detected from the scan of the DC2 pulsar
database.In this case the selected photons have energies greater than 1 GeV and are
within 1◦ from the radio source. High Confidence detections are indicated by squares
and Low-Confidence pulsars by Triangles
8.6
Comparing the results
Using the information of the two selections it is interesting to merge the results in order to obtain a more general summary of detectable pulsars. The partial and total results are shown in Table 8.1.
Selection A Selection B Merged 1 year extrapolation
No Detections 42 38 14 34
Low-Confidence 26 34 51 125
High-Confidence 29 25 32 78
Table 8.1: Summary of pulsar analysis from scanning the whole DC2 pulsar database. The extrapolation of 1 year has been also computed
could be expected using both these two selection methods. Since the number of High-Confidence detection derived looking only at the LAT Catalog of point sources is 22 we can expect that the direct testing of periodicity directly looking at the pulsar database coult be a good technique for discovering new pulsars.
A rough estimate could be obtained by simply extrapolating the number of pulsars de-tections to 1 year. The number of expected detection scales as the ratio of the root squares of the observing time, since the exposure is almost uniform for such long obser-vation times.
In this way it is possible to estimate that the number of High-Confidence detections is of about 78 and 125 Low-Confidence detections for 1 year of LAT observation in scanning mode. This is in agreement with the estimates found is some studies like (Gonthier et al., 2002). This is to be entirely expected, since most of the DC2 pulsar simulations are based on a very similar model. Indeed this result turns out to be very helpful to test consistency for simulation chain.
8.7
Perspectives for an optimized analysis
The results shown here are useful for presenting possible strategy for an automated processing of pulsar data using LAT data. Of course there are a lot of major issues that can be refined in order to improve the performances of this algorithm.
A first improvement comes from the use of multiple statistical tests for periodicity search.
For example after DC2 also the Z2
nand H-test presented in Chap. 2 have been included.
In this way also a comparison can be made among the different detection strategy. In this analysis it has also became clear that the selection on energy and radius around the radio pulsar position is important for discovering new pulsars. In order to discover what kind of selection in energy and angle is optimal an upgrade to this procedure has been developed. A scan over different couples of energy and radii of the ROI is performed, in order to understand which cut minimize the Chance Probability.
This solution is much complex since includes much more trials over minimum energy and radius but it should be possible to finally implement using a parallel computing farm. Another interesting possibility is to use an energy-dependent cuts as done for EGRET data.
8.8
Summary
In this Chapter an analysis of the DC2 pulsars has been presented. This analysis had two main goals.
The first is to show that the SAE pulsar tools can be interfaced and run automatically using an opportune infrastructre based in scripting language. In this case the Python scripting language is being used but similar approach using other scripts, e.g. bash shell, have been developed. Python has the main advantage to be much more flexible, then many operations can be much simplified.
The idea of this analysis is not to be focused on single sources, since almost all pulsars comes from simulations and does not correspond to reality. For example the great part of them is at simulated location in the sky. However, useful information that can be obtained from such an analysis is the LAT capability to study the general population of the detected pulsars, without taking care of the single sources. With this approach very useful information can be obtained, e.g. the minimum detectable flux and the estimated number of detection in 1 year.
As it has been shown in this Chapter this Population point-of-view can be very useful and effective and thanks to the computing resources presently available is very simple to implement an automatic system of analysis like the one presented here.
In this way the enourmous discovery potential of the LAT for pulsars could be gratly enhanced.