Università Roma Tre
Dipartimento Scienze Geologiche
Scuola Dottorale in Geologia dell’Ambiente e Geodinamica
XXII ciclo
Emplacement temperature and flow direction analysis
of large dimension calderas ignimbrites:
the Cerro Galán and Toconquis Group ignimbrites
(Puna plateau, NW Argentina)
Candidata: Chiara Lesti
Tutor: Massimo Mattei Co-tutor: Guido Giordano
1. Abstract ... 2
2. Introduction ... 3
2.1. Large scale eruptions... 4
2.2. Transportation and depositional processes in pyroclastic flows... 5
2.3. Emplacement temperatures... 7
2.4. Magnetic fabric and flow directions ... 9
3. Geological setting and sedimentological features of the Cerro Galán ignimbrites ... 11
4. Temperature estimation by paleomagnetic method ... 14
4.1. Methodology ... 14
4.2. Lithics sampling and TRM laboratory procedures ... 18
4.3. Lithics magnetic mineralogy - results... 22
4.4. Thermal Remanent Magnetization (TRM) data... 25
4.4.1. TRM results for the Toconquis Group ignimbrites... 25
4.4.2. TRM results for the Cerro Galán ignimbrite... 29
4.5. Ages and polarity... 31
4.6. Estimation of the emplacement temperature ... 33
5. Flow direction determination by the anisotropy of magnetic susceptibility... 36
5.1. Methodology ... 36
5.2. Matrix sampling and AMS laboratory procedures ... 37
5.3. Matrix magnetic mineralogy - results... 41
5.4. Anisotropy of magnetic susceptibility data ... 44
5.4.1. Low field AMS Results for the Cerro Galàn ignimbrite ... 44
5.4.2. High field AMS Results for the Cerro Galàn ignimbrite ... 45
5.5. Image analysis ... 47
5.6. Definition of flow directions ... 50
6. Emplacement mechanism – a model ... 56
7. Conclusions ... 64
1. Abstract
Estimates of pyroclastic flow emplacement temperatures in the Cerro Galàn ignimbrite and Toconquis Group ignimbrites and flow directions were determined using thermal remanent magnetization (TRM) of lithic clasts embedded within the deposits and the anisotropy of magnetic susceptibility, respectively. These ignimbrites belong to the Cerro Galàn volcanic system, one of the largest calderas in the world, in the Puna plateau, NW Argentina.
Temperature estimates for the 2.16 ± 0.16 Ma Cerro Galán ignimbrite are retrieved from 40 sites in 14 localities (176 measured clasts), distributed at different distances from the caldera and different stratigraphic heights. Additionally, temperature estimates were obtained from 27 sample sites (125 measured clasts) in seven ignimbrite units forming the older Toconquis Group (5.60±0.20 - 4.51±0.11 Ma), mainly outcropping along a type-section at Rio Las Pitas, Vega Real Grande.
Flow directions are defined in 35 sites (403 measures specimens), distributed again at different distances and azimuth from the caldera and at different stratigraphic heights along the same section. The flow direction assessment was carried out on the Cerro Galàn ignimbrite and not on the older units, as the outcrops of the Toconquis Group are limited in extension mainly to the west of the caldera.
The paleomagnetic data obtained by progressive thermal demagnetization (PTD), show that most of the clasts of the Cerro Galán ignimbrite have one single magnetic component, oriented close to the expected geomagnetic field at the time of emplacement. Results show therefore that most of the clasts acquired a new magnetization oriented parallel to the magnetic field at the moment of the ignimbrite deposition, suggesting that the clasts were heated up to or above the highest blocking temperature (Tb) of the magnetic minerals
(Tb=580°C for magnetite; Tb=600-630°C for titano-hematite).
We obtained similar emplacement temperature estimations for five out of six volcanic units belonging to the Toconquis Group, with the exception of one unit (Lower Merihuaca), where we found two distinct magnetic components. The estimation of emplacement temperatures in this latter case is constrained between 580°-610°C.
The study of the AMS was performed in order to analyse the ignimbrite fabric and to evaluate the flow structure and emplacement mechanism, relating the magnetic fabric to the paleotopography.
Flow directions are defined in 35 sites (403 measures specimens), distributed at different distances and azimuth from the caldera and at different stratigraphic heights along the same
section. The comparison of magnetic fabric with mineralogical fabric is also examined to assess the reliability of the AMS as flow direction indicator.
AMS results show a strong uniformity throughout the ignimbrite, with the exception of sites where the topographic control on the emplacement mechanism is higher. Flow directions results show a radial pattern around the caldera, in proximal sites, while in distal sites the directions are deflected by the paleotopography.
The strong control of the paleotopography revealed in this study, together with field evidences of low level of turbulence and high emplacement temperatures estimation found, indicate that the flow was highly concentrated throughout the flow path.
We conclude that the Cerro Galán ignimbrite and Toconquis Group ignimbrites were emplaced at temperatures equal to or higher than 620°C and that in distal sites the flow, besides having the capacity of travel up to 80 Km, follows passively the paleotopography. The
homogeneity of high temperatures from proximal to distal facies, and the behaviour in presence of topographic obstacles in distal sites, provide constraints for an emplacement model for the Cerro Galán ignimbrite, marked by a relatively low eruption column, low levels of turbulence during deposition, air entrainment, surface-water interaction, and a high level of topographic confinement, all ensuring minimal heat loss and high concentration flow.
2. Introduction
This study is part of an international project focused on the characterization of the facies architecture and of the emplacement processes of the Cerro Galàn Ignimbrite, Argentina, applying paleomagnetic methods and analysis of the magnetic fabric. The Cerro Galán volcanic system (Puna plateau) in northwest Argentina has been the site of at least 9 large to very large volume pyroclastic eruptions over the past 6 Ma (Folkes et al., submitted-a). Sparks et al. (1985) were the first authors to describe the stratigraphy, volcanology and age of these deposits. They recognized that the last ignimbrite, called Cerro Galán ignimbrite (CGI), formed the present caldera and represents the most voluminous eruption of the Cerro Galán volcanic system with the most distal outcrop at ~74 km to the north of the current topographic margin. The older ignimbrite deposits, grouped under the name of Toconquis Group, were likely related to an older caldera (Folkes et al. submitted-a), and have a smaller, though more poorly constrained volume than the Cerro Galán ignimbrite.
These ignimbrites are ideal M8 magnitude ignimbrites to study for a number of factors, above all the arid climate that allows the exposure of nearly continuous outcrop and the
analysis of the evolution of the fabric from proximal to distal sites; the erosion that acted during the last 2 Ma exposed high sections trough the deposit, that is very well preserved. 2.1. Large scale eruptions
Large scale explosive eruptions, producing very large volume pyroclastic flows that rapidly travel to great distances from the eruptive centre (volcanic explosivity index VEI>7) are the most dangerous eruptions.
These eruptions have not been witnessed in historical times and are, therefore, relatively poorly understood. To better understand the emplacement dynamics of these flows, we must therefore either extrapolate from historic observations of small to moderate volume pyroclastic flows, or use indirect measurement techniques and models.
Pyroclastic flows are fluidized mixtures of hot gas, pumices, crystals, rock debris and fine ash, forming variably turbulent flows able to reach far distances at high velocity.
Historical small to intermediate volume pyroclastic flows are known as one of the most destructive natural events, as reported for the 79 AD eruption of Vesuvius, Italy, (Sigurdsson et al. 1985; Cioni et al. 1992), the 1883 eruption at Krakatau, Indonesia (Simkin and Fiske 1983); the 1902 Mt Pelee, Martinique, where 30,000 people were killed (Lacroix 1904; Fisher and Heiken 1982). At Mt St Helens, USA in 1980, 57 persons lost their lives, though the volcano was constantly monitored (Lipman and Mullineaux 1981), as at Mt Unzen, Japan, where a better knowledge of the emplacement behaviour of the 1991 pyroclastic flows could have avoided the 43 people lost.
From the Ordovician to Pleistocene, 47 large volume eruptions are known, of which 42 in the last 36 Ma (Mason et al. 2004). These are M8 events except the one that produced the Fish Canyon Tuff , in the USA, which is an M9 event (Lipman 1997).
The quantification of the magnitude of an eruption is described in literature with different approaches, either on the volume of the deposit (in km3) or on the mass of erupted tephra (in kg).
One of the most used indexes is the VEI (volcanic explosivity index) by Newhall and Self 1982), which is a semi-quantitative logarithmic scale of eruption size, based on a combination of erupted tephra volume and eruption plume height. On this scale, the largest events (VEI ≥ 8) are defined as eruptions with bulk tephra volumes >1.000 km3. The magnitude scale M by Pyle 1995) is instead based on the erupted mass. An M8 event, defined as an event with an erupted mass comprised between 1015 and 1016 kg can vary in volume between 400 and 10.000 km3, depending on the bulk density of the deposit (which may range from 1.000–2.500 kg m-3).
The last two VEI 8 eruptions reported by Mason et al. 2004) occurred at 74 ka b.p. with the M8.8 eruption of the Younger Toba Tuff from Toba, Sumatra (Rose and Chesner 1987), and at 26.5 ka b.p., with the M8.1 Oruanui eruption, New Zealand (Wilson 2001).
The consequences of events of such scale remain poorly constrained, but the impact on the climate of the Earth may be as severe as a ‘volcanic winter’ (Rampino and Self 1992).
The understanding of the emplacement mechanism of pyroclastic flows, through the modelling of the transport and the depositional systems, is crucial in terms of risk assessment. 2.2. Transportation and depositional processes in pyroclastic flows
Two main models have been developed on transport and depositional processes in pyroclastic flows on the basis of the direct observation of historical events and on the study of the ignimbrites recorded in the geological record: the en masse or plug flow model of Sparks 1976), and the progressive aggradation model of Fisher 1966) and Branney and Kokelaar 1992; Branney and Kokelaar 2002).
A pyroclastic flow deposit is concordantly divided in three main facies (Sparks et al. 1973): a basal layer 1 that originate from the turbulent front and margins of the flow; the layer 2 which originates from the ‘body of the flow’, and the uppermost layer 3 originated from the low particle concentration, turbulent, trailing ash cloud. The main ignimbrite may show complex internal vertical and lateral variations, including massive and chaotic divisions, poorly stratified to stratified divisions, as well as normal and reverse grading of both lithic and pumice clasts forming lithic and pumice concentrations zones at various heights.
The two models are concordant on the origin of layer 1 and 3, but are in contrast on the depositional mechanism of the ‘body’ layer 2.
In the plug flow model the pyroclastic flows are non-turbulent, high-density fluidised flows (Sparks 1976; Miller and Smith 1977; Sparks et al. 1978). As the pyroclastic flow decelerates, it degasses, deflates, causing frictional interlocking of grains, and comes to a stop, more or less at once (Sparks 1976). In this model, the lithic rich layers 2bL and the pumice rich layers 2bP are interpreted as a hydraulic settling of the lithics and at the same time floating of the pumices in the ‘body’ of the flow. The body of the flow may be turbulent near vent, but in distal regions it is probably laminar. The flow is capable of surmounting topographic obstacles because of it momentum (Sparks et al. 1978) but, as the flow is dense and non turbulent, it would continue as a whole, with no separation between transport and depositional system. The implication of such model is that time lines throughout the deposits are almost vertical, i.e. the earliest erupted material is deposited at the front, whereas the rest progressively at the rear (e.g. Giordano 1998). Given the usual travel-time of pyroclastic
flows (minutes to tens of minutes), large volume ignimbrites necessarily have to originate by a succession of individual events, as incremental (Walker et al. 1995).
In the progressive aggradation model, or expanded flow model, pyroclastic flows are dominantly turbulent, highly dilute and low particle density current (Branney and Kokelaar 1992; Druitt 1992; Druitt 1998). Deposition occurs continuously when particles from the main part of the flow drop into a thin, basal, low velocity, laminar, boundary layer, onto the aggrading depositional surface (Fisher 1966; Branney and Kokelaar 1992; Branney and Kokelaar 2002). The implication of such model is that time lines throughout the deposits are almost subhorizontal, i.e. the earliest erupted material is deposited at the bottom, whereas the rest progressively on top (e.g. Giordano 1998). Given the usual travel-time of pyroclastic flows this model allows for any thickness to be deposited under sustained currents also for large volume ignimbrites. Vertical variations in deposit characteristics such as the normal and reverse grading of lithics and pumices are attributed to changes in flow conditions and in intensity of energy released at the vent. Lithic concentration zones high in an ignimbrite, vertical compositional zonation in juvenile clasts, also support progressive or incremental aggradation. The flow in this model is capable to surmount of topographic barriers because it is thicker than the obstacle (e.g. Fisher et al. 1993). In this setting the flow can decouple, and a higher density strata could develop at the base (Valentine 1987). Topographic obstacles can block the dense basal flow that will move downhill, while the upper, still dilute part of the flow surmounts the topographic obstacle, as documented at the Soufri`ere Hills Volcano, Montserrat (e.g. Cole et al. 1998; Calder et al. 1999).
The underestimation of this phenomenon caused several casualties in the 1991 Mt. Unzen eruption (Nakada and Fujii 1993).
While ignimbrite deposits can only record the very last stage of the depositional stage of a pyroclastic flow, the current approach is to attempt retrieving information from the depositional facies to interpret the fluid dynamics of the flow.
Also along the path, external influence, like the change in the substrate topography, or internal changes in physical parameters like particle concentration, temperature of the gas-particle mixture, fluidization, can modify the rheological behaviour (Freundt and Bursik 2001).
Furthermore, the changes of eruption dynamics, which involve waxing and waning of the eruption rate and of flows, as well as the interplay with the topography may lead to complex progradational and retrogradational phases, resulting in forestepping-backtepping stacking patterns of the internal architecture of ignimbrites (DeRita et al. 1998; Giordano 1998).
2.3. Emplacement temperatures
Determination of pyroclastic flow emplacement temperature can provide a strong constraint on the transport and depositional system (Porreca et al. 2003a; McClelland et al. 2004; Gurioli et al. 2005; Porreca et al. 2006; Giordano et al. 2008). The emplacement temperature of a pyroclastic flow is related to a complex combination of factors such as the initial magmatic temperature, adiabatic decompression, transport path through the atmosphere (including whether the eruption column is buoyant, or boiling-over), adiabatic decompression, and heat loss from the flow during lateral transport (e.g. Bardot, 2000) due to the interaction of the flow with air and water (e.g. Cas and Wright 1987, Branney and Kokelaar 2002).
Conditions at the vent and along flow, such as mass flux and velocity, influence the capability of the flow to entrain air, which in turn, together with the grain size distribution, control the runout distance (Bursik and Woods 1996). The physical parameters on which mobility depends are still debated, but air entrainment (and consequently temperature) is certainly a good candidate, together with eruption rate, grain size distribution, hill slope, and topographic confinement (Bursik and Woods 1996).
The temperature of emplacement of pyroclastic flow deposits therefore represents one of the most important measurable physical parameters, which can be related to the pyroclastic flow mobility, with important implications for hazard assessment.
Paleomagnetic methods represent a reliable tools for determining emplacement temperature in ancient ignimbrites (McClelland et al. 2004). Many studies have been performed applying paleomagnetic methodology, beginning with the pioneering study of Aramaki and Akimoto 1957) that used thermal remanent magnetization (TRM) on the bulk ignimbrite deposit to estimate the emplacement temperature.
The same technique was then extended to lithic clasts incorporated into ignimbrites (Wright 1978; Hoblitt and Kellogg 1979; Kent et al. 1981; McClelland and Druitt 1989; Bardot 2000; Porreca et al. 2003a; McClelland et al. 2004; Porreca et al. 2006) and to pumice clasts (McClelland et al. 2004). Using thermal magnetization of lithic clasts, emplacement temperatures have been estimated for several well-known small to large volume ignimbrites, including the 79 AD eruption of Vesuvius (180-380°C, 7 km from the vent, Cioni et al. 2004; 140-300°C within and around Pompeii, Zanella et al. 2007), the 1630 BC eruption of Santorini (200-≥580°C McClelland and Druitt 1989; 400-≥580°C at 11 km from vent, Bardot 2000), the 1883 AD eruption of Krakatau (475-550°C, subaqueous pyroclastic flow 8 km from the vent; Mandeville et al. 1994), and the 1.8 Ka eruption of Taupo ( 150-≥580°C at
more than 40 km from vent, McClelland et al. 2004). The lowest reported emplacement temperatures are interpreted to have resulted from interaction with external water (<100°C, McClelland et al. 2004; <140°C, Porreca et al. 2006), air (Cioni et al. 2004) and urban structures (Gurioli et al. 2005, Zanella et al. 2007).
Temperature estimates along the flow path provide additional information about the degree and extent of heat loss along the flow and the extent of flow interaction with external media (water and air). McClelland et al. (2004) estimated equilibrium emplacement temperatures at 400°-500°C for the 1.8 Ka Taupo eruption (bulk volume 30 km3), up to 50 km from the source. In contrast, in proximal facies less than 30 km from the source, the emplacement temperature was evaluated to be between 150° and 300°C. This variation was interpreted, in combination with field evidence, as being due to be due to interaction of early, proximal flows with lake water that occupied the old caldera depression.
From direct measurements of 1980 Mount St. Helens activity, Banks and Hoblitt 1981) found that the ash cloud temperature dropped initially, while in the ash column, but temperature was largely maintained in the pyroclastic flow. They found an initial drop in temperature of 100°C, from a magmatic temperature of 950°C (Banks and Hoblitt 1981, and references therein) during the first air interaction phase in the convecting column, and a second drop to about 700°C in the first hundreds of meters from the vent. The temperature of the pyroclastic flow then remained constant up to 8 km from the source.
Furthermore, the temperature of the pyroclastic flow at the moment of deposition has also strong influences on post emplacement processes, such as welding. The glassy material, once deposited, may still show ductile behavior that can develop, along a steep topography, features consistent with rheomorphic flows.
The welding process occurs through sintering, compaction and flattening of the pyroclasts, depending on various parameters, which are still in debate. Compositional changes, load of the overlying material, volatile content, grain size population, lithic content are all factors that variably determine the occurrence of welding (e.g. Freundt 1998; Branney and Kokelaar 2002). Quane and Russell (2005) ranked welding intensity in six ranks (I-VI), defined by discrete ranges in physical properties (including porosity, density, point load strength, uniaxial compressive strength, pumice lapilli oblateness and microfabric orientation) and macroscopic and microscopic textural characteristics. Petrographic characteristics vary from the unconsolidated, incoherent ash matrix, with randomly oriented pumice lapilli lacking any deformation of Rank I to the obsidian-like vitrophyre with eutaxitic texture and obsidian like fiamme of Rank VI.
Welding structures, being related to ductile behavior of glassy shards, are strongly dependent on glass transition temperature of the materials, and therefore are particularly useful in defining upper-boundary temperature limit for non-welded deposits.
Determination of paleo-emplacement temperatures for very large volume pyroclastic flow deposits, including temperature variations with transport distance, has not yet been determined.
2.4. Magnetic fabric and flow directions
Another strong constraint, besides temperature estimation, on which studies about density currents have been based, is the fabric analysis of the different facies of pyroclastic flow deposits, which may help characterizing the evolution of the pyroclastic flow in space and time.
The fabric of an ignimbrite is therefore related to the sum of various different factors acting during the deposition from a pyroclastic flow, such as the grain size distribution of each component, the density of the gas-particle mixture, the behaviour of the depositional and transport systems and of the boundary layer between them (Cas and Wright 1987; Branney and Kokelaar 1992; Branney and Kokelaar 2002).
The analysis of the magnetic fabric of an ignimbrite, based on the study of the anisotropy of magnetic susceptibility (AMS), is considered a reliable tool as a proxy of the rock fabric (Ellwood 1982; Rochette et al. 1992; Porreca et al. 2003a; Giordano et al. 2008; LaBerge et al. 2008; Pioli et al. 2008). The AMS is related to the anisotropy of the shape and structure of the magnetic crystals or to the spatial arrangement of the crystal. As each analysis is based on samples of 10 cm3 the results are more representative than a single thin section, less time consuming and allows the fabric analysis in visually isotropic rocks (e.g. Rochette et al. 1992). Anyhow, the direct comparison between the AMS and petrofabric are quite scarce (Rochette et al. 1992; Plenier et al. 2005).
The analysis of the magnetic fabric have been applied on different settings such as on plutons (e.g. Grégoire et al. 1998; Talbot et al. 2000), dykes (Raposo 1997; Rapalini and de Luchi 2000; Aubourg et al. 2002; Porreca et al. 2003a; Porreca et al. 2003b), lava flows (Herrero-Bervera et al. 2002; Cañón-Tapia and Castro 2004), and volcanic avalanches (Schneider and Fisher 1991).
Ignimbrites flow directions are usually determined by measuring the preferred orientation or imbrication of elongate elements carried in the flow itself or picked up along the flow path, such as crystals, lithic fragments or pumices (e.g. Suzuki and Ui 1982; Schmincke and Swanson 1967), welding fabric (Kamata and Mimura 1983) or tree logs orientation (Froggatt
et al. 1981). The use of welding lineation can be misleading in the determination of flow direction as it can be produced by stretching of fiamme during secondary mass flowage (e.g. Wright 1980).
In volcanic environment the AMS method have been applied mainly to infer the source of a deposit and in the analysis of flow direction and (Ellwood 1982; Incoronato et al. 1983; Knight et al. 1986; MacDonald and Palmer 1990; Hillhouse and Wells 1991; Seaman et al. 1991; Ort 1993; MacDonald et al. 1998; Ort et al. 1999).
The AMS have been applied also to retrieve information about transport and depositional processes (Fisher et al. 1993; Le Pennec et al. 1998; Palmer and MacDonald 1999; Porreca et al. 2003a; Porreca et al. 2003b; Gurioli et al. 2007; Giordano et al. 2008). Baer et al. (1997) related the ignimbrite directions with respect to topographic obstacles, to the turbulence of the flow and to the coupling between the transport and the depositional system.
In this work are presented the results and implication of the emplacement temperatures and flow directions determination carried out on the Cerro Galàn ignimbrites, NE Argentina. The emplacement temperatures were estimated on the Cerro Galán ignimbrite and on the other older ignimbrites belonging to the Toconquis Group by means of paleomagnetic techniques applied on accessory and/or accidental lithic clasts embedded within the deposits. The thermal structure of these deposits, from proximal to distal locations, and at different stratigraphic heights, were studied in order to constrain the transport and emplacement mechanisms and define the extent of interaction with external “cooling” factors such as the atmosphere, ground water, surface water, and ground surface in an arid environment. Moreover we define the magnetic fabric and the flow directions at various azimuth around the caldera, in proximal and distal sites and at different stratigraphic heights by the analysis of the anisotropy the magnetic susceptibility of the ignimbrite matrix.
Paleomagnetic methodologies are therefore applied to help understand emplacement conditions and transport dynamics in very large volume pyroclastic flows.
3. Geological setting and sedimentological features of the Cerro Galán ignimbrites
The Cerro Galán caldera is one of the largest calderas in the world, with a 38 x 26 km N-S elongated structure, located in the southern margin of the Puna plateau in NW Argentina and ~200 km south of the extensive Altiplano-Puna Volcanic complex (APVC; de Silva 1989) (Fig. 3.1). The caldera lies on a major N-S trending graben fault zone, the Diablillos-Galán Fault Zone (Coira et al. 1993, Kay et al 2008), at the intersection with a major NW trending regional Archibarca lineament (Salfity 1984; Viramonte et al. 1984). The caldera is characterized by a large central resurgent dome that exposes the uplifted intra-caldera Cerro Galán ignimbrite, and several post-ignimbrite lava domes (Sparks et al. 1985).
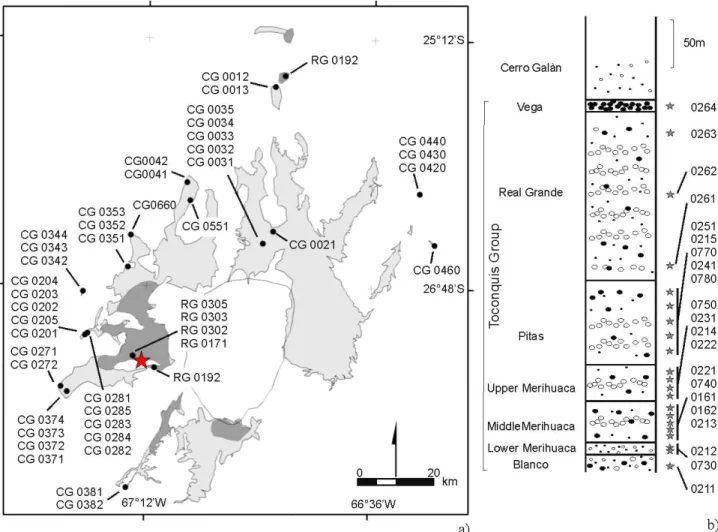
Fig. 3.1 - Location of Cerro Galán caldera in the Puna plateau, north-western Argentina. a) main structural features of central Andes (modified after Riller et al. 2001). APVC: Altiplano Puna Volcanic Complex; b) Cerro Galàn area (enlargement of red square in a). Color composition of Landsat ETM+ (band 7, 4, 2). The Cerro Galàn ignimbrite is contoured in light brown; the black solid lines represent the inferred caldera collapse faults (Folks et al submitted-a); the dashed line follows the topographic caldera rim. Red star: location of Fig. 2a section.
The regional stratigraphy, described in early works by Francis et al. 1983 and Sparks et al. 1985) has been recently revised (Folkes et al. submitted-a) and is summarized in Table 3.1. Nine distinct outflow ignimbrites are recognized, including two newly identified ignimbrite units in the Toconquis Group (the Pitas and Vega ignimbrites).
Early ignimbrites of the Toconquis Group are underlain by fall deposits, whereas the Cerro Galàn ignimbrite is not. The seven ignimbrites belonging to the Toconquis Group (5.60-4.51 Ma), exposed in a 200m section at Rio Las Pitas, Vega Real Grande (Fig. 3.2a) are largely
massive and chaotic, ash-matrix supported, crystal-rich (up to 50 vol.%) and generally lithic poor (<5 vol.%), except for the Vega ignimbrite which bear up to 25% of lithics. All the ignimbrites are pumice rich (20-40%), and the Pitas and Real Grande ignimbrites contain pumice concentration zones with individual pumice clasts up to 1m in diameter. All the Toconquis Group ignimbrites lack welding textures. The currently-preserved areal extent of the Toconquis Group ignimbrites is about 260 km2, with a total volume of 630 km3 (DRE) inferred by Folkes et al. submitted-a). The highly welded Cueva Negra unit, present only on the eastern flanks of the caldera, is not investigated by this study.
40 Ar/39ArAge Cerro Galan 2.56+-0.05 Cueva Negra 3.68+-0.08 Vega 4.51+-0.11 Real Grande 4.64+-0.08 Pitas 4.84+-0.04 UpperMerihuaca 5.49+-0.11 MiddleMerihuaca 5.56+-0.10 LowerMerihuaca 5.60+-0.20 Blanco / Quiescence Period 0.8 Ma T o c o n q u i s G r o u p Quiescence Period 0.65 Ma Ignimbrite Quiescence Period 1.1 Ma
Table 3.1 - Cerro Galán system stratigraphy and 40Ar/39Ar analyses (Folkes et al., 2009, submitted Bull Volc)
The Cerro Galán ignimbrite is the most recent and voluminous ignimbrite (~550 km3 DRE), erupted at 2.16 Ma (Folkes et al. submitted-b)from the Cerro Galán caldera. The CGI outflow sheet extends to 35 km in all directions from the present caldera, with a maximum runout distance of 74 km to the north of the current topographic margin, where the deposit is 15 m thick (Gonzales, 1984). The CGI covers a preserved areal extent of 2160 km2.
Although rarely visible, the relationship with the underlying topography is valley-ponding (Fig. 3.2b). Vapor phase alteration and columnar jointing are common, especially where the ignimbrites are confined in paleovalleys (Wright et al. submitted-a, and Fig. 3.2c). No veneer facies have been described associated with the CGI (Cas et al. submitted), and the relationship with paleotopography is commonly onlap. The ignimbrite is rhyodacitic in composition, largely characterized by massive facies and up to 200 m thick; it is extremely crystal-rich (35-45 % of matrix volume), pumice-poor (<10 %) and lithic-poor (<5 %) (Fig. 3.2d-e).
Petrographic analyses carried out by Folkes et al. submitted-b) show a mineral assemblage consisting in plagioclase > biotite > quartz > apatite > magnetite > ilmenite > zircon > titanite > monazite, in decreasing order of abundance. Amphibole and sanidine are also present in minor proportion.
Fig 3.2 - a) Toconquis Group and Cerro Galán ignimbrite at the Rio Las Pitas locality, Vega Real Grande section (yellow star in Fig 1); b) Valley pond facies of CGI. Note the flat topped surface (Curuto locality, 27 km west of the caldera); c) columnar jointing at Curuto; d-e) typical facies of CGI from the base (d) to the top (e) characterized by low pumice (<10 %) and lithic (<5 %) content (Aguas Calientes locality, sites 0031 and 0035; cfr. Tab 3); f) CGI basal contact with the underlying Ordovician metasediments (Curuto locality). Note the relevant presence of rip-up clasts; g) enlargement of previous picture showing imbricated rip-up clasts. Cited localities are in Fig 3.1b
Regarding the magnetic mineralogy assemblage, Fe-Ti oxides represent the majority of opaque minerals, comprising between 0.9 – 1.6 % of the total juvenile clast volumes. This population consists exclusively of magnetite (Usp10-19) and ilmenite (Hem21-25) (Folkes et al.
submitted-b).
Petrographic analyses show an up–sequence decrease in crystal content in the most recent ignimbrites (vesicle-free; from 55% to 45%), a decrease in amphibole and possibly biotite. Chemical analyses indicate a remarkable overlap in the composition of all ignimbrites with 69-71% SiO2, 5-8% K2O, 1-1.5% MgO (Folkes et al. submitted-b). Geothermometry and
geobarometry indicate that magma had pre-eruptive temperatures between 770° and 900°C at pressures of 1.4-2.7 kbar (i.e. max 10 km depth). The CGI magmatic temperatures are constrained at 790°-830°C. Evaluation of viscosity of melt (crystal free) at conditions reasonable for the CGI (density of rhyodacitic magma at 2.46 g/cm3; 3-4%H2O; 3 kb;
800°-850°C) give figures of 106-107 Pa-s (Folkes et al. submitted-b).
4. Temperature estimation by paleomagnetic method
In this section are described the paleomagnetic principles and techniques applied to define the emplacement temperatures of the Cerro Galàn and Toconquis formation ignimbrites. The analyses were carried out on the accidental or accessory lithics embedded in the ignimbrites during the emplacement process.
Laboratory applications were carried out at the Paleomagnetism laboratory at Geological Science Department, Roma 3 University, and at the Swiss Federal Institute of Technology (ETH), in Zurich, in collaboration with Prof. Ann Hirt.
4.1. Methodology
The emplacement temperature of pyroclastic flows can be estimated using paleomagnetic methodologies performed on lithic clasts embedded within pyroclastic deposits (McClelland and Druitt 1989). Lithic fragments can be present in various amounts in pyroclastic density currents, either picked up from magma chamber or conduit walls (accessory lithics), or ripped up along the flow path (accidental lithics). If clasts contain magnetic minerals, generally Fe-Ti oxides, and are heated up, then they can acquire a new magnetization, as a function of the heating temperature. Magnetic minerals are classified into three major groups depending on how they respond to an external magnetic field: diamagnetic, paramagnetic and ferromagnetic. In diamagnetic minerals an applied external field determines magnetic moment in the opposite direction of the external field, which disappears when the field is removed.
The susceptibility, which is the proportional parameter between the applied field and the resulting momentum, is proportional to the applied field and negative. All the materials are diamagnetic, but as the answer is weak, it is masked by paramagnetic or ferromagnetic behavior, when present. Typical diamagnetic minerals are quartz and calcite. Paramagnetic minerals show a magnetic moment parallel to the direction of the applied field that disappears as the field is removed, as in the case of diamagnetic minerals. The susceptibility of paramagnetic minerals is positive and depends on the temperature. The magnetization of a paramagnetic material increase with the applied up to the saturation, but it is contrasted by the internal thermal energy following the Curie law:
K=C\T
where K is the susceptibility, T the absolute temperature and C the Curie constant, which is characteristic for each material.
Ferromagnetic minerals give rise to a magnetic field even in the absence of an applied field, due to the internal. This magnetization is called remanent or spontaneous magnetization and it is caused by strong interactions between neighboring spins at atomic level. The susceptibility of a ferromagnetic substance depends on the temperature as in the paramagnetic case, following the Curie-Weiss law:
K=C\T-Tc
where K is the susceptibility, T the absolute temperature, C the Curie constant and Tc the Curie constant, characteristic of each crystal type. Above the Tc, the interactions disappear
entirely and the material becomes paramagnetic.
When lithic clasts are incorporated into high temperature pyroclastic flows, i.e. higher than the Curie temperature of the magnetic minerals present in the lithic clasts (e.g. 580°C for magnetite), the original magnetization will be completely removed. A new magnetization, oriented parallel to the Earth’s magnetic field at the time of emplacement, will be acquired by the clast when its temperature decreases below the blocking temperature (Tb). The Tb is the
temperature below which the relaxation of the magnetization becomes slow compared to the investigated time scale, i.e. the TRM is frozen in at Tb during cooling in the presence of a
magnetic field (e.g. Dunlop and Özdemir 1997). Therefore, in clasts embedded in a high temperature pyroclastic density current, a single magnetic component will be detected, which is parallel in all clasts (Fig.4.1a).
Fig 4.1 - Schematic representation of re-magnetization processes in lithic clasts. a) The ignimbrite emplacement temperature Te is higher than the Curie temperature (Te>Tc) of the magnetic minerals of
the lithic clast. The clast will carry a single component magnetization vector oriented along the Earth magnetic field present during cooling; b) the emplacement temperature is lower than the Curie temperature(Te<Tc). The clast will carry two components: a randomly oriented high temperature
(HT) component and a low temperature (LT) component oriented along the Earth magnetic field (modified after Porreca et al 2008)
When lithic clasts are incorporated into a pyroclastic flow at an intermediate temperature, between the ambient and Curie temperature of the magnetic minerals present in the clasts, they will lose a portion of their original magnetization. This occurs at the unblocking temperature (Tub) of the magnetic minerals present in the clast, which, for rapidly cooled
flows, is the temperature at which the TRM is lost during laboratory heating. This unblocking temperature is equal to or lower than the maximum temperature of the deposit. During the cooling of the deposit, the clast will acquire a new partial thermoremanence (pTRM), which will partially overprint the original magnetization. In this case, the clast will be characterized by the presence of two components of magnetization: an original, randomly oriented high temperature component and a young low temperature component that is homogenously oriented parallel to the Earth’s magnetic field at the time of the deposit emplacement (Fig. 4.1b).
The progressive demagnetization technique emulates the natural processes in the opposite direction, heating the samples from ambient to the Curie temperature (Tc) and measuring the
magnetic remanence at each step. The demagnetized clasts can present one or two components of magnetization. In the case of two components of magnetization, the
intersection temperature of the two components is an estimate of the emplacement temperature, whereas in the case of single component oriented parallel to the expected magnetic field, the emplacement temperature will be higher than the unblocking temperature (Tub) for each clast.
To validate the use of paleomagnetic techniques for determination of ignimbrite emplacement temperatures, a statistical analysis of clast orientations must be completed and the potential presence of an overprinting magnetic signature must be evaluated. The process of blocking and unblocking of the magnetization of a lithic clast is a probabilistic process. Grains that are unblocked during the natural heating process may not be similarly unblocked during laboratory heating due the difference in time scale between the natural and laboratory processes. In this case, it is important to demagnetize a large number of clasts to produce reliable, significant statistics.
Furthermore, the paleomagnetic signature can be altered by the effects of chemical overprinting (chemical remanent magnetization, CRM) due to field or laboratory alteration, (McClelland-Brown 1982; McClelland and Druitt 1989) and by the exposure to the Earth’s magnetic field at ambient temperature for a long time (viscous remanent magnetization, VRM). Either or both processes can take place in some clasts, producing new magnetic components that may be erroneously interpreted as partial thermal magnetizations (pTRM) and could lead to false temperature estimations. Moreover, both the CRM and the VRM magnetizations vary strongly as a function of various parameters, such as magnetic mineralogy and grain size. Lithic clasts in the Cerro Galan ignimbrite are very heterogeneous in lithology, and the origin of low-T components could vary for each case.
In order to identify the main magnetic carriers and recognize possible chemical magnetic overprint, we have performed a series of rock magnetic measurements on selected samples, which will be described in the next sections.
Finally, in order to distinguish between VRM and pTRM, we follow the approach of Bardot and McClelland (2000) in using the magnetite nomograph by Pullaiah et al. (1975) to determine the relationship between the unblocking temperature (Tub) of a VRM as a function
of time. The Pullaiah nomograms refer to SD magnetite, and in the presence of MD magnetite the Tub is underestimated. Anyhow they equally provide a minimum value for the
emplacement temperature. The relationship is expressed as:
and is valid for magnetite-bearing components with acquisition times between 102 and 106 years. Being the investigated ignimbrites more than 2 Ma old, they have been subjected to a continuous geomagnetic field for the last 780 Ka (i.e. during Brunhes epoch). In this case, the Tub of VRM is limited to this period and therefore, following the relationship given by Bardot
and McClelland (2000), it can not be higher than 165ºC.
Therefore, all the low-temperature components with Tb<165°C may be potentially due to
VRM and are therefore not considered here for temperature estimations. Components with Tb>165°C are valid for estimation of partial thermal remagnetization (pTRM).
4.2. Lithics sampling and TRM laboratory procedures
The sampling strategy was planned to evaluate changes in flow emplacement temperature with distance from the vent and with vertical position in the flow deposits. We sampled a total
Fig. 4.2 - Sampling site locations. a) The areal extent of the Cerro Galán ignimbrite is shown in light gray; in dark gray is the areal extent of the underlying Real Grande ignimbrite. CG: Cerro Galán ignimbrite; RG: Real Grande ignimbrite;. b) Stratigraphic log of the >250m section at Rio Las Pitas, Vega Real Grande section (red star symbol); sampling sites along the log are represented by gray stars
of 301 oriented clasts from 18 localities (Tables 4.1-4.2); 125 samples were from the Toconquis Group and 176 from the Cerro Galán ignimbrite. The samples were collected from proximal to distal localities (up to 52 km), and, in the case of the CGI, at variable azimuth from the vent (Fig. 4.2). The Toconquis Group ignimbrites were largely sampled at Rio de las Pitas, Vega Real Grande (star in Fig. 4.2a), located 12 km west of the caldera in a >250 m thick section of ignimbrites.
In particular, the Real Grande ignimbrite was sampled at Vega Real Grande and in other three localities, i.e. 500 m NW and SE Vega Real Grande, along Rio de las Pitas, and on the eastern slopes of Cerro Ratones, 55 km N of the caldera (Fig 4.2a). For clarification, we use the word locality to identify a single point on a 1:25.000 map while a site is an outcrop of about 1 m2, where lithic clasts were sampled.
Samples were collected at different heights in the CGI in order to identify temperature stratifications. At Aguas Calientes, a proximal locality N of the caldera, five sites (0031-0035) were sampled vertically from a 58 m thick section; in Antofagasta 4 sites were sampled from a 15 m thick section (0371-0374) and at Puntas Gordas and Los Nacimientos, 3 sites were sampled from 35 and 20 m thick sections, respectively (0342-0344 and 0351-0353 respectively). Site locations are in Fig. 4a and sections height and distances from caldera rim are reported in Tab. 4.2, for each site.At Paycuqui, five sites were sampled at each of two sections (0201-0205 and 0281-0285). Finally, three sites were sampled in the CGI subunits at the distal locality of Tacuil (sites 0420, 0430 and 0440). The clast population is variable in lithology, including dominant plagioclase-phyric dacite clasts, found in almost all outcrops, and subordinate metavolcanics, metasediments, quartzites and amphibolites. In most cases, the lithic clast lithologies reflect the lithologies of the substrate upon which the ignimbrite was emplaced. The substrate is dominated by slightly deformed Ordovician rocks (metavolcanics, mica-schists, and low grade metasediments) in the western sector and by lower Paleozoic crystalline units in the eastern sector (granitoids and orthogneisses; Kay et al. 2008). Plagioclase-phyric dacites (ppd) are not encountered in outcrop outside the caldera, and its ubiquitous presence can be related to a proximal emplacement of dacitic lavas around the caldera or to an intracaldera dome.
We therefore conclude that, excluding ppd clasts, lithic clasts are mostly accidental, ripped up from the ground surface during transport of the flow, and the proportion of clasts that are inferred to originate from the chamber walls or the conduit margins is small. This association is particularly useful for TRM studies of the emplacement temperatures of ignimbrites, because the acquired TRM of accidental clasts is related to the pyroclastic flow temperature
and not to lengthy pre-heating in the conduit. Lava clasts and metavolcanics were preferentially sampled over other lithic types because they are more common and provide more reliable paleomagnetic results than other lithologies; they represent 60% and 20% of the total sampled lithologies, respectively. Average clast sizes in the deposit range from 0.5 to 10-15 cm.
At each site we sampled from 3 to 10 clasts (Tables 4.1, 4.2), except in case of very low lithic percentages (<1% of deposit) where less than 3 clasts were sampled. The strike and dip of each clast were measured in the field with a magnetic compass. The magnetic deviation induced by the deposit on the compass was tested and was determined not to influence the paleomagnetic study, i.e. the identification of the number of components of magnetization and their orientations with respect to the geocentric axial dipole (GAD) geomagnetic field. Most of the clasts were not larger than 4 cm, with an average diameter of ∼1.5 cm. For some larger clasts (5 to 20 cm in diameter), subsamples were cut from the core and rim to evaluate the presence of a temperature gradient within biggest clasts. The oriented clasts (or subsamples of clasts) were embedded in white non-magnetic plasticine, which was placed into a rigid plastic cylinder with standard dimensions (diameter φ=25 mm, height h=22.5 mm) in the laboratory, following the procedure adopted by Cioni et al. (2004). Paleomagnetic analyses and rock magnetic analyses were performed at the Paleomagnetic Laboratory of University of Roma Tre; rock magnetic analyses of some representative samples were also carried at the Paleomagnetic Laboratory of ETH-Zurich.
In order to identify the mineralogy of the main magnetic carriers and to assess whether any mineralogical alteration has affected our temperature estimates, we have performed rock magnetic analyses on 15 representative samples (except thermomagnetic analyses, which were performed on 14 samples). The analyzed samples were obtained by eight dacites, four metavolcanics, two metasediments and a quartzite clast. Rock magnetic measurements include (a) determination of isothermal remanent magnetization (IRM), that allows the definition of the saturation field and the coercivity of remanence (Hcr); (b) thermal unblocking
of a composite three-component isothermal remanent magnetization (composite IRM), that allows to identify the contribution of the soft, medium and hard coercivity mineral fractions, and the relative mineralogical phases; and (c) thermomagnetic analysis of high-temperature magnetic susceptibility measured in air, in order to identify the Curie Temperature of the main magnetic carriers and to detect any mineralogical alteration during heating. The rock analyses are performed on powdered samples, and only six out of fifteen lithic clasts were large enough to allow the cutting of samples both for rock analysis and TRM analysis.
The conditions for determination of isothermal remanent magnetization (IRM) include a progressive increase in the imposed magnetizing field, using an ASC-Impulse Magnetizer, and the measurements of the remanent magnetization at each incremental step by a JR-6A spinner Magnetometer. Samples were firstly saturated in a 2000 mT magnetic field along the -z sample direction and then an IRM was acquired stepwise, in nine steps from 50 mT to 2000 mT, in an antipodal field (+z). This procedure provides information on the field needed to saturate the magnetization as well as the coercivity of remanence (Hcr’). The three-component
IRM was then thermally demagnetized in thirteen steps on the same samples, according to the procedure reported by Lowrie (1990). Maximum, intermediate, and minimum magnetic fields of 120 mT, 600 mT, and, 1700 mT respectively, were applied to the x, y, and z axes of the samples.
In order to define the Curie temperature of the magnetic minerals and to exclude the presence of thermal mineralogical alteration, magnetic susceptibility was measured as a function of temperature in air, from room temperature to 700°C, in a heating-cooling cycle on ~2cm3 of powdered sample. This kind of measurement was made using AGICO CS-2 furnace apparatus.
Finally, the textural relationships between magnetic and not-magnetic mineral phases were determined using thin sections of eight representative lithic samples, selecting the most common lithologies (dacite, metavolcanics, metasediments, and quartzites).
The natural remanent magnetization (NRM) was measured using a JR-6A Spinner Magnetometer on 301 specimens. Six of these specimens were also analyzed for magnetic rock determination and in other five clasts two specimens were obtained from each one, at the rim and core of the clast. Thermal demagnetization was carried out using an external field shielded furnace with residual fields <10nT in 13 to 17 thermal steps, reducing the temperature steps from 50° to 20°C at higher temperature. Magnetic susceptibility was also measured at each thermal step by the KLY-3 Kappabridge instrument to detect any possible mineralogical changes during the heating process.
Magnetic remanence data were plotted on a Zijderveld orthogonal demagnetization diagram (Zijderveld 1967) and the Remasoft 3.0 software was used to identify the principal magnetic components (Chadima and Hrouda 2006). The number of remanence components was defined by evaluating maximum angular deviation (MAD) values of the each single vector. A maximum of 10° was accepted as a limit of reproducible result for a single component. Paleomagnetic mean directions for each site and ignimbrite unit are made applying Fisher statistics (Fisher 1953). The best estimates of the dispersion, k, and the
direction reliability evaluated at the 95% confidence level, α95, have been also calculated for
each ignimbrite unit.
4.3. Lithics magnetic mineralogy - results
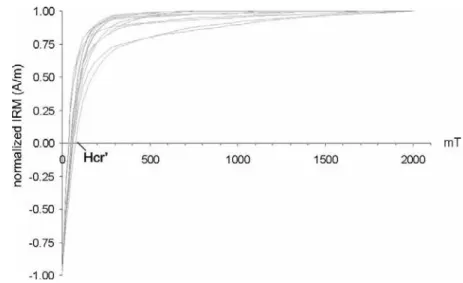
The acquired IRM curves for our samples show a rapid increase in IRM over the low magnetic field range (Fig. 4.3). Furthermore, the magnetic saturation (where the normalized IRM value equals 1.0) of most samples is reached at fields lower than 600-800 mT (Fig. 4.3). This behaviour is characteristic of low-coercivity magnetic grains, such as titanomagnetite and/or magnetite (e.g. Dunlop and Özdemir 1997). In addition, the remanent coercivity (Hcr)
values of these samples ranges from 35 to 75 mT (Fig. 4.3), which typically represent values of low-coercivity minerals (Dunlop and Özdemir 1997). In contrast, four samples do not reach magnetic saturation at the maximum applied field (2000 mT), suggesting that these samples also contain high-coercivity
minerals, such as hematite. The remanent coercivity of these four samples is respectively 40, 75, 65 and 52 mT.
Using thermal decay of composite IRM and thermal
demagnetization we confirm the predominance
of low-coercivity minerals. The IRM values of the x, y, and z components (soft,
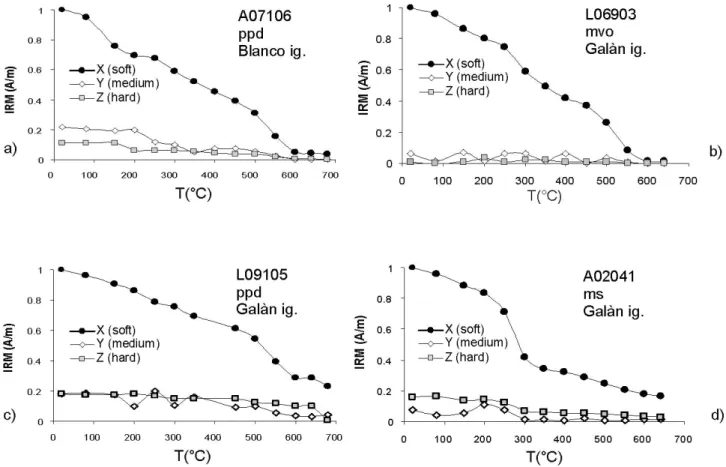
medium, and hard fractions) indicate the relative proportion of each component. Figure 4.4 shows that the soft fraction (coercivity <0.2T) predominates in all samples. Using thermal demagnetization, we find that this low-coercivity component is stable up to 580°C, indicating that magnetite is the main magnetic carrier (e.g. Dunlop and Özdemir 1997; Fig. 4.4a). Some samples are characterized by drops at both 580°C and between 350°C and 400°C (fig. 4.4b), suggesting the presence of magnetite/Ti-poor titanomagnetite and probably maghemite, respectively. Metasediment samples are characterized by a soft fraction decay at ~300°C, which could be related to the presence of iron sulphides (e.g. Weaver et al., 2002; fig. 4.4d and the relative thermomagnetic curve in Fig. 4.5f). Iron sulphides can be present as
Fig. 4.3 - Isothermal remanent magnetization (IRM) analyzed in fifteen representative samples. 95% saturation is reached at 350-400mT in most of the analyzed samples except in four samples that do not reach
Fig 4.4 - Representative composite IRM decay for four samples. The soft fraction prevails in all the fifteen analyzed samples. a) Soft fraction decay at 580°C is indicative of the presence of magnetite; b) smooth step at 300-400°C in the soft fraction can be indicative of maghemite and titanomagnetite c) the hard fraction is at about 20% of the soft fraction and decays at about 680°C revealing low content of hematite; d) the soft fraction decay by 40% at about 300°C can reveal the presence of iron sulphides as secondary magnetic mineral in metasediments. ppd: plagioclase phyric dacite; mvo: meta-volcanic Ordovician; ms: mica-schist
secondary minerals in metasediments as the shown sample (e.g. Weaver et al. 2002; Fig. 4.4d). The proportionally minor medium and hard fractions (up to 20% of soft fraction) generally remain stable up to 680°C (Fig. 4.4c), suggesting the presence of hematite in some samples.
The thermomagnetic curves made on 14 clasts confirm the presence of different minerals as a function of clast lithology (fig. 4.5a-f). One sample did not give reliable results. In the rest of the analyzed samples, the heating and the cooling curves are reversible, except in three samples. In these three samples, from different lithologies, the susceptibility of the cooling curve is remarkably higher than the heating curve, indicating that some oxidation has occurred during the heating process (e.g. fig. 4.5f). In twelve samples, the susceptibility drops to zero between 580-600°C, which is the Curie temperature of magnetite (fig. 4.5a-c). Five samples also show a susceptibility deflection at 300-400°C, indicating the presence of another, low Tb magnetic carrier, likely maghemite (fig. 4.5d). In two dacite samples, the
susceptibility drop occurs between 600°C and 620°C, confirming the presence of hematite as a magnetic carrier (fig. 4.5e).
Fig. 4.5 - Representative thermomagnetic curves. Most of the fourteen analyzed samples show good correlation between heating and cooling curves, indicating that there is no mineral formation during the heating process; steep decays represent Curie temperatures of magnetic minerals; a-b) Curie temperatures at 580°C indicate the presence of magnetite; c-d) deflection at 300-400°C can indicate the presence of maghemite; this behavior occurred in three dacites and two metavolcanics; e) Curie temperature at 620°C indicate the presence of hematite; f) peak at 580°C in the heating curve and abrupt increase in the cooling curve suggest new mineralogical phase growing during heating; this behaviour is shown by two samples. ppd: plagioclase-phyric dacite; bppd: black plagioclase-phyric dacite; mvo: meta-volcanic Ordovician; ms: mica-schist
4.4. Thermal Remanent Magnetization (TRM) data
The natural remanent magnetization (NRM) of all the analyzed samples, normalized to the standard 10 cm3 volume specimen, is highly variable, ranging from 2.4x10⁻³ to 79 A/m, where dacite samples show slightly higher values than other lithic types.
The remanent magnetization is usually removed at temperature >580°C and the paleomagnetic behaviour is stable in most cases. Four samples from the Toconquis Group and twenty samples from Cerro Galán Ignimbrite (Appendix I and II) show an instable behaviour and therefore have not been considered in the statistics.
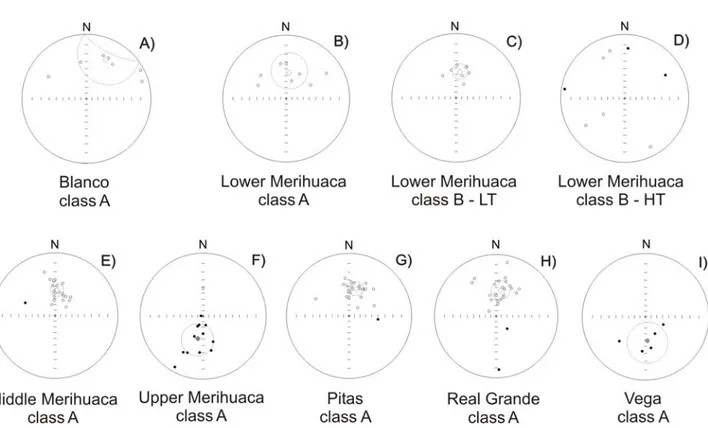
To discriminate between the magnetic signatures of different clasts, we classified the specimens by the number of magnetic components and their orientation, following the demagnetization pattern classification reported in McClelland et al. (2004) but using different class names. Class A specimens show a single magnetization component vector. Class B specimens show two components, one stable at high temperatures (HT component) and one at low temperatures (LT component). The LT component is consistent with the geocentric axial dipole (GAD) geomagnetic field, whereas the HT component is randomly oriented. The GAD at Cerro Galán today has an inclination of -22°; the 2.56 Ma Cerro Galán Ignimbrite (Folkes et al. this issue-a) is expected to have had a reversed polarity, producing positive inclination. For the Toconquis Group the expected magnetic polarity is variable for each unit; taking into account biotite 40Ar/39Ar ages of Folkes et al. (this issue-a), Blanco, Lower, Middle and Upper Merihuaca, and Vega Ignimbrites should have reverse polarity, whereas the Pitas and Real Grande Ignimbrites should have normal polarity (based on polarity subchrons of Gradstein et al. 2004).
4.4.1. TRM results for the Toconquis Group ignimbrites
The Toconquis Group includes seven ignimbrite units; each of them was analyzed by thermal demagnetization of lithic clasts. The NRM intensity varies from 2.4x10⁻³ to 0.2 A/m, with very few samples showing values up to 3 A/m. Individual sample results are shown in Appendix I, while composite results for each Toconquis unit are described below (Fig. 4.6; Tab. 4.3).
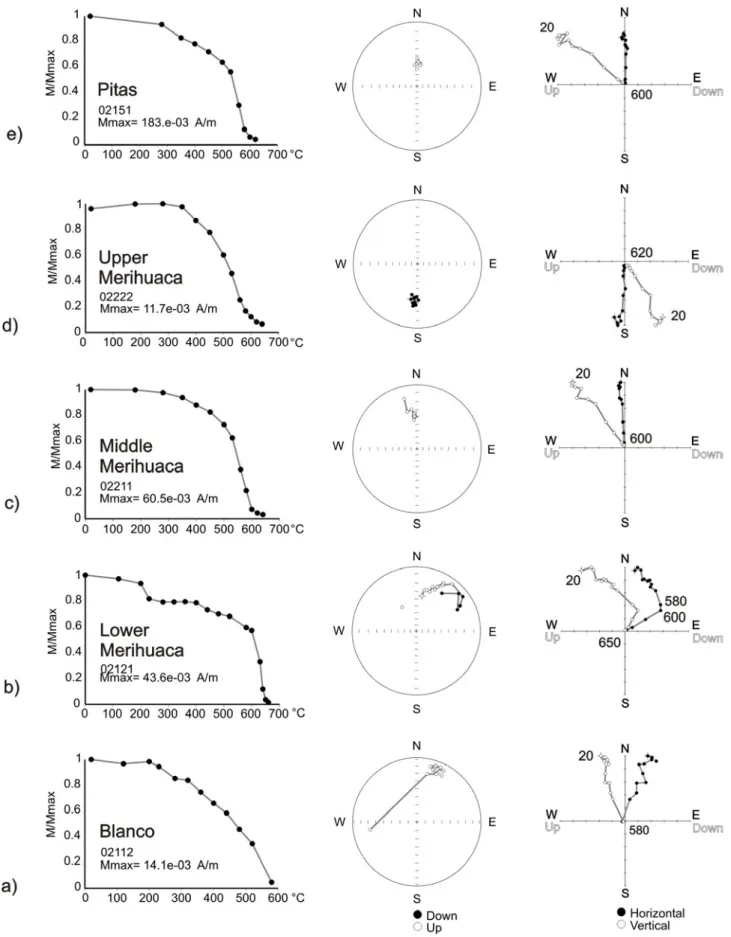
Fig. 4.6 - Thermal demagnetization data for some representative samples of Toconquis Group units (a-g). For each sample, intensity decay, equal area stereonet and Zijderveld diagrams are shown. (left) normalized intensity decay curve; (middle) equal area projection (solid dots: lower hemisphere; open dots: upper hemisphere); (right) orthogonal plots (Declination: black dots on the horizontal plane; apparent Inclination: white dots on the vertical plane). Sample references in Appendix I
Fig. 4.6 - continued
In the Blanco ignimbrite all seven demagnetized samples show a single magnetic component vector stable up to 580°C (Fig. 4.6a). Sub-samples from the core and rim of a 10 cm clast were also analyzed and both of the sub-samples show a single normally directed component, completely demagnetized (Tub) at 520°C. This component is upward oriented in
all clasts and its direction is almost close to the present geomagnetic field, thereby all clasts in the Blanco ignimbrite are classified Class A. The mean paleomagnetic direction for this unit is D=26.3°; I=-22°; (Fig. 4.7a). The high angle of α95 is due to poor number of analyzed clasts.
In the Lower Merihuaca ignimbrite, sixteen clasts were demagnetized. Half of these clasts show a single magnetic component, while the other half shows two magnetic components. The single component samples are completely demagnetized at temperatures between 530°C and 630°C and their direction is close to the current magnetic field (class A), with normal polarity. The mean paleomagnetic direction is D=6.3°, I=-45.4° (Fig. 4.7b). In the samples with two components of magnetization (Fig. 4.6b), the LT component is upward oriented with D=8.4° and I=-45.6° (Fig. 4.7c), whereas the HT component is randomly oriented (Fig. 4.7d). These samples are grouped as class B and the temperatures of separation between LT and HT components vary within a small range from 580° to 610°C. The emplacement temperature of the Lower Merihuaca unit can therefore be constrained in a range of 30°, while for all the other units the estimates are for a minimum emplacement temperature.
The twenty-six lithics sampled in the Middle Merihuaca ignimbrite show low NRM, less than 0.1 A/m. One sample did not give reliable results and therefore it was not used for
statistics. Twenty-four samples show a single component demagnetization vector (class A, Fig. 4.6c), while one sample shows two components (class B). Most of class A clasts are completely demagnetized at 580°C and their mean paleomagnetic direction is D=8 ° I=-44.9° (Fig. 4.7e).
In the Upper Merihuaca ignimbrite, twenty samples were thermally demagnetized, with four samples failing to yield stable demagnetization trajectories. Fifteen samples show a single component of magnetization oriented downward (i.e. reverse polarity), demagnetized between 580° and 620°C. The clasts are therefore classified as class A (Fig. 4.6d), and the orientation of the mean direction of this component is D=193.3°, I=49.9° (Fig. 4.7f). One sample shows two component demagnetization vectors. In this sample the temperature of separation between LT and HT components is in the range of 530-560°C and totally demagnetized at 590°C.
The Pitas ignimbrite was studied by the thermal demagnetization of twenty-five lithics. With one exception, all clasts were demagnetized at temperatures between 580°C and 640°C and show a single vector component (class A, Fig. 4.6e) directed D=15°, I=-42° (Fig. 4.7g).
The remaining sample is stable up to 650°C and shows two components of magnetization. The LTcomponent, stable up to 610°C is directed D=30° I=-38°.
Fig. 4.7 - Equal area stereonets of mean remanence directions of the Toconquis Group units (a-I). Open symbols are vectors projected into the upper hemisphere; filled symbols represent vectors projected onto the lower hemisphere. Small and large gray circles gray symbols are mean paleomagnetic directions and α95 ellipses
In the Real Grande ignimbrite, twenty-six samples were demagnetized. All the lithics show a single component demagnetization vector (class A, Fig. 4.6f), stable between 520°C and 630°C and oriented at D=9.7°, I=-44° (Fig. 4.7h).
Finally, the five lithic clasts sampled in the Vega ignimbrite show a single component demagnetization vector (class A, Fig. 4.6g) directed downward at D=175.8°, I= 48.6°(Fig. 4.7i) and stable up to 560°C.
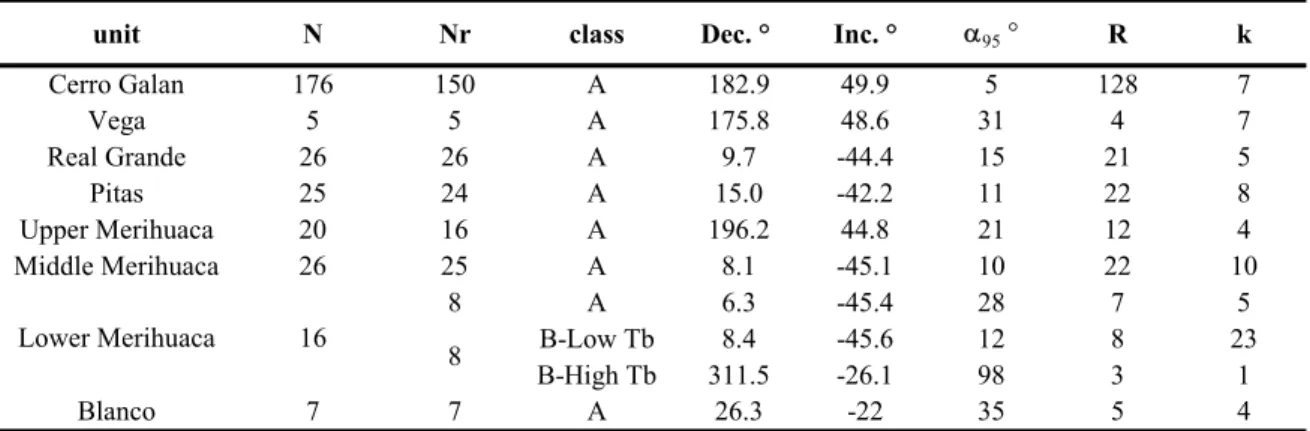
unit N Nr class Dec. ° Inc. ° α95 ° R k
Cerro Galan 176 150 A 182.9 49.9 5 128 7 Vega 5 5 A 175.8 48.6 31 4 7 Real Grande 26 26 A 9.7 -44.4 15 21 5 Pitas 25 24 A 15.0 -42.2 11 22 8 Upper Merihuaca 20 16 A 196.2 44.8 21 12 4 Middle Merihuaca 26 25 A 8.1 -45.1 10 22 10 8 A 6.3 -45.4 28 7 5 B-Low Tb 8.4 -45.6 12 8 23 B-High Tb 311.5 -26.1 98 3 1 Blanco 7 7 A 26.3 -22 35 5 4 8 Lower Merihuaca 16
Table 4.3 - Group statistics for Cerro Galán and Toconquis Group ignimbrites. Number of samples (N); number of reliable samples (Nr); classification (class); paleomagnetic mean direction (Dec; Inc), semi-angle of 95% confidence (a95), resultant length vector (R), and dispersion (k) are reported for each unit.
4.4.2. TRM results for the Cerro Galán ignimbrite
The NRM of the 176 analyzed lithic clasts from the Cerro Galán Ignimbrite range between 4x10⁻³ and 79 A/m. The principal component analysis applied to the thermal demagnetization results identified magnetization components with MAD usually less than 5°.
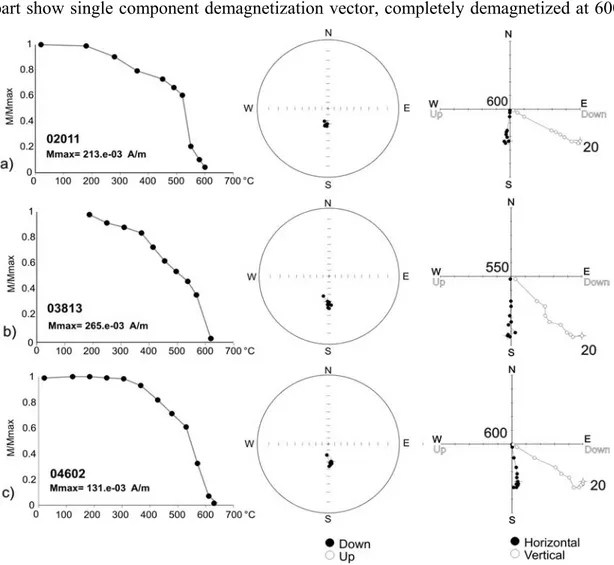
Most of the analyzed specimens, 150 out of 176 demagnetized clasts, show a single component demagnetization vector (class A; Fig. 4.8a-c). The mean direction of this component, shown in Figure 4.9, is well defined and oriented D=182.3° I=48.7°. The minimum and maximum demagnetization temperatures are 440° and 680°C respectively, but most of the samples (97%) are completely demagnetized between 520° and 620°C. Twenty-six specimens were not considered in the mean direction evaluation, as they showed anomalous demagnetization paths or did not demagnetize.
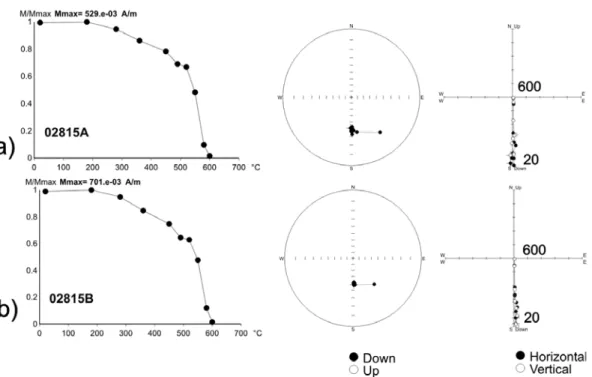
Four lithic clasts from the Cerro Galán ignimbrite were analyzed by TRM analysis at the rim and at the core (Fig. 4.10). In two clasts the core results are not reliable, while the external part show single component demagnetization vector, completely demagnetized at 600°C and
Fig. 4.8 - Representative intensity decay, equal area stereonet, and Z-plots of Cerro Galán ignimbrite TRM analysis. a-c) single component (class A) demagnetization vectors. Symbols as in
Fig. 4.9 - Equal area stereonets of the remanence directions of the Cerro Galán ignimbrite. Symbols as in Fig 9
550°C respectively. The other three samples show exactly the same behaviour at the core and rim, completely demagnetized between 580°C and 600°C with a single component
emagnetization vector.
4.5 d
Fig. 4.10 - TRM analyses from the core (a) and the rim (b) of a single lithic clast. The similarity of the single component vector directions and the
behaviour is homogeneous throughout the clast.
demagnetization curve show that the thermal
. Ages and polarity
The paleomagnetic directions obtained by the TRM analysis for the Cerro Galàn ignimbrite and the Toconquis group, were compared with the Ar/Ar ages determined on the biotite (Folkes et al, submitted) and the results are compared in the paleomagnetic scale of Gradstein et al. 2004) (Fig. 4.11). The Ar/Ar ages of the Merihuaca Fm correspond to the reverse C3r chron, which is concordant with the paleomagnetic results for the Upper Merihuaca ignimbrite, but discordant for the Lower and Middle Merihuaca. The Pitas ignimbrite show an
Ar/Ar age that is concordant with the paleomagnetic results, corresponding to the normal subchron C3n3n. The Real Grande and Vega ignimbrites correspond within error to the paleomagnetic results, assigning the ignimbrites to the subchrons C3n2n (normal) and C3n1r (reverse), respectively. The Ar/Ar ages for the Cerro Galàn Ignimbrite coincide with the rev
l. 1983; Sparks et al. 1985), the Pitas ignimbrite and Vega ignimbrite (Folkes et al. submitted)
erseC2r chron.
The dense sampling along the Vega Real Grande section supported the recognition of two units not documented by the previous field works (Francis et a
esults for the Toconquis fo ation and Cerro Galàn ignimbrite. Paleomagnetic scale by Gradstein et al., 2004.
Fig. 4.11 - paleomagnetic results. In red the biotite ages with error bars; in blue the TRM r rm
4.6. Estimation of the emplacement temperature
As described above all the ignimbrites of the Toconquis Group and the Galán ignimbrite, except the Lower Merihuaca unit, show a predominance of class A clasts, with unblocking temperatures ranging mostly between 520° and 620°C. Lower Merihuaca class B clasts allowed constraining the emplacement temperature of this unit between 580° and 610°C.
The temperature estimation at each single site is evaluated on the basis of clast classification. Clasts with viscous remanent magnetization (VRM) are either classified as class A or B on the basis of the behaviour at higher demagnetization step, and therefore we refer to the behaviour of the other components to set the emplacement temperature.
In class A clasts (with a single component of magnetization), the magnetization is stable up to the maximum blocking temperature of its magnetic minerals and its orientation does not change during heating process. This suggests that the clasts were heated to temperatures equal or higher than their maximum blocking temperatures. Emplacement temperatures that exceed the Curie temperatures of magnetic minerals present in the clasts cannot be defined by paleomagnetic techniques. For this reason, we estimate a minimum emplacement temperature on the basis of the laboratory unblocking temperature Tub, which mirrors the Curie
temperature distribution of class A clasts.
The fact that also the clasts locally ripped up from the substrate are in class A allows us to confirm that they were heated at temperatures higher than Curie temperatures during transport and after emplacement of ignimbrite, something which instead could be questioned for accessory lithics, since they may have been pre-heated within the conduit and may not reflect emplacement temperatures.
For those sites dominantly containing B clasts, the estimation of the emplacement temperature is constrained between the maximum temperature of the LT component and the minimum temperature of the HT component (McClelland and Druitt 1989). In the Lower Merihuaca ignimbrite, the separation of LT and HT components occurs in a very narrow interval, leading us to estimate an emplacement temperature between 580° and 610°C. In the same site, clasts with higher temperatures belonging to class A were probably heated at vent before being incorporated in the pyroclastic flow, preserving very high temperature at emplacement.
The frequency distribution of the Tub for all clasts from Cerro Galán ignimbrite is reported
in Fig. 4.12a. The majority of the Tub values (60%) are in the range between 540° and 580°C,
indicating that the main magnetic carrier is magnetite (Tc=580°C) or Ti-magnetite, as the
grain size (not investigated in this study) as shown by magnetic mineralogy analysis. The remaining 40% is equally distributed in the range of 500-540° and 600-620°C, indicating that the magnetic carriers in these clasts are titano-magnetite and hematite, respectively. We can therefore conclude that Cerro Galán ignimbrite was emplaced at temperature higher than the maximum unblocking temperature Tub of the samples, which is 620°C.
There is no variation of the Tub with distance from the caldera (R2 =0.3; Fig. 4.12b).
Furthermore, Tub does not vary with lithology, as shown in Fig. 4.12c. Modal Tub values lie
Fig. 4.12 - a) Frequency histogram of unblocking temperatures (Tub) for CGI. Most of the analyzed samples show
unblocking temperatures between 540-580°C; b) unblocking temperatures variation with distance; the best fit linear regression gives a slope of 1.2, but the values scatter is wide (r2 varies between 0-1 for individual points), the correlation coefficient is low (rvaries between 0-1 for individual points); and statistical significance is high (p << 0.1%); c) unblocking temperatures variation for the most representative lithologies.ppd: plagioclase-phyric dacite; bppd: black plagioclase-phyric dacite; mvo: meta-volcanic Ordovician; ms: mica-schist
between 540-580°C for all lithologies (in black dacites all Tub values lie between 540-580°C),
except for generic lava clasts (which exclude the plagioclase-phyric dacites), in which the mode of Tub values lies in the 500-540°C interval. As reported in the sampling section,
plagioclase-phyric dacites (ppd) is the most common lithology between the accidental clasts, though it is not encountered in outcrop outside the caldera. Its origin could be both from proximal lava outflows, ensuring low temperature before ignimbrite emplacement, or possibly from intracaldera dome or conduit. In this case the initial temperature of the clasts could have been higher than ambient temperature. This occurrence does not affect the results anyway, as the ppd unblocking temperatures and demagnetization vector directions are the same as the other lithologies.
The distribution of minimum emplacement temperatures of the Cerro Galán ignimbrite and Real Grande ignimbrite is shown in Fig. 4.13a.
Site emplacement temperatures are evaluated as the maximum Tub among the measured clasts
sampled at each site.
Fig. 4.13b shows Tubs for the Toconquis Group units. Unit emplacement temperatures are
defined as the maximum site Tub obtained for the unit, except for Lower Merihuaca where the
emplacement temperature (Te) interval is reported.
Fig. 4.13 - a) Site unblocking temperature (Tub) areal distribution for Cerro Galán ignimbrite and
Real Grande (RG) ignimbrite. Sites ID as in Fig. 4. Welding ranks for Cerro Galán ignimbrite (Ranks II-V) are represented in four gray levels, according to the ranking scheme of Quane and