Appendix B.
In this appendix we report the detailed graphs of the high frequency simulations for each mode.
B.1. Schematic simulation results
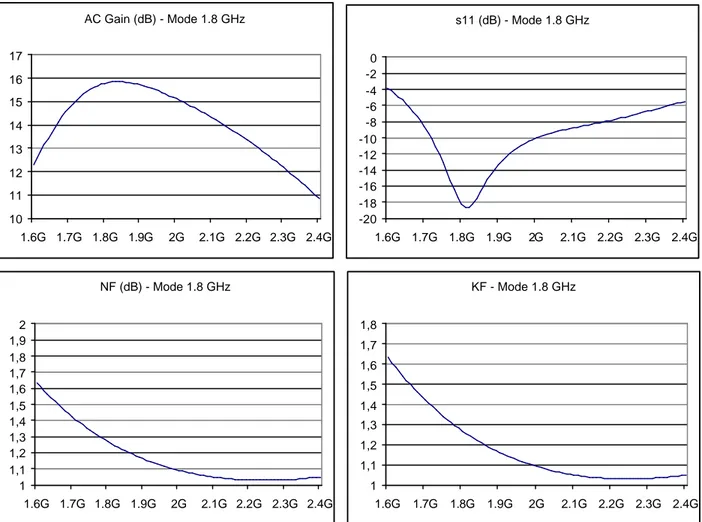
B.1.1. Mode 00 : 1.8 GHz HG
AC Gain (dB) - Mode 1.8 GHz 10 11 12 13 14 15 16 17 1.6G 1.7G 1.8G 1.9G 2G 2.1G 2.2G 2.3G 2.4G s11 (dB) - Mode 1.8 GHz -20 -18 -16 -14 -12 -10 -8 -6 -4 -2 0 1.6G 1.7G 1.8G 1.9G 2G 2.1G 2.2G 2.3G 2.4G NF (dB) - Mode 1.8 GHz 1 1,1 1,2 1,3 1,4 1,5 1,6 1,7 1,8 1,9 2 1.6G 1.7G 1.8G 1.9G 2G 2.1G 2.2G 2.3G 2.4G KF - Mode 1.8 GHz 1 1,1 1,2 1,3 1,4 1,5 1,6 1,7 1,8 1.6G 1.7G 1.8G 1.9G 2G 2.1G 2.2G 2.3G 2.4GIIP3 1.8 GHz High Gain -80 -70 -60 -50 -40 -30 -20 -10 0 10 20 30 -30 -25 -20 -15 -10 -5 0 Input (dBm) Output (dB) 1st order 3rd order 1 dB/dBm 3 dB/dBm CP1 1.8 GHz High Gain -20 -15 -10 -5 0 5 10 15 -30 -25 -20 -15 -10 -5 0 Input (dBm) Output (dB) Vout (dBV) 1 dB/dBm
Figure B.2 IIP3
, CP
1in 1.8 GHz HG mode
B.1.2. Mode 01 : 1.9 GHz HG
AC Gain(dB) - Mode 1.9 GHz 10 11 12 13 14 15 16 17 1.6G 1.7G 1.8G 1.9G 2G 2.1G 2.2G 2.3G 2.4G s11 - Mode 1.9 GHz -40 -35 -30 -25 -20 -15 -10 -5 0 1.6G 1.7G 1.8G 1.9G 2G 2.1G 2.2G 2.3G 2.4G NF Mode - 1.9 GHz 0,8 1 1,2 1,4 1,6 1,8 2 1.6G 1.7G 1.8G 1.9G 2G 2.1G 2.2G 2.3G 2.4G KF - Mode 1.9 GHz 1 1,1 1,2 1,3 1,4 1,5 1,6 1,7 1,8 1.6G 1.7G 1.8G 1.9G 2G 2.1G 2.2G 2.3G 2.4GIIP3 1.9 GHz High Gain -80 -60 -40 -20 0 20 40 -30 -25 -20 -15 -10 -5 0 Input (dBm) Output (dB) 1st order 3rd order 1 dB/dBm 3 dB/dBm CP1 1.9 GHz High Gain -20 -15 -10 -5 0 5 10 15 -30 -25 -20 -15 -10 -5 0 Input (dBm) Output (dB) Vout (dBV) 1 dB/dBm
Figure B.4 IIP3
, CP
1in 1.9 GHz HG mode
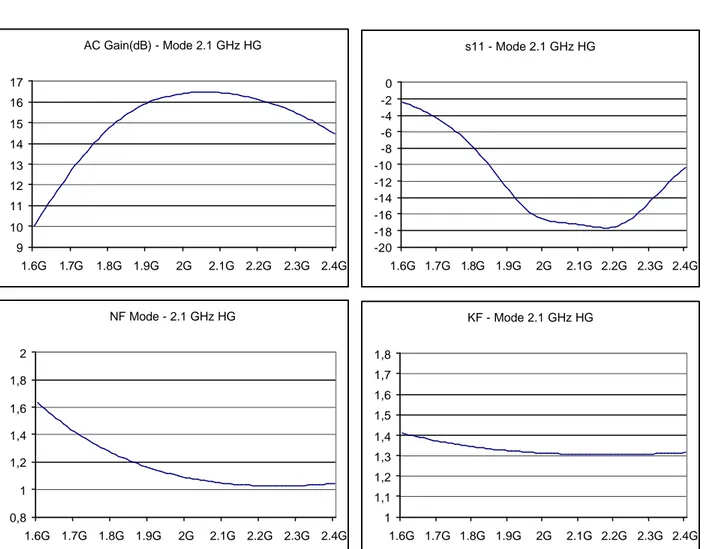
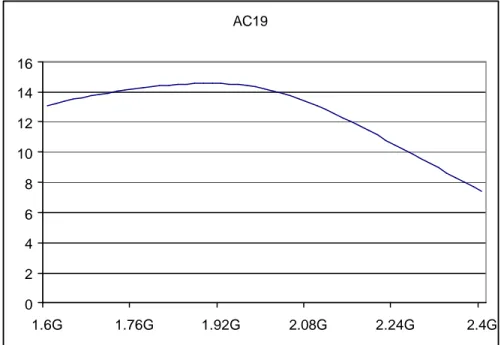
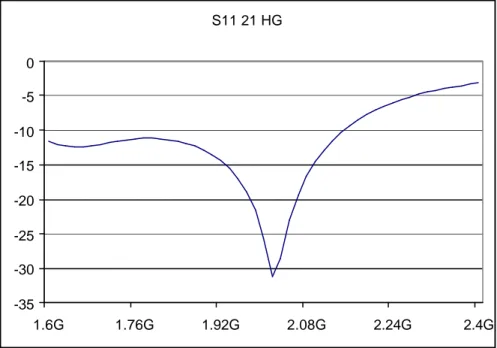
B.1.3. Mode 10 : 2.1 GHz HG
AC Gain(dB) - Mode 2.1 GHz HG 9 10 11 12 13 14 15 16 17 1.6G 1.7G 1.8G 1.9G 2G 2.1G 2.2G 2.3G 2.4G s11 - Mode 2.1 GHz HG -20 -18 -16 -14 -12 -10 -8 -6 -4 -2 0 1.6G 1.7G 1.8G 1.9G 2G 2.1G 2.2G 2.3G 2.4G NF Mode - 2.1 GHz HG 0,8 1 1,2 1,4 1,6 1,8 2 1.6G 1.7G 1.8G 1.9G 2G 2.1G 2.2G 2.3G 2.4G KF - Mode 2.1 GHz HG 1 1,1 1,2 1,3 1,4 1,5 1,6 1,7 1,8 1.6G 1.7G 1.8G 1.9G 2G 2.1G 2.2G 2.3G 2.4GIIP3 2.1 GHz High Gain -80 -60 -40 -20 0 20 40 -30 -25 -20 -15 -10 -5 0 Input (dBm) Output (dB) 1st order 3rd order 1 dB/dBm 3 dB/dBm CP1 2.1 GHz High Gain -20 -15 -10 -5 0 5 10 15 -30 -25 -20 -15 -10 -5 0 Input (dBm) Output (dB) Vout (dBV) 1 dB/dBm
Figure B.6 IIP3
, CP
1in 2.1 GHz HG mode
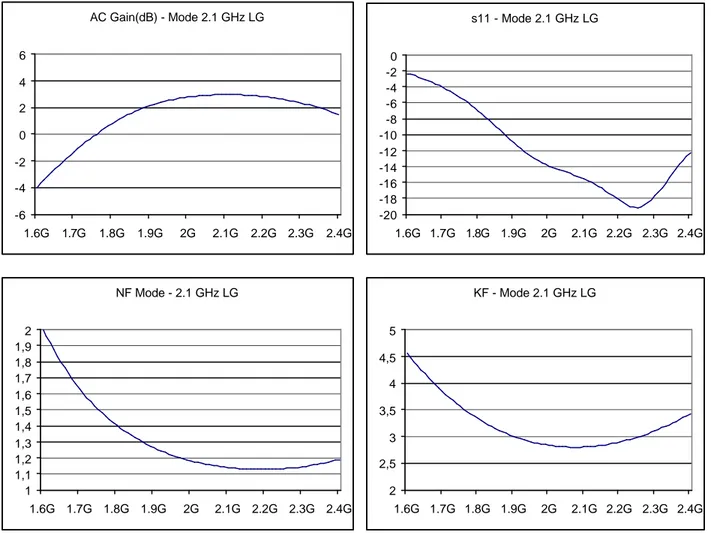
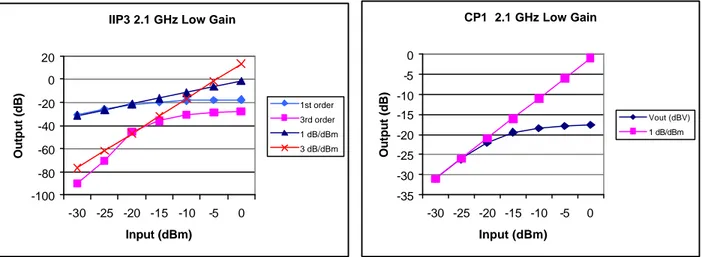
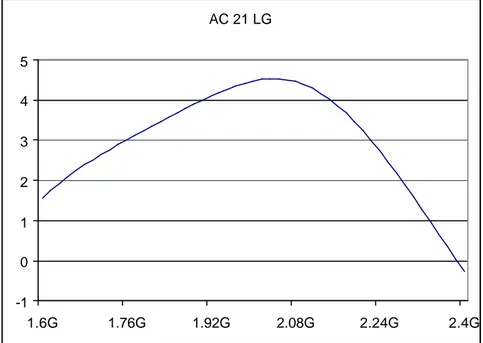
B.1.4. Mode 11 : 2.1 GHz LG
AC Gain(dB) - Mode 2.1 GHz LG -6 -4 -2 0 2 4 6 1.6G 1.7G 1.8G 1.9G 2G 2.1G 2.2G 2.3G 2.4G s11 - Mode 2.1 GHz LG -20 -18 -16 -14 -12 -10 -8 -6 -4 -2 0 1.6G 1.7G 1.8G 1.9G 2G 2.1G 2.2G 2.3G 2.4G NF Mode - 2.1 GHz LG 1 1,1 1,2 1,3 1,4 1,5 1,6 1,7 1,8 1,9 2 1.6G 1.7G 1.8G 1.9G 2G 2.1G 2.2G 2.3G 2.4G KF - Mode 2.1 GHz LG 2 2,5 3 3,5 4 4,5 5 1.6G 1.7G 1.8G 1.9G 2G 2.1G 2.2G 2.3G 2.4GIIP3 2.1 GHz Low Gain -100 -80 -60 -40 -20 0 20 -30 -25 -20 -15 -10 -5 0 Input (dBm) Output (dB) 1st order 3rd order 1 dB/dBm 3 dB/dBm CP1 2.1 GHz Low Gain -35 -30 -25 -20 -15 -10 -5 0 -30 -25 -20 -15 -10 -5 0 Input (dBm) Output (dB) Vout (dBV) 1 dB/dBm