MENICHINI M.(2012)-A MULTIDISCIPLINARY APPROACH TO DEFINE THE HYDROGEOLOGICAL MODEL OF AQUIFER SYSTEMS IN THE
"FIUME VERSILIA" CATCHMENT AND THE ADJACENT COASTAL PLAIN (NORTHWEST TUSCANY,ITALY).
4 – HYDROGEOLOGICAL-GEOCHEMICAL STUDY OF THE
COASTAL PLAIN AQUIFER SYSTEMS
The plain of Versilia has been object of some hydrogeological studies from the 80s to today (GIARDI et al., 1983, DUCHI & FERRARI, 1984; MUSETTI, 1985, FERRARI et al. 1987; SALVATORI, 1994, SALVATORI, 1997, TABBÌ, 1999; GIUNTINI, 1999; TESSITORE, 2002; PRANZINI, 2004, REGIONE TOSCANA, 2008). However, these studies, although represent a solid starting base, do not allow the formulation of a detailed conceptual model of the area of interest since have focused on some specific issues or only a portion of the study area.
The realization of a reliable groundwater numerical modeling, ultimate goal of this project, must be based on a detailed knowledge of the conceptual model of the aquifer system. To make a conceptual model a multidisciplinary approach, including geological, hydrogeological and geochemical-isotopic methods was adopted.
Aim of this chapter is therefore the formulation of a conceptual model using a multidisciplinary approach, through the use of geological and hydrogeological methods, discussed in section 4.1, together with geochemical and isotopic methods discussed in section 4.2.
The results obtained from the previous studies, mentioned above, were also presented and discussed because these make a solid base on which this work was set.
In particular the studies focused on defining the groundwater potentiometric surface and to determine the main water physicochemical parameters (temperature, conductivity, and pH) have allowed us to observe and assess the changes from 80s to today regarding the quantity and the quality of the aquifers of the Versilia plain. Among the recent the most important is that of the REGIONE TOSCANA (2008) which, through a monitoring network, homogeneously placed in the area of interest, allowed a monitoring from 2002 to 2008 not only the definition of the potentiometric surface, but also detailed measurements of the main physical and chemical parameters were obtained.
MENICHINI M.(2012)-A MULTIDISCIPLINARY APPROACH TO DEFINE THE HYDROGEOLOGICAL MODEL OF AQUIFER SYSTEMS IN THE
"FIUME VERSILIA" CATCHMENT AND THE ADJACENT COASTAL PLAIN (NORTHWEST TUSCANY,ITALY).
4.1 - GEOLOGICAL AND HYDROGEOLOGICAL CHARACTERIZATION
The first phase of this study deals with the definition of geological and hydrogeological characteristics of the aquifer systems and particularly focuses on the geometric reconstruction of the various horizons that made up the plain of Versilia. After consulting and analyzing some of the literature data (FEDERICI, 1993; DEVOTI et al. 2003; PUSCUCCI, 2005; BOSCHIAN et al., 2006), several hydro-stratigraphic sections were made to define the subsurface hydrostructural model. This phase of work has turned-out to be very complex and delicate because the available lithostratigraphic logs were insufficient and not always with reliable descriptions.
Once the hydrostructural model was set, the available stratigraphic data were implemented on Groundwater Modeling Software (GMS) through which it was possible to reconstruct the horizons that made up the aquifer system and then calculate the volumes.
The piezometric campaigns carried out during this thesis task (April and September 2009) will be presented and described later on. These were also compared with some potentiometric campaigns found in the literature and allowed to observe the changes in piezometric levels over time.
Finally the pumping test performed that helped to define the hydrodynamic parameters of the aquifer is described.
MENICHINI M.(2012)-A MULTIDISCIPLINARY APPROACH TO DEFINE THE HYDROGEOLOGICAL MODEL OF AQUIFER SYSTEMS IN THE
"FIUME VERSILIA" CATCHMENT AND THE ADJACENT COASTAL PLAIN (NORTHWEST TUSCANY,ITALY).
4.1.1 – Hydrostructural model and 3D reconstruction
The reconstruction of the hydrostructural model achieved by the interpretation and elaboration of the available subsurface information of the Underground Water Resources Database (BDSRI), integrated and updated all data provided by the Autorità di Bacino, the Provinces, AATO (Autorità Ambito Territoriale Ottimale) and water managers (Gaia srl).
In total over 500 stratigraphic logs are collected from the BDSRI and additional 93 obtained from Genio Civile della Regione Toscana, the company Gaia (Manager of the Integrated Water Service of Versilia) and freelance professionals. Although the stratigraphic information are many, in reality all collected data are not sufficient for an optimal reconstruction of the Versilia plain as their distribution in the territory is not homogeneous and often the wells do not reach a depth of 10 m. In addition, the terminology often used by drillers and/or professionals do not permit a precise reconstruction of the lithologies since lithological descriptions are often ambiguous and confusing. All the available stratigraphic data were then analyzed thoroughly in order to eliminate those considered to be insignificant in relation to their depth of investigation, quality and reliability of the data in order to have a filtered and selected database.
Later hydrogeological transverse and longitudinal to the coast sections were made to define the geometry and thickness of the various bodies that make up the aquifer system of the plains.
Once the hydrostructural model is defined, all the stratigraphic information was re-processed with the hydrogeological modelling software “Groundwater Modelling Software” (GMS) and a 3D model was reconstructed hence volumes of various horizons were calculated.
Hydrostructural model
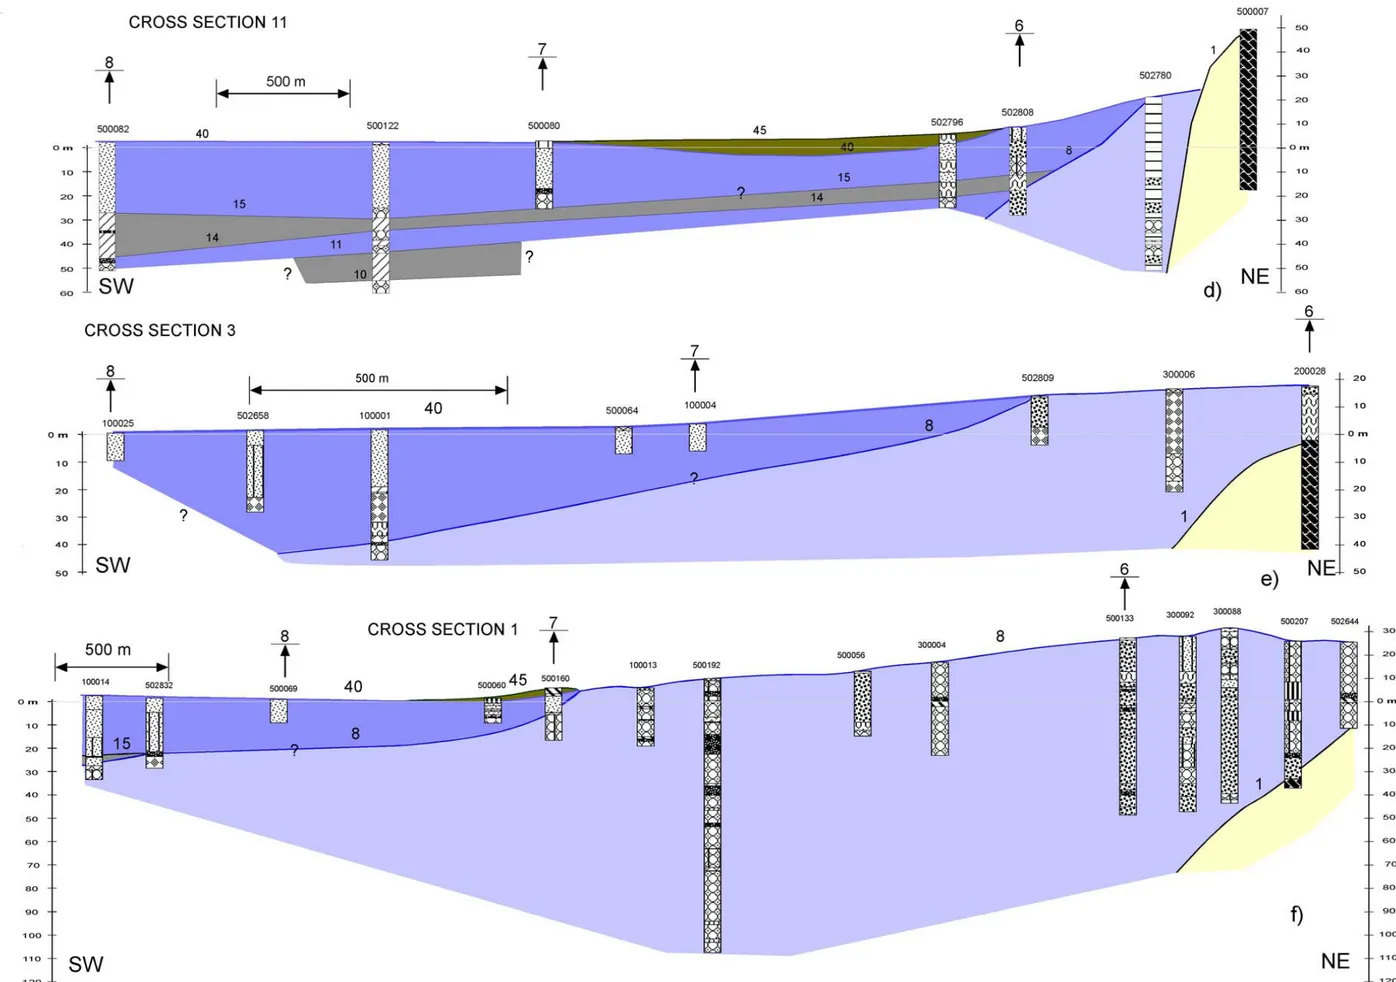
All the selected stratigraphic data were thoroughly analyzed and displayed using a specific project created with ESRI ArcView 3.2 (figure 4.1). This analysis allowed selecting the most reliable stratigraphic information and representative of the aquifer systems under study. This analysis allowed a further selection of the stratigraphic logs that are distributed fairly homogeneously and with more or less reliable lithological descriptions. These stratigraphic logs are used for the construction of 12 hydro-stratigraphic profiles, 3 longitudinal and 9 across with respect to the coastline (figure 4.2).
It is important to emphasize that, with the available data and considering the purpose of the study, the correlations made are purely hydrogeological.
MENICHINI M.(2012)-A MULTIDISCIPLINARY APPROACH TO DEFINE THE HYDROGEOLOGICAL MODEL OF AQUIFER SYSTEMS IN THE
"FIUME VERSILIA" CATCHMENT AND THE ADJACENT COASTAL PLAIN (NORTHWEST TUSCANY,ITALY).
In fact, having no micropaleontological, sedimentological, and petrographic information, it is not possible to identify depositional facies or biostratigraphic markers that can be used to make more precise stratigraphic correlations.
Figure 4.1 - Map made using the project in ArcView 3.2 to show and analyze all the available stratigraphic logs in the Versilia plane.
It was also decided to simplify as much as possible the geometry of the various horizons, where horizon means a superior limit of the hydrostratigraphic informal unit, depending mainly on the permeability of the aquifer.
The most important simplification was related to deposits in the inner part of the plain. In this case, these deposits consist of gravel, more or less clean with often an important silty matrix. In these deposits are often present lenses of finer material (sand, silt, clay, silty clay ...) in which it is very difficult to delineate their areal extent due to the poor stratigraphic information of the logs. This gravel rich body is characterized by an important heterogeneity with alternating of materials of very different particle size in a few meters intervals even if the dominant lithology is gravel. This heterogeneity and the lack of a lateral continuity of the lenses, constituted by finer material, could be due by natural erosion/accumulation of various alluvial fans that took turns during the different phases of eustatic fluctuations. So this body characterized by "chaotic and heterogeneous" with a predominance of gravel is considered as a single body, hereinafter referred to as "G".
MENICHINI M.(2012)-A MULTIDISCIPLINARY APPROACH TO DEFINE THE HYDROGEOLOGICAL MODEL OF AQUIFER SYSTEMS IN THE
"FIUME VERSILIA" CATCHMENT AND THE ADJACENT COASTAL PLAIN (NORTHWEST TUSCANY,ITALY).
Finally, a further consideration is made regarding depths of the stratigraphic logs. In the southern part of the Versilia plane, the stratigraphic logs reach considerable depths and then it was possible to reconstruct the multi-layer system, while in the northern part the stratigraphic log have generally depth less than 30m.
MENICHINI M.(2012)-A MULTIDISCIPLINARY APPROACH TO DEFINE THE HYDROGEOLOGICAL MODEL OF AQUIFER SYSTEMS IN THE "FIUME VERSILIA" CATCHMENT AND THE ADJACENT COASTAL PLAIN (NORTHWEST TUSCANY,ITALY).
MENICHINI M.(2012)-A MULTIDISCIPLINARY APPROACH TO DEFINE THE HYDROGEOLOGICAL MODEL OF AQUIFER SYSTEMS IN THE
"FIUME VERSILIA" CATCHMENT AND THE ADJACENT COASTAL PLAIN (NORTHWEST TUSCANY,ITALY).
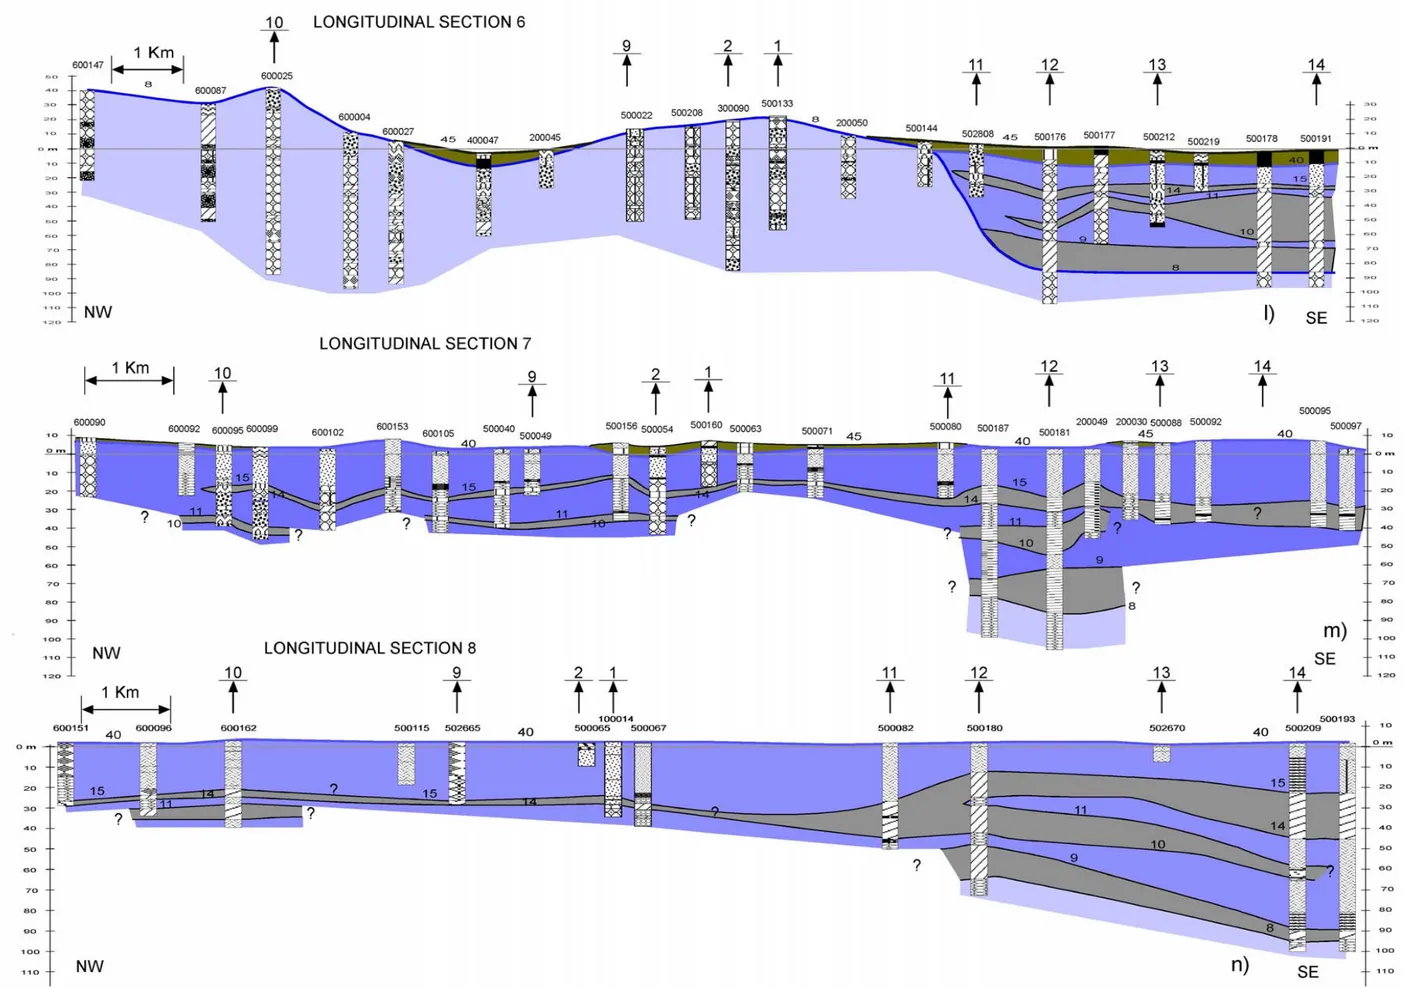
In the following figures the elaborated hydrostratigraphic section are reported, cross sections are listed from south to north (figures 4.3 a, b, c, d, e, f, g, h, i), while the longitudinal from mountain to the sea (figures 4.3 l, m, n) and finally, their legend is in figure 4.4. Vertical depth scale was exaggerated to display the details of the sections. Some numbers (1, 8, 9, 10, 11, 14, 15, 40 and 45) representing the identified roof surfaces of the various horizons are indicated in the sections.
Furthermore, the various hydrostratigraphic units are shown with different colours, the body G is represented with a blue colour lighter than that of the permeable horizons that make up the coastal plain formed mainly by sands and gravels with little or no matrix. The impermeable interlayers present between these horizons, consisting mainly of fine deposits such as clays and silts, are shown in gray, while the lagoon-lake deposits are indicated by a dark green colour. Finally, when present, the bedrock is indicated by a yellow colour.
Analysing the hydrostratigraphic sections, it is possible to see that the body G extends mostly in the inner parts of the coastal plain. The roof surface of this body is indicated by number "8". This horizon appears to include both ancient alluvial fan deposits referred to as (g) in the work of FEDERICI (1993) (see chapter 2), the successive and the recent alluvial deposits outcropping in the foothills. This body extends continuously throughout the area, deepening slightly towards the sea. Its greatest development occurs at the Versilia River alluvial fan (cross sections 1, 2 and 3), where the body reaches G the coastline at low depths.
This unit was considered as an aquifer with medium to high-medium permeability due to its important fine fractions content. Water circulation in the gravel can be locally split or otherwise affected by the presence of the clay-silt deposits of low permeability. This is a thick water-table aquifer in the inner plains, whereas in the coastal area it becomes locally artesian or semi-artesian aquifer where, to its roof, finer deposits separates it from the overlying sands.
The other horizons form up on the inner body just described in apparent “on lap position”. This configuration is a strong simplification of the geometry since the available data do not permit detailed considerations. In fact, the relationship between these horizons is certainly more complex with various interconnections between the various bodies due to erosions/accumulation during the sea level changes.
In particular in the southern area, besides the body G described above, three impermeable layers (hereafter referred to as "interlayer") and three other aquifers are identified. The deepest, whose roof is indicated by number 10 and denoted by the symbol S3, is separated from the body G and overhanging aquifer (S2, whose roof is indicated by the number 14) by a more or less continuous interlayer. A second interlayer separates
MENICHINI M.(2012)-A MULTIDISCIPLINARY APPROACH TO DEFINE THE HYDROGEOLOGICAL MODEL OF AQUIFER SYSTEMS IN THE
"FIUME VERSILIA" CATCHMENT AND THE ADJACENT COASTAL PLAIN (NORTHWEST TUSCANY,ITALY).
table aquifer, even if, locally becomes artesian aquifer where lacustrine deposits (whose roof is indicated by the number 45 and marked with the code P) lie above it.
This multi-layered system is reconstructed only in the southern part where there are deep stratigraphic logs and the interstratified layers have significant thickness and lateral continuity. In particular, the layer whose roof is indicated by number 9 appears to be present only in the southern area, while the layer indicated by number 11, even if only locally, is found in the northern area.
The aquifer S1 together with the body G are the main water-table aquifers of the coastal plane, well-developed and prominent. Locally, this aquifer has artesian characteristic where permeable deposits (P) lie above. Furthermore, when the interlayer does not show a lateral continuity, this superficial aquifer is in hydraulic connection with the deeper horizons S2 and S3 forming a single aquifer.
Overall, the aquifer is considered multi-level system due to the alternation of permeable and impermeable horizon even though locally the different aquifers are in hydraulic communication constituting a single aquifer. This is particularly true in the northernmost sector where the interlayers are discontinuous and have reduced thickness. Where the interlayers are continuous is likely also to consider the possibility of communication between the various horizons due to many multi-fenestrated wells.
MENICHINI M.(2012)-A MULTIDISCIPLINARY APPROACH TO DEFINE THE HYDROGEOLOGICAL MODEL OF AQUIFER SYSTEMS IN THE "FIUME VERSILIA" CATCHMENT AND THE ADJACENT COASTAL PLAIN (NORTHWEST TUSCANY,ITALY).
MENICHINI M.(2012)-A MULTIDISCIPLINARY APPROACH TO DEFINE THE HYDROGEOLOGICAL MODEL OF AQUIFER SYSTEMS IN THE "FIUME VERSILIA" CATCHMENT AND THE ADJACENT COASTAL PLAIN (NORTHWEST TUSCANY,ITALY).
MENICHINI M.(2012)-A MULTIDISCIPLINARY APPROACH TO DEFINE THE HYDROGEOLOGICAL MODEL OF AQUIFER SYSTEMS IN THE "FIUME VERSILIA" CATCHMENT AND THE ADJACENT COASTAL PLAIN (NORTHWEST TUSCANY,ITALY).
MENICHINI M.(2012)-A MULTIDISCIPLINARY APPROACH TO DEFINE THE HYDROGEOLOGICAL MODEL OF AQUIFER SYSTEMS IN THE
"FIUME VERSILIA" CATCHMENT AND THE ADJACENT COASTAL PLAIN (NORTHWEST TUSCANY,ITALY).
MENICHINI M.(2012)-A MULTIDISCIPLINARY APPROACH TO DEFINE THE HYDROGEOLOGICAL MODEL OF AQUIFER SYSTEMS IN THE
"FIUME VERSILIA" CATCHMENT AND THE ADJACENT COASTAL PLAIN (NORTHWEST TUSCANY,ITALY).
3D volume reconstruction
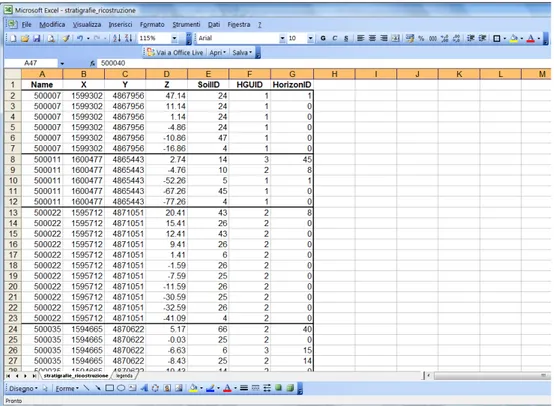
Once the hydrostructural conceptual model of the multi-layered system is defined, a database has been created through the use of specific codes and the information generated from this first phase is reported.
The first step consists in the simplification of the lithostratigraphic descriptions in a limited number of categories with the help of codes (table 4.1) filling the appropriate field "soilID" in the table (figure 4.5).
Table 4.1. Simplification codes of the lito-stratigraphic units
Code Litologia Codice Litologia
5 Sandstone 38 Silt
6 Clay 39 Clayey silt
7 Clay with blocks 40 Silt and clay 8 Pebbly clay 41 Silt and peat 9 Clay and gravel 42 Gravelly silt 10 Clay and silt 43 Sandy silt 11 Clay and peat 44 Peaty silt 12 Gravelly clay 45 Marble 13 Silty clay 46 Marl
14 Sandy clay 47 Mica schists and quartzite 15 Peaty clay 48 Quartzite
16 Block and gravel 49 Landfill waste 17 Calcare cavernoso 50 Rock
18 Dolomitic limestone 51 Sand 19 Anthropogenic ash 52 Clayey sand 20 Pebble and gravel 53 Cemented sand 21 Silty pebble 54 Sand with pebbles 22 Conglomerate 55 Sand and pebbles 23 detritus 56 Sand and conglomerate 24 Phyllite 57 Sand with gravel 25 gravel 58 Sand and silt 26 Clayey gravel 59 Sand and peat 27 Cemented gravel 60 Sand and gravel 28 Gravel with blocks 61 Gravelly sand 29 Gravel with pebbles 62 Silty sand 30 Gravel and clay 63 Peaty sand 31 Gravel and blocks 64 Schist 32 Gravel and pebbles 65 Substrate 33 Gravel and conglomerate 66 Terrain 34 Gravel and silt 67 Peat 35 Gravel and sand 68 Clayey peat 36 Silty gravel 69 Peat and clay 37 Sandy gravel 70 Sandy peaty
Based on the hydrostructural conceptual model and considering the granulometric characteristics and thickness of the deposits, a hydrogeological unit has been assigned to
MENICHINI M.(2012)-A MULTIDISCIPLINARY APPROACH TO DEFINE THE HYDROGEOLOGICAL MODEL OF AQUIFER SYSTEMS IN THE
"FIUME VERSILIA" CATCHMENT AND THE ADJACENT COASTAL PLAIN (NORTHWEST TUSCANY,ITALY).
each identified body. Each body was then defined as aquifer, interlayer and substrata, filling the field [HGUID] (hydrogeological Unit) of the database table (figure 4.5).
The hydrogeologic units named "substrata" and indicated with the number "1" corresponds to the real substrata of the multilayer system; the unit called "Aquifer" and indicated by number "2" corresponds to the permeable levels (G, S1, S2 and S3 in the previous paragraph); while the unit called "interlayer" and indicated by number "3" corresponds to low or no permeability levels that are intercalated between permeable layers or that make their cover.
The identification numbers of the different horizons, already indicated in previous hydro-stratigraphic profiles, were reported in the same database in the "horizon" field of the same table (figure 4.5). This value was assigned only to the most superficial layers belonging to hydrogeological units (HGUID) that allow a rapid selection of all points of the roof of a certain horizon and carryout the geometric interpolation to define the boundary surface.
Figure 4.5 - Table of database where SoilID, HUID and HorizonID for each stratigraphic log in study are reported
In particular, starting from the bottom, the following horizons characterized by various permeabilities are identified:
MENICHINI M.(2012)-A MULTIDISCIPLINARY APPROACH TO DEFINE THE HYDROGEOLOGICAL MODEL OF AQUIFER SYSTEMS IN THE
"FIUME VERSILIA" CATCHMENT AND THE ADJACENT COASTAL PLAIN (NORTHWEST TUSCANY,ITALY).
the order of tens of meters, with maximum values recorded in the vicinity of the alluvial fan of the Versilia River, and reaches great depths (over 100 m) particularly in the south where it is intercepted by some stratigraphic log wells.
Æ Horizon 9 represents the roof surface of a deep interlayer. This unit lies above the horizon 8 and is present only in the southern area of study with a thickness of about 15-20m. The roof surface is present at a depth of about 50 m below sea level.
Æ Horizon 10 represents the roof surface of the aquifer S3. This aquifer is present with variable thickness and depth in the entire area with the exception of the northern part. This horizon tends to reduce both in depth and thickness towards the north and toward the inland. In particular in the coastal zone it is present only in the south at a depth of about 90 m below the sea level with a thickness of 10-15 m, while in the central part it are can be found at a depth of 35 m with a thickness of several meters. While towards inland it tends to decrease its depth and its thickness and forms an unconformity contact with the superficial alluvial fans.
Æ Horizon 11 represents the roof surface of the intermediate interlayers. This horizon lies above the previous one and has the same trend; in fact, it tends to decrease its depth and its thickness from south to north and from the mountain feet to the coast. Its thickness is variable, probably, related to differential erosion and accumulation process depending on paleogeographic evolution.
Æ Horizon 14, represents the roof surface of the aquifer S2. This unit is present in the entire area and it tends to decrease its depth and thickness from south to north and from the sea to the inland. In particular in the southern area near the coast it can be found in more than 40 m depth with a thickness of more than 20 m, while in the north, near the coastline it is found at about 10 m depth with a thickness of few meters.
Æ Horizon 15, represents the roof surface of the shallow interlayers. This unit lies above the Horizon 14 and is present in the entire area. Its thickness tends to decrease from the sea towards mountains feet and from south to north. In some cases, its thickness is so small that it tends to disappear allowing the communication between the overlying with the underlying aquifers.
Æ Horizon 40 represents the roof surface of the aquifer S1. This aquifer outcrops in the whole area except where the lacustrine deposits are locally present (interlayer 45). The thickness of this aquifer varies from few meters to more than 20 meters, with a decreasing trend from the sea towards the mountains feet.
Æ Horizon 45 represents the roof surface the low permeability layer. This horizon has a maximum thickness of several meters but is limited only locally and almost negligible as compared to the S1 aquifer.
MENICHINI M.(2012)-A MULTIDISCIPLINARY APPROACH TO DEFINE THE HYDROGEOLOGICAL MODEL OF AQUIFER SYSTEMS IN THE
"FIUME VERSILIA" CATCHMENT AND THE ADJACENT COASTAL PLAIN (NORTHWEST TUSCANY,ITALY).
Summarizing this first phase, aimed at the volume reconstruction has permitted the creation of a database which lists all the stratigraphic logs present in the study area (appendix II), with their coordinates, corresponding depths, litho-type (soilID), a code indicator of their relative permeability (HGU IDs) and a number assigned for the geological horizon (figure 4.5).
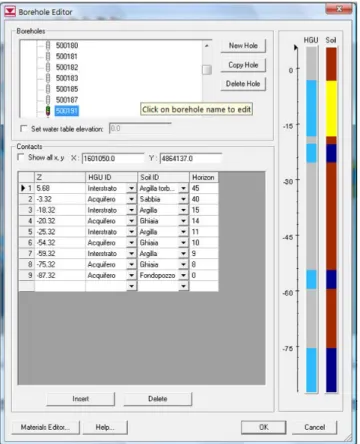
This database was used to implement the stratigraphic log in to the GMS hydrogeological modeling software to reconstruct and calculate the volumes of the multilayer aquifers. Figure 4.6 shows an example of a stratigraphy log imported into the software, containing all the horizons described above.
Figure 4.6 - An example of a stratigraphic log imported in to GMS with HGUID, SOILID and HorizonID code for the solid reconstruction.
After the implementation of the stratigraphic logs (figure 4.7a) in the hydro-stratigraphic sections, the hydrostructural conceptual models were directly made using the software GMS and following the above described procedures. The section network is gradually expanded with other selected logs in order to define the trend, extension and geometry of the identified hydro-geological unit (figure 4.7b).
Then for each horizon the domains of existence was defined and therefore it was possible to create a solid corresponding to various identified hydrogeological units (figure 4.7c).
MENICHINI M.(2012)-A MULTIDISCIPLINARY APPROACH TO DEFINE THE HYDROGEOLOGICAL MODEL OF AQUIFER SYSTEMS IN THE
"FIUME VERSILIA" CATCHMENT AND THE ADJACENT COASTAL PLAIN (NORTHWEST TUSCANY,ITALY).
Figure 4.7a – Implementation of selected and analyzed stratigraphic logs using the database of figure 4.5.
MENICHINI M.(2012)-A MULTIDISCIPLINARY APPROACH TO DEFINE THE HYDROGEOLOGICAL MODEL OF AQUIFER SYSTEMS IN THE
"FIUME VERSILIA" CATCHMENT AND THE ADJACENT COASTAL PLAIN (NORTHWEST TUSCANY,ITALY).
Figure 4.7c – Solid model and reconstruction of the multilayer system.
MENICHINI M.(2012)-A MULTIDISCIPLINARY APPROACH TO DEFINE THE HYDROGEOLOGICAL MODEL OF AQUIFER SYSTEMS IN THE
"FIUME VERSILIA" CATCHMENT AND THE ADJACENT COASTAL PLAIN (NORTHWEST TUSCANY,ITALY).
These solids were tested and validated by longitudinal and trasversal sections with respect to coastal line obtained by cutting reconstructed solids with appropriate cutting planes (figure 4.8).
In the figures the software distinguishes the impermeable interlayer (grey colour) by aquifer (blue colour) and fractured rock (yellow colour).
Volume calculation and granulometric composition of the hydrogeological units
The density and quality of information available, as mentioned above, do not allow reconstruction of a reliable model with a real geometry of the multilayers characterized by alternating beds of sand and gravel and lenses of silt-clay at their closures and are difficult to define if not arbitrarily. It is then decided to exaggerate as much as possible the continuity of the various permeable and impermeable units in order to obtain a reliable estimate of the total volumes.
In table 4.2, the total volumes of the hydrostratigraphic horizons obtained by reconstructions from the solid models are reported. Each hydrogeological unit is identified by the horizon number that represents the roof surface.
Table 4.2 – Volume (m3) of the solid model
reconstruction
Horizon ID Typology Volume (m3)
8 aquifer 1,240,029,205 9 aquitard/aquiclud 111,059,842 10 aquifer 246,916,839 11 aquitard/aquiclud 250,019,181 14 aquifer 499,211,196 15 aquitard/aquiclud 407,252,673 40 aquifer 1,090,668,536 45 aquitard/aquiclud 54,108,547
To define the percentage, with which the various grain sizes contribute to the composition of the various units, it is first necessary to calculate the total thickness from the stratigraphic log for the total volume analyzed and for each hydrogeological unit (table 4.3).
MENICHINI M.(2012)-A MULTIDISCIPLINARY APPROACH TO DEFINE THE HYDROGEOLOGICAL MODEL OF AQUIFER SYSTEMS IN THE
"FIUME VERSILIA" CATCHMENT AND THE ADJACENT COASTAL PLAIN (NORTHWEST TUSCANY,ITALY).
Table 4.3 – Thickness of each horizon extracted from the stratigraphic log. The number of stratigraphic logs that cross each unit and the mean thickness are also reported. Horizon ID Total thickness (m) % n° stratigraphic log Mean thickness (m) 8 1806 46.55 38 47.5 9 113 2.91 9 12.6 10 159 4.09 18 8.8 11 248 6.39 27 9.2 14 338 8.71 35 9.7 15 279 7.20 38 7.4 40 803 20.69 42 19.1 45 134 3.45 21 6.4 Total 3879 100
Considering the thickness and the simplified lithologies "soilID" of the stratigraphic logs selected with respect to the total thickness investigated, the total thickness and the percentage of each lithological class is calculated for the entire area (table 4.4) and for each hydrogeological units (table 4.5 a, b, c, d, e, f, g, h).
Table 4.4 – Total thickness and percentage of each lithological class of the entire area
grain size total thickness (m) %
Clay 478 12.3
Clay with blocks 2 0.1
Clay with pebbles 2 0.1
Clay and gravel 39 1.0
Clay and silt 103 2.6
Clay and peat 5 0.1
Gravelly clay 76 2.0
Silty clay 81 2.1
Sandy clay 64 1.7
Peaty clay 110 2.8
Pebbles and gravel 68 1.7
Silty pebbles 2 0.1
Conglomerate 98 2.5
Gravel 860 22.2
Clayey gravel 101 2.6
Cemented gravel 28 0.7
Gravel with blocks 16 0.4
Gravel with pebbles 3 0.1
Gravel and clay 37 1.0
Gravel and blocks 25 0.6
Gravel and pebbles 15 0.4
Gravel and conglomerate 21 0.5
MENICHINI M.(2012)-A MULTIDISCIPLINARY APPROACH TO DEFINE THE HYDROGEOLOGICAL MODEL OF AQUIFER SYSTEMS IN THE
"FIUME VERSILIA" CATCHMENT AND THE ADJACENT COASTAL PLAIN (NORTHWEST TUSCANY,ITALY).
Silty gravel 112 2.9
Sandy gravel 296 7.6
Silt 49 1.3
Clayey silt 20 0.5
Silt and clay 11 0.3
Silt and peat 3 0.1
Gravelly silt 75 1.9
Sandy silt 89 2.3
Sand 460 11.9
Clayey sandy 26 0.7
Sand and pebbles 2 0.04
Sand and conglomerate 17 0.4
Sand and gravel 55 1.4
Gravelly sand 13 0.3 Silty sand 149 3.8 Peaty sand 2 0.1 Peat 26 0.7 Sandy peat 3 0.1 terrain 59 1.5 Total 3879 100
By adding the lithological class in to the main grain size for the entire area (table 4.4) the following percentage from the most to the less abundant is obtained:
- gravel 47.9 % - clay 24.8 % - sand 18.7 % - silt 6.4%
- terrain and other 1.5 % - peat 0.7 %
Considering the lithological class thickness and percentage for each hydrogeological units (table 4.5 a, b, c, d, e, f, g, h) it is possible to observe that:
- horizon 8 contains most of the lithological classes, but the most abundant is gravel (28%) following by sandy gravel (13%) and clay (7%). It is important to note that by adding all the clay lithologies a value of 17.3% is obtained.
- horizon 9 is constituted almost exclusively by clay (92%);
- horizon 10 is constituted principally by gravel (39.7%) and conglomerate (12%); - the predominant grain size of horizon 11 is clay (58.4%);
- horizon 14 is constituted by 45.4% gravel, 22.2 % sand and 9.1 % gravel and sand, the other lithological classes have minor percentages;
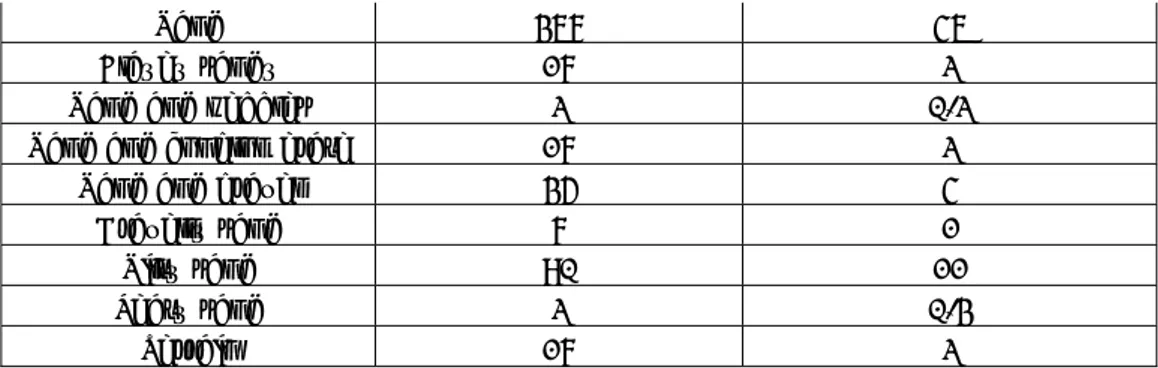
- the predominant grain sizes of horizon 15 are clay and silt, in particular 27% clay, 24% peaty clay, 10% silty clay, 7% silt and 7% silt and clay are present;
MENICHINI M.(2012)-A MULTIDISCIPLINARY APPROACH TO DEFINE THE HYDROGEOLOGICAL MODEL OF AQUIFER SYSTEMS IN THE
"FIUME VERSILIA" CATCHMENT AND THE ADJACENT COASTAL PLAIN (NORTHWEST TUSCANY,ITALY).
- the most frequent class for horizon 40 is sand (46%) followed by gravel (17%) and silty sand 11%. By adding all types of clay classes the percentage present in this unit is very low (2.2%);
- finally, the predominant lithology classes of horizon 45 are clay (15%), peaty clay (15%) and peat (18%). The other classes are generally low-permeability deposits;
Table 4.5a – Total thickness and percentage of each lithological class of the Horizon 8 (aquifer)
grain size total thickness (m) %
Clay 123 7
Clay with blocks 2 0.1
Clay with pebbles 2 0.1
Clay and gravel 2 0.1
Clay and silt 65 4
Gravelly clay 55 3
Silty clay 27 2
Sandy clay 10 1
Pebbles and gravel 68 4
Silty pebbles 2 0.1 Conglomerate 61 3 detritus 5 0.3 Gravel 502 28 Clayey gravel 76 4 Cemented gravel 28 2
Gravel with blocks 16 1
Gravel with pebbles 3 0.2
Gravel and clay 16 1
Gravel and blocks 25 1
Gravel and pebbles 3 0.1
Gravel and conglomerate 3 0.1
Gravel and silt 49 3
Gravel and sand 116 6
Silty gravel 82 5
Sandy gravel 236 13
Silt 2 0.1
Clayey silt 10 1
Silt and clay 8 0.4
Gravelly silt 50 3
Sandy silt 76 4
Sand and gravel 17 1
Gravelly sand 7 0.4
Silty sand 35 2
MENICHINI M.(2012)-A MULTIDISCIPLINARY APPROACH TO DEFINE THE HYDROGEOLOGICAL MODEL OF AQUIFER SYSTEMS IN THE
"FIUME VERSILIA" CATCHMENT AND THE ADJACENT COASTAL PLAIN (NORTHWEST TUSCANY,ITALY).
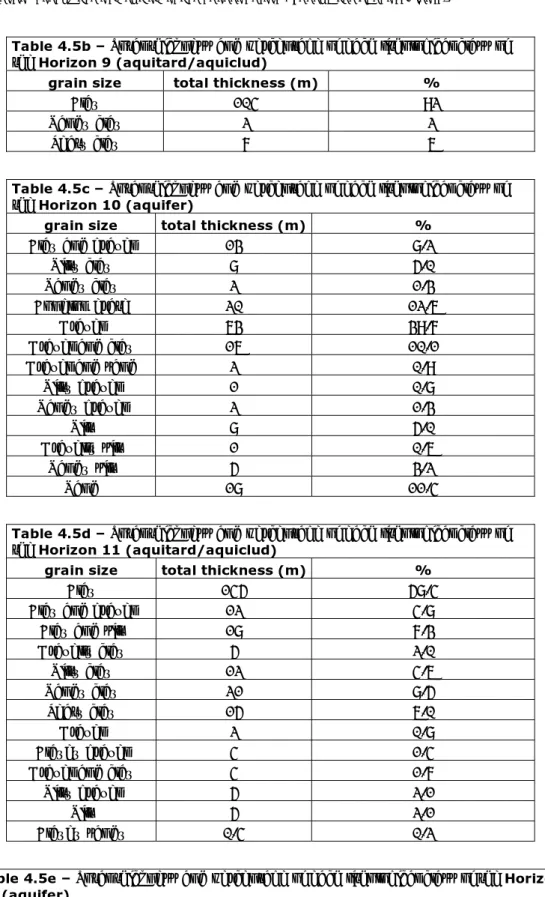
Table 4.5b – Total thickness and percentage of each lithological class of the Horizon 9 (aquitard/aquiclud)
grain size total thickness (m) %
Clay 104 92
Sandy clay 2 2
Peaty clay 7 6
Table 4.5c – Total thickness and percentage of each lithological class of the Horizon 10 (aquifer)
grain size total thickness (m) %
Clay and gravel 13 8.2
Silty clay 8 5.0
Sandy clay 2 1.3
Conglomerate 20 12.6
Gravel 63 39.7
Gravel and clay 16 10.1
Gravel and sand 2 0.9
Silty gravel 1 0.8 Sandy gravel 2 1.3 Silt 8 5.0 Gravelly silt 1 0.6 Sandy silt 5 3.2 Sand 18 11.4
Table 4.5d – Total thickness and percentage of each lithological class of the Horizon 11 (aquitard/aquiclud)
grain size total thickness (m) %
Clay 145 58.4
Clay and gravel 12 4.8
Clay and silt 18 7.3
Gravelly clay 5 2.0 Silty clay 12 4.6 Sandy clay 21 8.5 Peaty clay 15 6.0 Gravel 2 0.8 Clayey gravel 4 1.4
Gravel and clay 4 1.7
Silty gravel 5 2.1
Silt 5 2.1
Clayey sandy 0.4 0.2
Table 4.5e – Total thickness and percentage of each lithological class of the Horizon 14 (aquifer)
grain size total thickness (m) %
Clay 1 0.3 Gravelly clay 4 1.3 Silty clay 2 0.6 Sandy clay 10 3.0 Conglomerate 12 3.4 Gravel 153 45.4 Clayey gravel 3 0.9
MENICHINI M.(2012)-A MULTIDISCIPLINARY APPROACH TO DEFINE THE HYDROGEOLOGICAL MODEL OF AQUIFER SYSTEMS IN THE
"FIUME VERSILIA" CATCHMENT AND THE ADJACENT COASTAL PLAIN (NORTHWEST TUSCANY,ITALY).
Gravel and clay 1 0.3
Gravel and conglomerate 6 1.8
Gravel and sand 4 1.0
Silty gravel 7 2.0 Sandy gravel 31 9.1 Silt 1 0.3 Gravelly silt 11 3.2 Sand 75 22.2 Clayey sandy 7 2.0 Cemented sand 1 0.1
Sand and gravel 1 0.1
Silty sand 10 3.0
Table 4.5f – Total thickness and percentage of each lithological class of the Horizon 15 (aquitard/aquiclud)
grain size total thickness (m) %
Clay 77 27
Clay and gravel 12 4
Clay and silt 20 7
Gravelly clay 12 4 Silty clay 28 10 Sandy clay 2 1 Peaty clay 68 24 Gravel 4 2 Clayey gravel 2 1 Silty gravel 10 3 Silt 26 9 Clayey silt 3 1 Gravelly silt 5 2 Clayey sandy 2 1 Silty sand 9 3 Peat 2 1
Table 4.5g – Total thickness and percentage of each lithological class of Horizon 40 (aquifer)
grain size total thickness (m) %
Clay 8 1 Silty clay 2 0.2 Sandy clay 9 1 Conglomerate 6 1 Gravel 136 17 Clayey gravel 17 2
Gravel and pebbles 12 1
Gravel and conglomerate 12 1
Gravel and sand 8 1
Silty gravel 7 1
Sandy gravel 28 3
Silt and clay 3 0.4
Gravelly silt 3 0.3
MENICHINI M.(2012)-A MULTIDISCIPLINARY APPROACH TO DEFINE THE HYDROGEOLOGICAL MODEL OF AQUIFER SYSTEMS IN THE
"FIUME VERSILIA" CATCHMENT AND THE ADJACENT COASTAL PLAIN (NORTHWEST TUSCANY,ITALY).
Sand 367 46
Clayey sandy 17 2
Sand and pebbles 2 0.2
Sand and conglomerate 17 2
Sand and gravel 35 4
Gravelly sand 7 1
Silty sand 90 11
Peaty sand 2 0.3
Terrain 17 2
Table 4.5h – Total thickness and percentage of each lithological class of the Horizon 45 (aquitard/aquiclud)
grain size total thickness (m) %
Clay 21 15
Clay and peat 5 4
Silty clay 4 3 Sandy clay 8 6 Peaty clay 20 15 Anthropogenic ash 6 4 Silt 7 5 Clayey silt 7 5
Silt and peat 3 2
Gravelly silt 6 4
Sandy silt 8 6
Landfill waste 4 3
Sand and gravel 3 2
Silty sand 5 4
Terrain 3 2
Peat 24 18
MENICHINI M.(2012)-A MULTIDISCIPLINARY APPROACH TO DEFINE THE HYDROGEOLOGICAL MODEL OF AQUIFER SYSTEMS IN THE
"FIUME VERSILIA" CATCHMENT AND THE ADJACENT COASTAL PLAIN (NORTHWEST TUSCANY,ITALY).
4.1.2 – Groundwater levels and stored water volumes
Since the last 80 years several studies related to the hydrogeology of the Versilia plain were performed, but the most important is that was carried out by the Region of Tuscany (REGIONE TOSCANA, 2008) from September 2002 to April 2009. This study dealt with the periodic monitoring of the Apuan-Versilian aquifer in terms of groundwater levels and physical-chemical parameters (temperature, conductivity and pH) according to DGR 225/03. This monitoring has provided data that show high level condition (April) and low level condition (September), on a network of specifically selected wells and/or piezometers. Based on these measurements, a database was created from which a series of thematic maps were elaborated (REGIONE TOSCANA, 2008).
During this study two campaigns of measurement of groundwater levels were carried out utilizing the monitoring network of the Tuscany Region, the first on April 2009 and the second on September 2009. The first campaign was carried out in collaboration with the Tuscany Region and covered wells, mostly belonging to the aquifer monitoring network of Versilia. Whereas the second campaign was carried out independently. Each well belonging to the monitoring network has a sampling card where characteristics of the well (well depth, pump depth, filters depth and utilization), location, name of the owner and all the measurements made over the years are registered.
The area under study is characterized, as fully described in the previous paragraph, by an alternation of permeable deposits (aquifers) and low-permeable (interlayers). The interlayers are not continuous throughout the area and so they allow the aquifers to be in hydraulic connection. Whereas in some areas the aquifers show confined or semi-confined characteristics due to the presence of silt or clay beds and peaty or swampy deposits, at various levels. However the aquifer system could be considered monolayer and even in areas where, due to the presence of limited acquitards or acquicluds the circuits could be developed on two different levels. The frequent presence of multiscreening wells favour the exchange water between some levels so can show only one groundwater level. In the monitoring network, where there are shallow aquifers, the measured potentiometric level of the deeper wells could be the sum of several aquifers.
Analysing the ground groundwater levels in both maps (figure 4.9 a and b) it is possible to see that, in the foothills the levels are generally between 4 and 20 m.a.s.l. with flow directions swinging from NE to SW. In particular in high level condition, near the alluvial fan of Torrente Montignoso the potentiometer lines have a divergent directions, whereas, as regards the Versilia River alluvial fan, this has the same geometry only in the apical part. In the final part of the same alluvial fan, in fact, the iso-potentiometer line becomes parallel to the coastal line, probably due to local pumping (eg. Cugnia well
MENICHINI M.(2012)-A MULTIDISCIPLINARY APPROACH TO DEFINE THE HYDROGEOLOGICAL MODEL OF AQUIFER SYSTEMS IN THE
"FIUME VERSILIA" CATCHMENT AND THE ADJACENT COASTAL PLAIN (NORTHWEST TUSCANY,ITALY).
not only of water resources overexploitation by industry and for drinking water purposes, but also for the remediation of dewatering, in the intermediate zone and coastal plain are present some minimum of potentiometer surface with values in some cases under sea level.
This fact not only generates water flows variously oriented encouraging the sea water ingression in the aquifer, but also plays an important role in the differences of the hydraulic gradients between the foothills and the plains areas. The coastal plain is characterized by a hydraulic gradient much lower than the upper area. In fact the link between the imposed potentiometer limit represented by the incoming rivers average (values between 15 and 25 m.a.s.l.), and the central strip of the plain is carried out with gradients of between 2% and 3%, whereas the transition between central strip and the other potentiometer imposed limit established by the shoreline is characterized by gradients of 0.5% or less. This marked difference reflects the different dynamics of the aquifer: in the areas of alluvial fan aquifer trasmissivity produces a high flow of water, while in the coastal and median strip the water flow, when is undisturbed by pumping conditions, reflects the low topographical gradient.
Observing the high groundwater table level conditions (figure 4.9a) it is possible to see that the potentiometer surface tend to decrease rather regularly to the coastline in the northern area. Where as in the central area, between Forte dei Marmi and the Versilia River alluvial fan, the groundwater level remains constant at about 1-2 m.a.s.l., with a decreasing only in the vicinity of the coastal dune strip. In the southern part of the area trend of the water table is strongly influenced by dewatering pumping actions. This action causes an area over 2 km with water table below sea level of some decimetres even in the spring. In addition another minimum area is identified where the Cugnia wells field belonging to Gaia srl are located.
In the low level condition (figure 4.9b) the water table morphology seems to be substantially the same, but with a general decrease. A feeding zone at the foothill strip and some minimum areas of ground water table below sea level in the intermediate and coastal strips are also present. In particular, the minimum area in the southern part, due to Cugnia wells field, has a major extension and major value above sea level. Other two minimum area are also present, the first located near Montignoso due probably to an overexploitation of an industry and the second one is near the coast between Forte dei Marmi and Marina di Pietrasanta. The later minimum could be due to hotel facilities particularly active in low level condition period.
MENICHINI M.(2012)-A MULTIDISCIPLINARY APPROACH TO DEFINE THE HYDROGEOLOGICAL MODEL OF AQUIFER SYSTEMS IN THE
"FIUME VERSILIA" CATCHMENT AND THE ADJACENT COASTAL PLAIN (NORTHWEST TUSCANY,ITALY).
MENICHINI M.(2012)-A MULTIDISCIPLINARY APPROACH TO DEFINE THE HYDROGEOLOGICAL MODEL OF AQUIFER SYSTEMS IN THE
"FIUME VERSILIA" CATCHMENT AND THE ADJACENT COASTAL PLAIN (NORTHWEST TUSCANY,ITALY).
MENICHINI M.(2012)-A MULTIDISCIPLINARY APPROACH TO DEFINE THE HYDROGEOLOGICAL MODEL OF AQUIFER SYSTEMS IN THE
"FIUME VERSILIA" CATCHMENT AND THE ADJACENT COASTAL PLAIN (NORTHWEST TUSCANY,ITALY).
Water volume stored in the aquifer system
The three-dimensional reconstruction of the multilayer aquifer system has allowed not only to better understand the geometric characteristics of the system itself, but also to calculate the volume occupied by the various aquifer horizons present in it.
The water table surface was inserted in the three-dimensional model reconstructed to calculate the volumes of water saturated part for each horizon, for the high level condition (april-09) and low level condition (september-09). Finally, applying at various aquifer horizons an average effective porosity coefficient, weighted according to the percentage of abundance of different lithologies, it was possible to estimate the total volume of water stored in the aquifer system.
However, it is important to specify that these volumes refer to the portion of the aquifer system that was reconstructed according to the quantity, distribution and type of stratigraphy.
Calculation of the stored water volume is summarized in table 4.6. In particular, around 245.3 and 240.3 million m3 were estimated on April 2009 and on September 2009
respectively.
Table 4.6 – Volume (m3) of stored water for each horizon calculated applying a weighted-average porosity coefficient (Pe_weight)
Horizon (aquifer) Pe_weight m3 apr.'09 m3 sept.'09
40 0.14 81;006;001 78;059;399
14 0.15 45;339;251 45;339;251
10 0.12 21;541;840 21;541;840
8 0.12 97;426;404 95;421;170
MENICHINI M.(2012)-A MULTIDISCIPLINARY APPROACH TO DEFINE THE HYDROGEOLOGICAL MODEL OF AQUIFER SYSTEMS IN THE
"FIUME VERSILIA" CATCHMENT AND THE ADJACENT COASTAL PLAIN (NORTHWEST TUSCANY,ITALY).
4.1.3 – Groundwater levels evolution for the past years
The clearest indication of overexploitation of an aquifer comes from the reconstruction of the groundwater table and its comparison with the previous reconstructions: if the potentiometer surface shows depressions and pronounced downward trend, an imbalance between the exploitation and recharge obviously was occurred.
The following is a concise overview of some previous works regarding the groundwater table in the area of interest to verify and analyze possible over-exploitations.
The first work analysed is that of DUCHI & FERRARI (1984) concerning not only groundwater table map, but also iso-conductivity map. The groundwater table map in high level conditions - May 1984 (figure 4.10a) which have a contour interval of 0.50 m, indicates that the general trend of the potentiometric surface follows generally the morphology with a slight deepening of the potentiometric level toward the coast line. The only area with a groundwater level below the sea level is located near the mouth of Motrone, but there is also a minimum near the town of Forte dei Marmi.
Regarding the groundwater table map during low condition level (figure 4.10b) it is possible to note a general decrease of groundwater level and a large area with measurements of the groundwater table below the sea level that is developed mainly in the intermediate strip from the area of Lido di Camaiore to the southern part of Forte dei Marmi.
Another important study is that was made by MUSETTI (1985) regarding not only, the realization of conductivity and potentiometric maps (scale 1:10000), but also resistivity maps that allowed to investigate the saline intrusion not only on the surface but also in depth. Observing the groundwater table map on August 1985 (figure 4.11), where the iso-lines have a contour interval 0.20 m, it is possible to identify areas, mainly concentrated in the immediate vicinity of the coast, where groundwater levels are in the order 20-40 cm above sea level. This slight decline could be due to the total absence of rainfall in the summer of 1985, which could have determined, together with high pumping, a decrease of about 30 to 50 cm of the level of the aquifer as compared to the measurements of the previous years (MUSETTI, 1985).
MENICHINI M.(2012)-A MULTIDISCIPLINARY APPROACH TO DEFINE THE HYDROGEOLOGICAL MODEL OF AQUIFER SYSTEMS IN THE "FIUME VERSILIA" CATCHMENT AND THE ADJACENT COASTAL PLAIN (NORTHWEST TUSCANY,ITALY).
MENICHINI M.(2012)-A MULTIDISCIPLINARY APPROACH TO DEFINE THE HYDROGEOLOGICAL MODEL OF AQUIFER SYSTEMS IN THE "FIUME VERSILIA" CATCHMENT AND THE ADJACENT COASTAL PLAIN (NORTHWEST TUSCANY,ITALY).
MENICHINI M.(2012)-A MULTIDISCIPLINARY APPROACH TO DEFINE THE HYDROGEOLOGICAL MODEL OF AQUIFER SYSTEMS IN THE "FIUME VERSILIA" CATCHMENT AND THE ADJACENT COASTAL PLAIN (NORTHWEST TUSCANY,ITALY).
Figure 4.11 - Groundwater levels – August 1985 (MUSETTI, 1985) – scanning scale 1: 20.000
F
ORTE DEIM
ARMIM
ARINA DIMENICHINI M.(2012)-A MULTIDISCIPLINARY APPROACH TO DEFINE THE HYDROGEOLOGICAL MODEL OF AQUIFER SYSTEMS IN THE
"FIUME VERSILIA" CATCHMENT AND THE ADJACENT COASTAL PLAIN (NORTHWEST TUSCANY,ITALY).
Subsequently, PRANZINI (2004) presented a hydrogeological study, where the groundwater level maps in high level conditions - April 1999 (figure 4.12a) and in low condition levels - September 1999 (figure 4.12b) are produced. In general, analysing these maps it is possible to see that in areas of alluvial fans the groundwater flow follows the topographic slope, with a general divergent shape. In the rest of the plain areas high and low relative groundwater levels are found, with variously oriented flow directions: this is due to the exploitation and to the feeding area of the groundwater. The hydraulic gradient is on average about 1 ‰ in the middle and in the coastal strips, as it rises up to a maximum of 5% at the top of the alluvial fans.
With regard to changes in groundwater level between spring and late summer 1999, it is possible to observe a lowering of the water table is the whole area of interest. In the northern part the major lowering are recorded in the foothills and the intermediate strip, where industries are concentrated, while in the marine sands strip the lowering is generally less than one meter. In the south the level is kept below the sea level through the dewatering pumping action near the mouth of the ditch Motrone, and, in addition, there are minimum area of up to 3.5 meters in the foothill strip where there are numerous marble industries and of up to 3.25 m close to the major tourist centres (Forte dei Marmi) where there are several hotels. In general, in the apuan-versilian plain, a lowering around 1.5 meters is recorded between April and September, with a maximum of about 3 m in the industrial areas.
In the study made by TESSITORE (2002) there were produced 4 measuring campaigns of the groundwater table level and physical-chemical parameters in high and low level condition. Observing the groundwater level maps, relating to the periods of April and September 2003 and 2004 (figures 4.13 a and b), it is possible to distinguish three main potentiometric strips:
• foothill strip: the area adjacent to the hills with the highest elevations and presents the highest values of groundwater levels and hydraulic gradient. This area is very important for the recharge of the coastal plain aquifer system due to direct infiltration of rainwater, supply by main rivers and the possible feeding by carbonatic encasing rocks.
• Intermediate strip: this area is morphologically depressed and receives inputs of groundwater from both the foothills and the coastal dune strip.
• coastal dune strip: area between the shoreline and mid-range with groundwater level of about 2. In this area the aquifer is directly fed by the infiltration of rainwater and the groundwater level is very shallow, sometimes reaching the ground level. The roof of the aquifer varies in response to seasonal fluctuations.
The seasonal variations in groundwater level are between the maximum around 1m in the foothills strip and around 0.5m in the dune belt.
MENICHINI M.(2012)-A MULTIDISCIPLINARY APPROACH TO DEFINE THE HYDROGEOLOGICAL MODEL OF AQUIFER SYSTEMS IN THE
"FIUME VERSILIA" CATCHMENT AND THE ADJACENT COASTAL PLAIN (NORTHWEST TUSCANY,ITALY).
MENICHINI M.(2012)-A MULTIDISCIPLINARY APPROACH TO DEFINE THE HYDROGEOLOGICAL MODEL OF AQUIFER SYSTEMS IN THE
"FIUME VERSILIA" CATCHMENT AND THE ADJACENT COASTAL PLAIN (NORTHWEST TUSCANY,ITALY).
MENICHINI M.(2012)-A MULTIDISCIPLINARY APPROACH TO DEFINE THE HYDROGEOLOGICAL MODEL OF AQUIFER SYSTEMS IN THE
"FIUME VERSILIA" CATCHMENT AND THE ADJACENT COASTAL PLAIN (NORTHWEST TUSCANY,ITALY).
MENICHINI M.(2012)-A MULTIDISCIPLINARY APPROACH TO DEFINE THE HYDROGEOLOGICAL MODEL OF AQUIFER SYSTEMS IN THE
"FIUME VERSILIA" CATCHMENT AND THE ADJACENT COASTAL PLAIN (NORTHWEST TUSCANY,ITALY).
MENICHINI M.(2012)-A MULTIDISCIPLINARY APPROACH TO DEFINE THE HYDROGEOLOGICAL MODEL OF AQUIFER SYSTEMS IN THE
"FIUME VERSILIA" CATCHMENT AND THE ADJACENT COASTAL PLAIN (NORTHWEST TUSCANY,ITALY).
Finally, some extracts of the study “Ottimizzazione del monitoraggio della falda costiera apuo-versiliese e formazione della banca-dati” (REGIONE TOSCANA, 2008) are reported. In this study the groundwater levels map relating to the period from September 2002 to September 2007 are shown and this provides important considerations on overexploitation of the aquifer in these years.
As regards the foothills strip, the aquifer has a groundwater level between 20 and 5m above sea level, rising to 40m at the apical parts of the alluvial cones. In this area slope of the potentiometer surface is also notable passing in few kilometres from more than 40 to 5m above the mean sea level. This groundwater morphology reflects, of course, the three-dimensional relationships between the two sedimentary environments that take place from east to west.
The groundwater levels processed over the past few years with a brief description to evaluate the evolution with time are reported below.
September 2002 (figure 4.14a). Steep slope of the groundwater level at the
alluvial cones of the Versilia river and Camaiore stream and a wide area where the potentiometric level surface has equal to or lower than the sea level. It is interesting to note that all the draining pumps (idrovore in the legend) are located in areas characterized by groundwater levels above the sea level (between 1 and -1 m.a.s.l.) contributing, in fact, to lowering of the groundwater.
April 2003 (figure 4.14b). The minimum area is smaller than the previous
potentiometric surface (figure 4.14a) due to the abundant rainfalls of the previous months particularly evident in the period between September 2002 - April 2003 (Figure 4.14c).
September 2003 (figure 4.14d). The summer of 2003 was characterized by a
strong drought, according to the campaign collected in September 2003,there was a general lowering of the groundwater levels. In particular, the potentiometric surface was in fact, close to sea level (between 1 and 0 m.a.s.l.) for the entire zone and the minimum area are wider than in April 2003.
April 2004 (figure 4.14e). The collected and processed data of this campaign
provided a much better image of the groundwater levels, as witnessed by the general rise of the roof of the aquifer that is in almost all the plain above the sea level, in response to weather events more pronounced that occurred in the winter and spring.
September 2004 (figure 4.14f). The situation is very similar to that of September
2003 characterized by a wide area in which the level is below the sea level in the southern part.
April 2005 (figure 4.14g). Compared to the previous periods it is possible to note a
MENICHINI M.(2012)-A MULTIDISCIPLINARY APPROACH TO DEFINE THE HYDROGEOLOGICAL MODEL OF AQUIFER SYSTEMS IN THE
"FIUME VERSILIA" CATCHMENT AND THE ADJACENT COASTAL PLAIN (NORTHWEST TUSCANY,ITALY).
those of 2003, it is possible to observe, in stead, a general depletion of groundwater in the area, particularly evident in the southern sector. This widening of the minimum area could be due to a reduction of the measurement points, in the coastal municipalities of Pietrasanta and Camaiore, which leads to a higher extrapolation error and therefore not reliable. However this groundwater level in this campaign is the worst recorded it is in agreement with the general trend of lowering of the rainfall.
September 2005 (figure 4.14h). The groundwater level data collected in this
campaign are obviously smaller than those of April of the same year, but in general it is possible to observe a general improvement with respect to the low level condition of the previous year (figure 4.14f) limited to the area of Forte dei Marmi and the foothills strip near Pietrasanta. The reducing sectors are rather modest considering the groundwater levels from -1 to 0 meters above sea level in the southern area.
April 2006 (figure 4.14i). Compared to the same period a year earlier, the
measurements in April 2006 show a slight rise in groundwater level. The situation remains essentially unchanged as regards the extension of the areas with groundwater level close to or below the sea level.
September 2006 (figure 4.14l). Comparison of this map with that for the same
period of the year before, in the northern area a substantial equivalence of feeding by mountain area is indicated. The areas with groundwater levels between 0 and 1 meter above sea level and between -1 and 0 m.a.s.l. were widening. The remaining parts of the plain show a good water supply from the alluvial fan of Versilia river.
April 2007 (figure 4.14m). The map related to groundwater level of April 2007 is
similar to that of the same period of the year before.
September 2007 (figure 4.14n). The map of this period is very similar to that of
the September 2003, that was the most critical year regarding water resources. The comparison with the same period of the precedent year, revealed only a limited area in the basin of the Fossa Maestra, where the ground\groundwater level has risen to 1 to 2m above sea level. The appearance of a distribution area is even clear in which the piezometric level drops below the sea level approximately in correspondence of the Mass in the neighbourhood of the Frigid River. Some isolated points of measurement levels have indicated <0 (sea level) located between the towns of Montignoso, Pietrasanta and Seravezza. Comparing this figure with that of similar soft campaign (April 2007) general lowering of the groundwater is evident, which does not seem to be affected by the drought, except the Fossa Maestra only in the summer. The rest of the plain, in fact, suffered from lack of summer rains.
MENICHINI M.(2012)-A MULTIDISCIPLINARY APPROACH TO DEFINE THE HYDROGEOLOGICAL MODEL OF AQUIFER SYSTEMS IN THE
"FIUME VERSILIA" CATCHMENT AND THE ADJACENT COASTAL PLAIN (NORTHWEST TUSCANY,ITALY).
Figure 4.14a – Groundwater levels September 2002 (REGIONE TOSCANA, 2008)
MENICHINI M.(2012)-A MULTIDISCIPLINARY APPROACH TO DEFINE THE HYDROGEOLOGICAL MODEL OF AQUIFER SYSTEMS IN THE
"FIUME VERSILIA" CATCHMENT AND THE ADJACENT COASTAL PLAIN (NORTHWEST TUSCANY,ITALY).
Figure 4.14c – Mean monthly precipitation for the area of interest (REGIONE TOSCANA, 2008)
MENICHINI M.(2012)-A MULTIDISCIPLINARY APPROACH TO DEFINE THE HYDROGEOLOGICAL MODEL OF AQUIFER SYSTEMS IN THE
"FIUME VERSILIA" CATCHMENT AND THE ADJACENT COASTAL PLAIN (NORTHWEST TUSCANY,ITALY).
Figure 4.14e – Groundwater levels April 2004 (REGIONE TOSCANA, 2008)
MENICHINI M.(2012)-A MULTIDISCIPLINARY APPROACH TO DEFINE THE HYDROGEOLOGICAL MODEL OF AQUIFER SYSTEMS IN THE
"FIUME VERSILIA" CATCHMENT AND THE ADJACENT COASTAL PLAIN (NORTHWEST TUSCANY,ITALY).
Figure 4.14g – Groundwater levels April 2005 (REGIONE TOSCANA, 2008)
MENICHINI M.(2012)-A MULTIDISCIPLINARY APPROACH TO DEFINE THE HYDROGEOLOGICAL MODEL OF AQUIFER SYSTEMS IN THE
"FIUME VERSILIA" CATCHMENT AND THE ADJACENT COASTAL PLAIN (NORTHWEST TUSCANY,ITALY).
Figure 4.14i – Groundwater levels April 2006 (REGIONE TOSCANA, 2008)
MENICHINI M.(2012)-A MULTIDISCIPLINARY APPROACH TO DEFINE THE HYDROGEOLOGICAL MODEL OF AQUIFER SYSTEMS IN THE
"FIUME VERSILIA" CATCHMENT AND THE ADJACENT COASTAL PLAIN (NORTHWEST TUSCANY,ITALY).
Figure 4.14m – Groundwater levels April 2007 (REGIONE TOSCANA, 2008)
MENICHINI M.(2012)-A MULTIDISCIPLINARY APPROACH TO DEFINE THE HYDROGEOLOGICAL MODEL OF AQUIFER SYSTEMS IN THE
"FIUME VERSILIA" CATCHMENT AND THE ADJACENT COASTAL PLAIN (NORTHWEST TUSCANY,ITALY).
Final considerations
Analyzing the situation from the '80s to today it is possible to observe that the groundwater level in some areas has decreased, while in others it remained more or less the same or even has raised. In practice, although areas with dipping prevail, there is no general trend of lowering of the groundwater level, which might have been expected in relation to the increase of the exploitation and reduced rainfall.
An important factor found is that the system is highly responsive to rainfall, so it is true that in times of water crisis there is a strong decrease of the groundwater table, but the system reacts in a short time and it returns to average potentiometric levels shortly after the first rains.
In the coastal strip, although there are significant lowering from spring to summer, there aren’t persistent depression of groundwater levels, due to probably, the fact that the water users were careful not to depress the groundwater level too much so that not to pump salt water.
The supply from the mountain area seems to be important even in periods when the rainfall appeared to be minimal and generally it overcomes the summer water shortages in the drought years.
MENICHINI M.(2012)-A MULTIDISCIPLINARY APPROACH TO DEFINE THE HYDROGEOLOGICAL MODEL OF AQUIFER SYSTEMS IN THE
"FIUME VERSILIA" CATCHMENT AND THE ADJACENT COASTAL PLAIN (NORTHWEST TUSCANY,ITALY).
4.1.4 – Hydrodynamic parameters
To define the hydrodynamic parameters it was not only the works in the literature and some professional reports that were consulted, but also a pumping test at a constant flow has been carried out (May 2010) to determine the values of trasmissivity (T), hydraulic conductivity (K) and coefficient of storage (S) of the aquifer.
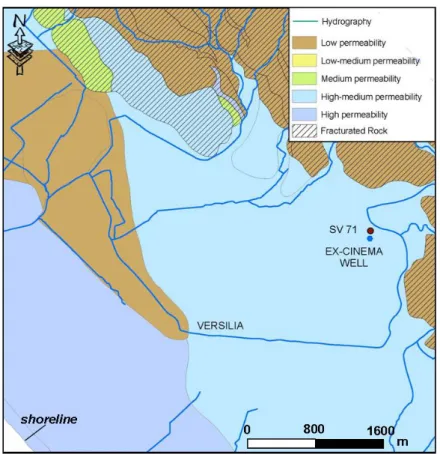
The test was performed in an aqueduct well (called EX-CINEMA) with 75 meters of depth, located within the alluvial fan of the Versilia River at the entrance of the river in the plains (figure 4.15). As a “control well” another well (SV71) was chosen, 40 m depth, and located approximately at a distance of 90m from the first. Both wells are located near Versilia River (170 and 80 m, respectively).
Figure 4.15 – Location of the wells used for the pumping test.
In figure 4.16 the stratigraphy of the EX-CINEMA well is shows. Analysing this stratigraphy it is possible to observe that the aquifer system in this area consists of an alternation of deposits, mainly gravel, but with a significant percentage of fine materials. This indicates the presence of a single groundwater table consisting of an alternation of more or less productive horizons.
The pumped well has filters at the depth of the two most productive aquifers: the first at 25.5-29.5 m, where gravel and pebbles in sand are present; the second at 64-65
MENICHINI M.(2012)-A MULTIDISCIPLINARY APPROACH TO DEFINE THE HYDROGEOLOGICAL MODEL OF AQUIFER SYSTEMS IN THE
"FIUME VERSILIA" CATCHMENT AND THE ADJACENT COASTAL PLAIN (NORTHWEST TUSCANY,ITALY).
m at a level of gravel and pebbles in a silty matrix. In the last part of the stratigraphy (between 73.5 and 75 m depth) there is hardened clay, probably indicating the proximity of the impermeable substrate.
MENICHINI M.(2012)-A MULTIDISCIPLINARY APPROACH TO DEFINE THE HYDROGEOLOGICAL MODEL OF AQUIFER SYSTEMS IN THE
"FIUME VERSILIA" CATCHMENT AND THE ADJACENT COASTAL PLAIN (NORTHWEST TUSCANY,ITALY).
Based on these considerations, the phreatic aquifer drained by well has a total thickness of approx. 70 m, taking into account a depth of about 15 m of the groundwater table and it has a saturated thickness of about 55 meters. The well is considered "incomplete" because the screen does not affect the entire thickness of the aquifer. This may make the classical hydrodynamic approaches inapplicable to processing the data from the pumping test well. Taking into account the literature (FETTER, 1980), the effect of incompleteness does not significantly affect the levels recorded if the distance from the pumping well to control well is in more than 1,5 * b * (Ko/Kv)1/2, where b is the thickness of the aquifer and the Ko and Kv the hydraulic horizontal and vertical conductivity respectively. In this case the distance "b" between SV71 and EX-CINEMA are about 95 m. To consider irrelevant the effect of incompleteness, the anisotropy factor should be less than 1.3. The Versilia River alluvial fan is composed of gravel, but has silty-sand levels interbedded, and so it is probable that the anisotropy is greater than 1.3. However, taking into account that at the end of the test the groundwater levels were recorded (Δh) in the control and pumping well respectively below 1% and 5% compared to the saturated thickness, the effect of incompleteness of the well is to be considered negligible.
The pumping test lasted 27 hours instead 76 hours, as planned, due to logistical problems that led to stop the test. The flow rate was constant at 11.5 l/s, corresponding to the maximum load reached by the pump available. The operations of the groundwater levels detection during the test were performed automatically using a multiparametric probe (CTD-Diver by Schlumberger) installed at a depth of 25 m into the pumping test well, whereas in the control well was carried out manually, using a freatimeter, because the technical characteristics of the well did not allow the use of automatic probe.
Concerning the data processing of groundwater level measured during the test, the THEIS theory (1935) was used with the logarithmic approximation of JACOB (1946). The data recorded in SV11, shown in the binary diagram “∆h vs log10 (t)” (figure 4.17a), are
distributed according to a broken line consisting of three stretches with different slopes. This form is also confirmed by the recorded data of the data-logger of the pumping well in the same type of graph (figure 4.17b). The trends observed are indicative of a lack of homogeneity of the aquifer, with internal changes in permeability. This is in agreement with the stratigraphic data of the well "EX-CINEMA" (figure 4.16).
The distance between the pumping well and the Versilia river is very short (about 170 m). So it is possible that in the first section of the broken line with a very low slope, the effect of this imposed potential limit is overlapped to that related to the inhomogeneity of the aquifer. For these reasons and considering that the first section of the broken line is related to a short time (only 2 hours) with respect to the total time of the test (27 hours). Data processing for the determination of aquifer parameters the
MENICHINI M.(2012)-A MULTIDISCIPLINARY APPROACH TO DEFINE THE HYDROGEOLOGICAL MODEL OF AQUIFER SYSTEMS IN THE
"FIUME VERSILIA" CATCHMENT AND THE ADJACENT COASTAL PLAIN (NORTHWEST TUSCANY,ITALY).
second and the third parts were utilized, most being representative of the hydrodynamic behaviour of the aquifer.
y = 0.04x - 0.04 R2 = 0.99 y = 0.15x - 0.48 R2 = 0.98 y = 0.29x - 1.10 R2 = 0.90 0.0 0.1 0.2 0.3 0.4 0.5 0 1 2 3 4 5 6 log10(t) 7 Δ h ( m )
stretche 1 stretche 2 stretche 3
(a) y = 0.09x + 1.82 R2 = 0.95 y = 0.28x + 1.11 R2 = 0.99 y = 0.41x + 0.50 R2 = 0.94 1.7 1.9 2.1 2.3 2.5 2.7 0 1 2 3 4 5 6 log10(t) 7 Δ h ( m )
stretche 1 stretche 2 stretche 3
(b)
Figure 4.17 a, b – Binary diagram ∆h vs log10(t) about (a) control well (SV21) and (b) pumping well
(EX-CINEMA) during the pumping test (∆h= variation of water level; t= time in second)
In particular, from the data recorded in the control well using the approach of Jacob (1946), the value of trasmissivity (T) storage coefficient (S) and hydraulic conductivity (K== T/h, con h = 55 m) are:
T = 0,183*Q/C ; S = 2.25*T*t0/r2; K = T/h
(where Q = flow rate of pumping, C = slope of the various stretches of broken line, t0 = time corresponding to various stretches, r = 94 m, distance between pumping well
and in the control well; h = 55 m, thickness of the saturated aquifer). The values obtained in the two stretches of the broken line are:
MENICHINI M.(2012)-A MULTIDISCIPLINARY APPROACH TO DEFINE THE HYDROGEOLOGICAL MODEL OF AQUIFER SYSTEMS IN THE
"FIUME VERSILIA" CATCHMENT AND THE ADJACENT COASTAL PLAIN (NORTHWEST TUSCANY,ITALY).
- second stretch: T=1,4E-02 m2/sec; S= 5,6E-03; K = 2,6E-04 m/sec
- third stretch: T = 0,7E-02 m2/sec; S = 8,6E-03;. K = 1,3E-04 m/sec
Trasmissivity and hydraulic conductivity parameters are also calculated using the data uplift of the groundwater levels at the end of the test. The uplift was monitored in both wells although it is not expected to return to the static level and so the third stretch is not completed.
Using the same approach as above, the value of trasmissivity (T), and hydraulic conductivity (K) were calculated only for the second stretch:
- second stretch: T = 2,3E-02 m2/sec; K = 4,3E-04 m/sec.
(a) y = 0.03x + 0.21 R2 = 0.96 y = 0.09x + 0.14 R2 = 0.98 0.0 0.1 0.2 0.3 0.4 0 0.5 1 1.5 2 2.5 3 3.5 log10[(t+t')/t'] Δ h (m) stretche 1 stretche 2 (b) y = 0.15x + 0.17 R2 = 0.93 y = 0.08x + 0.28 R2 = 0.87 0.0 0.1 0.2 0.3 0.4 0.5 0.6 0 0.5 1 1.5 2 2.5 3 3.5 log10[(t+t')/t'] Δ h (m ) stretche 1 stretche 2
Figure 4.18 a, b – Binary diagram ∆h vs log10(t) about (a) control well (SV21) and (b) pumping well