A Kinetic Model of Thermochemical
Conversion of Biomass
Doctoral Dissertation of:
Paulo Eduardo Amaral DEBIAGI 822440
Supervisor
Prof. Tiziano FARAVELLI Tutor
Prof. Andrea MELE
The Chair of the Doctoral Program Prof. Alessio FRASSOLDATI
To my Family. To my partner in life.
we must focus to see the light.”
that this work would have never become truth, without their guidance and enlightenment. I would like to express my sincere acknowledgements to:
All the members of CRECK modeling group, for the warm welcoming and continuous support. In special, Professor Tiziano Faravelli for accepting to be my Ph.D. supervisor, for always being present with great ideas, for pushing the edges and providing solid support during the development of this work. Professor Eliseo Ranzi, who spent much of his time teaching me the essence of his knowledge and being a great mentor and friend. For Professors Alessio Frassoldati and Alberto Cuoci, and for Giancarlo Gentile, Matteo Pelucchi, Alessandro Stagni and Mattia Bissoli who were present when I first arrived and provided me pleasurable talks and ideas about work and life. Professors Stephen Dooley and Christian Hasse for accepting to be part of the evaluating board of this thesis, contributing with many important comments and ideas.
Politecnico di Milano, for providing a great scientific environment and the access to the tools required for this work. CAPES foundation, for providing the financial support for the development of this work. The friends I met during these years in Milan, who made my stay much more pleasurable and enriching. My first mentor in science, Professor Regildo Marcio Gonçalves da Silva, for his support and friendship.
My partner in life, Francyelle Tostes, for being by my side and giving me support and love in the darkest moments. For believing in me when I could not. For persisting that I can always become a better person. For awakening the real feeling of pure love inside of me. For providing me so many precious lessons and unforgettable moments, that I will carry for all my life. For being this special human being that destiny made me encounter. Finally, the acknowledgements to my family. My parents, for being always present and available during my whole life, for allowing and encouraging me to grow up and to be independent. For raising me and providing limitless love and care. For showing me the value of education. My sisters, for being supportive and kind when I most needed. For giving birth to my nephews, who provide me memorable moments of joy. My grandmother, the strongest person I ever met, who is my inspiration for resilience, persistence and peace. All the people that I did not mentioned, but were part of this journey, my sincere thank you!
Publications
• Debiagi, P. E. A., C. Pecchi, G. Gentile, A. Frassoldati, A. Cuoci, T. Faravelli and E. Ranzi (2015). "Extractives extend the applicability of multistep kinetic scheme of biomass pyrolysis." Energy & Fuels 29(10): 6544-6555.
• Debiagi, P. E. A., G. Gentile, M. Pelucchi, A. Frassoldati, A. Cuoci, T. Faravelli and E. Ranzi (2016). "Detailed kinetic mechanism of gas-phase reactions of volatiles released from biomass pyrolysis." Biomass and Bioenergy 93: 60-71.
• Gentile, G., P. E. Debiagi, A. Cuoci, A. Frassoldati, T. Faravelli and E. Ranzi (2016). "A CFD Model for Biomass Flame-Combustion Analysis." Chemical Engineering Transactions 50.
• Gentile, G., P. E. A. Debiagi, A. Cuoci, A. Frassoldati, E. Ranzi and T. Faravelli (2017). "A computational framework for the pyrolysis of anisotropic biomass particles." Chemical Engineering Journal 321: 458-473.
• Ranzi, E., P. E. A. Debiagi and A. Frassoldati (2017). "Mathematical modeling of fast biomass pyrolysis and bio-oil formation. Note I: Kinetic mechanism of biomass pyrolysis." ACS Sustainable Chemistry & Engineering 5(4): 2867-2881. • Ranzi, E., P. E. A. Debiagi and A. Frassoldati (2017). "Mathematical Modeling of
Fast Biomass Pyrolysis and Bio-Oil Formation. Note II: Secondary Gas-Phase Reactions and Bio-Oil Formation." ACS Sustainable Chemistry & Engineering 5(4): 2882-2896.
• Debiagi, P. E. A., M. Trinchera, A. Frassoldati, T. Faravelli and E. Ranzi (2017). Third Generation Biomass. Classification and Characterization of Algae Fuels. 40th Meeting of the Italian Section of the Combustion Institute. Rome.
• Debiagi, P. E. A., M. Trinchera, A. Frassoldati, T. Faravelli, R. Vinu and E. Ranzi (2017). "Algae characterization and multistep pyrolysis mechanism." Journal of Analytical and Applied Pyrolysis 128: 423-436.
• Debiagi, P. E. A., G. Gentile, A. Cuoci, A. Frassoldati, T. Faravelli and E. Ranzi (2018). "Yield, Composition and Active Surface Area of Char from Biomass Pyrolysis." Chemical Engineering Transactions 65.
• Debiagi, P. E. A., G. Gentile, A. Cuoci, A. Frassoldati, E. Ranzi and T. Faravelli (2018). "A predictive model of biochar formation and characterization." Journal of Analytical and Applied Pyrolysis. (Accepted - In press).
Participation in Events
• Joint Meeting – French and Italian sections of the combustion institute. Pisa, April 23-24, 2014.
• IConBM – Second international conference on biomass. Italy, June 19-22, 2016. Work presented: A CFD Model for Biomass Flame-Combustion Analysis.
• 40th Meeting Italian Section of the Combustion Institute, Rome – Italy. May-2017. Work presented: Third Generation Biomass. Classification and Characterization of Algae Fuels.
• 3rd General Meeting and Workshop on SECs in Industry of SMARTCATs Action. Work presented: Update and Validation of Hemicellulose Pyrolysis Kinetic Mechanism
• Gas-phase Reaction Kinetics of Biofuels Oxygenated Molecules. Milan, April 23-24, 2018.
• Doktorandenkolloquium OxyFlame project. WSA RWTH Aachen – Germany. 06 June 2018. Work Presented: A general model for the thermochemical conversion of biomass.
• IConBM – Third international conference on biomass. Italy, June 17-20, 2018. Work presented: Yield, Composition and Active Surface Area of Char from Biomass Pyrolysis.
ABSTRACT
Biomass is promising as renewable resource, comprising a broad range of different types of biomaterials, such as wood, forest and agricultural residues, waste from wood and food industry, algae, energy grasses, straw, bagasse and sewage sludge. These materials are widely available and many of them are residues from different economic activities, generating costs for disposal and sometimes even environmental issues. Harvesting these materials is a possible solution for substitution of fossil fuels and treatment of residues. The thermochemical route of biomass conversion is promising. By providing heat to the feedstock, it releases its volatile matter giving multiple products, depending on the feedstock and the operating conditions. The yield of these products can be enhanced by selecting the proper technologies. This conversion path is a very complex multicomponent, multiphase, and multiscale problem. Because of its complexity, modeling this process is still a challenge, but consists an essential step to better understand the aspects involved and provide tools to the design of optimized reactors and processes.
A predictive and comprehensive model for both characterization and chemical kinetics of biomass thermochemical conversion was developed. The workflow consists on: Collection of literature experimental data, characterization of feedstocks, kinetic mechanisms that describe each step of the process, validation of the simulations with the collected experimental data.
The model proposes some innovative and interesting features:
• Comprehensiveness – Can be applied for a wide range of feedstock composition, covering both lignocellulosic and algae biomass;
• Flexibility – Can be further improved in order to account for new experimental evidences;
• Predictivity – The models were developed and validated for many feedstocks in several different conditions. In this way, no experimental data is needed to perform the simulations. All the information needed are the characteristics of your feedstock and the operating conditions. When experimental data is available, the user can choose whether to use it or rely on the model predictions; • Compatibility of Kinetic Mechanisms– A combination of semi-detailed and detailed kinetic mechanisms are present for the different facets of the problem.
They are proposed in a CHEMKIN-like format, which make them compatible with each other;
• Species – The reference components and the products released are defined with a combination of real and lumped species;
• Computational cost – As a result of the simplification degree adopted in this model, it is efficient for more complex simulations, involving particle and reactor scales. Despite these simplifications, the model generates a great level of details. The validation of large amounts of experimental data shows the robustness of the model. It remains flexible to include new experimental evidences and to be extrapolated when required. It was not found in literature another model that covers all these steps of biomass thermochemical conversion in a single formulation, being able to simulate the majority of processes currently available. The model is a useful tool to the development of optimized reactor designs for improving industrial processes efficiency. Besides providing reliable predictions in many cases, uncertainties still exist due to the level of simplification adopted in the selection of reference species and the definition of the reactions. The model could be further improved in the future by considering the catalytic effect of each metal present in the ashes, the intra-component interactions, the effect of the polymerization and branching degrees, among others.
Contents
Page
Chapter 1
001
1. Mankind, Biomass, Energy and Materials
001
2. World Energy Scenario
004
3. Biomass as Renewable Source of Fuels and Materials 011
4. State-of-the-Art of thermochemical
conversion of biomass
016
4.1.
The Multi-Complexities of the Problem
016
4.2.
Pyrolysis: Measurements and Analysis
of Products
017
4.3.
Modeling Activity
021
5. Objectives
024
Chapter 2
026
1. Analytical Methods and Biomass Composition
026
2. Biomass Molecular Structure
031
2.1.
Lignocellulosic Biomass
031
2.2.
Algae Biomass
048
3. Conclusions
058
Chapter 3
059
1. Selection and definition of reference species
059
1.1.
Lignocellulosic Biomass
061
1.2.
Algae Biomass
064
2. Van Krevelen Diagram
066
3. Characterization of Lignocellulosic Biomass
069
3.1.
Characterization when biochemical
composition is available
069
3.2.
Characterization of Lignin Samples
069
3.3.
Characterization of Lignocellulosic
Biomass samples
072
3.4.
Estimation of optimal characterization
splitting parameters
076
4.1.
Characterization procedure
083
4.2.
Validation of the characterization procedure
086
5. Conclusions
087
Chapter 4
089
1. Pyrolysis of Lignocellulosic Biomass
Reference Species
090
1.1.
Cellulose
090
1.2.
Hemicelluloses
092
1.3.
Lignins
095
1.4.
Extractives
098
2. Validation of the kinetic mechanism
of lignocellulosic biomass pyrolysis
103
2.1.
Comparison with experimental data
103
2.2.
Catalytic effect of ash
109
3. Pyrolysis of Algae Biomass Reference Species
114
3.1.
Proteins
115
3.2.
Carbohydrates and Lipids
117
3.3.
Release of CO2, NO and NH3 from inorganics 117
4. Validation of the kinetic mechanism of algae pyrolysis 118
4.1.
Slow Heating Rate Pyrolysis
122
4.2.
Isothermal fast pyrolysis experiments
and model predictions
125
5. Conclusions
128
Chapter 5
129
1. Bio-oil: Liquid Biomass Pyrolysis Product
131
1.1.
Bio-oil composition and physical properties
131
1.2.
Impact of bio-oil properties
on combustion systems
135
2. Kinetic Mechanism of Gas-Phase Reactions
138
2.1.
Chain radical reactions. Generic rate rules
for initiation and H-abstraction reactions.
138
2.2.
Molecular reactions and water elimination
reactions. Alcohols, Glycerol, and
2.3.
Aromatics, phenolics, and successive
reactions to form polycyclic aromatic
hydrocarbons (PAH) and soot
146
2.4.
Secondary gas-phase reactions of volatiles
from cellulose and lignin pyrolysis.
149
2.5.
The Effect of Secondary Gas-Phase in Bio-Oil 154
3. Conclusions
164
Chapter 6
166
1. Biochar yield and composition
167
1.1.
Predictions of the Model
171
2. Biochar Oxidation
180
2.1.
Density of Active Sites
181
2.2.
Surface evolution
186
2.3.
Kinetic Mechanism of Char Oxidation
189
2.4.
Validation
195
3. Conclusions
199
List of Tables
Table 1 – World energy scenario in 1973 and 2015. Global capacity by energy source and their share on the global energy matrix
Table 2 - Biomass pyrolysis, torrefaction, and gasification processes [13]
Table 3 - Standard analytical procedures of biomass fuel analysis. After Demirbas [89] Table 4 - Proximate and ultimate composition of some typical biomass feedstock. Proximate composition is reported in “As received” basis, whilst ultimate composition is “DAF”. After Williams, Jones [90].
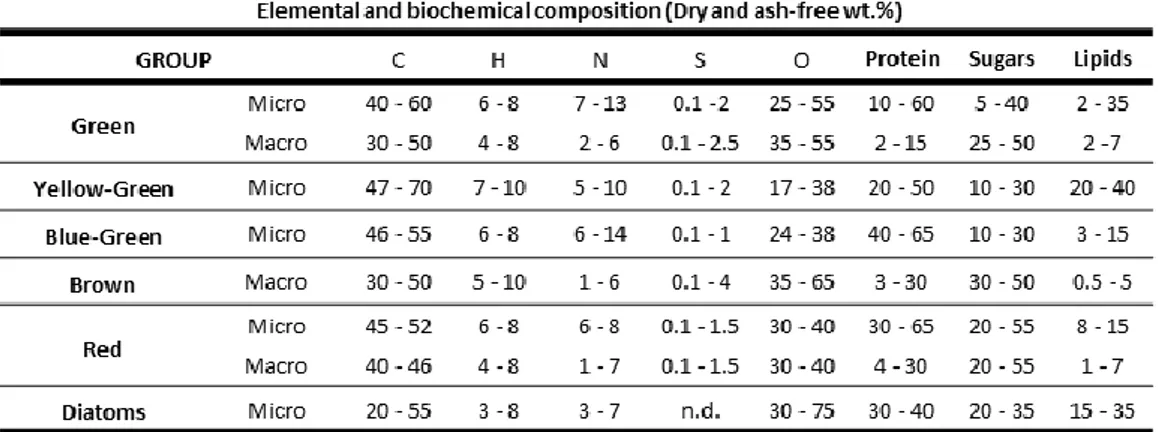
Table 5 - Typical elemental and biochemical composition of main groups of algae. Table 6 - Elemental composition of different lignins.
Table 7 - Distribution of fatty acids extracted from Betula verrucosa [112].
Table 8 - Summary and classification of extractive compounds typically found in lignocellulosic biomass.
Table 9 - Classification of algae species
Table 10 - Average frequency of amino acids in algae Table 11 - Typical proteins produced by some algae species.
Table 12 – Summary of elemental composition of reference species for biomass characterization.
Table 13 - Characterization of Hybrid Poplar (NREL). Direct correspondence of biochemical composition with reference species.
Table 14 - Elemental composition of different lignins and characterization in terms of reference components
Table 15 - Biomass samples rich in extractives
Table 16 - Optimized parameters for different ligno-celullosic feedstocks
Table 17 - Mean square and average deviations of cellulose, hemicellulose, lignins, and extractives.
Table 18 - Correlations obtained by linear regression of the optimized values.
Table 19 - Comparison of algae samples characterization and experimental data. The numbers in parenthesis correspond to sample identification in the algae database.
Table 20 - Kinetic mechanism of lignocellulosic biomass pyrolysis
Table 21 - Pyrolysis of Pinus radiata and Wheat Straw at 80 K/min. Characterization in terms of reference species and predicted composition of primary pyrolysis products and residual char, at 700 °C.
Table 22 - Formation enthalpy ΔHf,298 [kcal/mol] and formation entropy ΔSf,298 [cal/mol/K] of
major oxygenated species released from biomasses.
Table 23 - Multistep kinetic mechanism of protein pyrolysis. First order reactions: k=A x exp(-E/RT) [s-1]
Table 25 – Description of the species present in the kinetic mechanism of algae pyrolysis (Table 24)
Table 26 – Experimental data obtained with fast pyrolysis of four algae species
Table 27 - Comparison of physical properties of bio- oil and mineral oils: Heavy Fuel Oil (HFO) and Light Fuel Oil (LFO) [282].
Table 28 - Bond dissociation energies of C4 hydrocarbon and oxygenated species. C-H (black), C-C (red), and C-O & O-H (blu) bond dissociation energies (kcal/mol) calculated at G4 level (298 K) [298].
Table 29 - C-H bond dissociation energy (kcal/mol) of hydrocarbon and oxygenated species calculated at G4 level (298 K)
Table 30 - Primary volatile products released from fast pyrolysis of lignin at 0.1 s. Comparisons between experimental data [Yang et al., 2015] and model.
Table 31 - Biomass elemental composition and characterization in terms of reference components. Spruce wood, birch wood [347], peanut shell [348], waste wood shavings [349], and maple wood [43].
Table 32 – Biochar elemental composition, cluster molecular formula and estimated density of active sites.
Table 33 - H-abstraction from naphtalene and equivalent path on gas-solid. Table 34 – Kinetic mechanism of biochar oxidation
List of Figures
Figure 1 - Sources of power used by man on prime movers
Figure 2 – Percentual share of fuels in the world energy matrix (1973 – 2015)
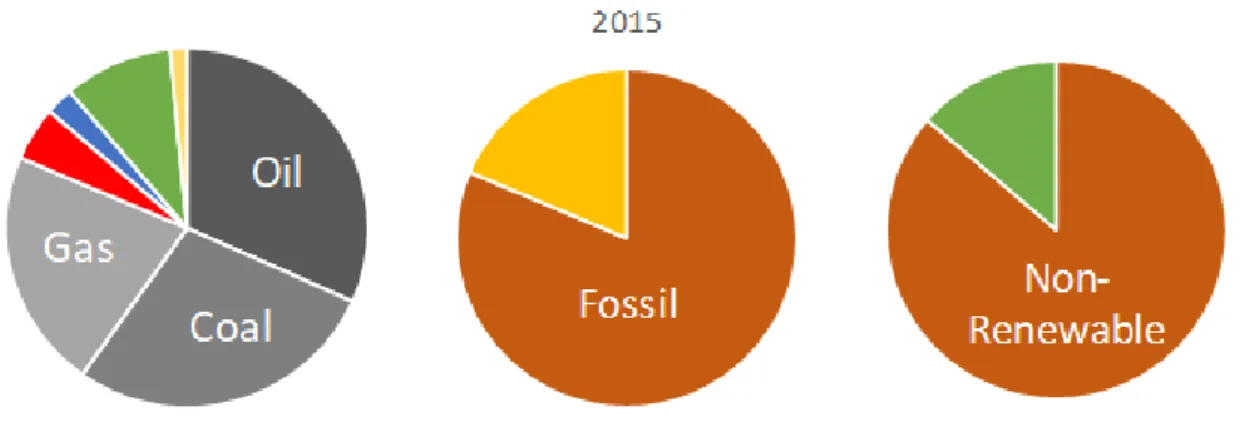
Figure 3 – World energy scenario (2015), comparison of different grouping of the fuels by their characteristics
Figure 4 - Absolute share of fuels in the world energy matrix (1973 – 2015 – 2040 (IEA projection))
Figure 5 - Growth of absolute fuels demand from 1973 to 2015
Figure 6 - World CO2 emissions by fuel combustion from 1971 to 2015 (Mt of CO2) (after [8]) Figure 7 - World CO2 emissions by regions from 1971 to 2015 (Mt of CO2) (after (IEA 2017)) Figure 8 – Top 15 ranked countries by the World Energy Council, in the “World Energy Trilemma Index - 2017”[10].
Figure 9 – 2016 energy matrix by world regions. Share of each fuel in total energy production. Figure 10 – Biomass conversion routes into fuels.
Figure 11 - Scheme of thermochemical conversion of biomass. Typical products obtained after pyrolysis.
Figure 12 – Typical product spectrum from thermochemical conversion processes (After Bridgwater [13])
Figure 13 - The four pyrolysis regimes defined by Biot and Pyrolysis numbers. Figure 14 – Scheme of the sub-models proposed and discussed in the present thesis Figure 15 - Typical biochemical compositions of four biomass samples [91].
Figure 16 - Microscopic organization of lignocellulosic fibers. After Bidlack [99].
Figure 17 - Multiscale lignocellulosic biomass structure: from molecules to cells, tissues and organism. After Mettler, Vlachos [100]
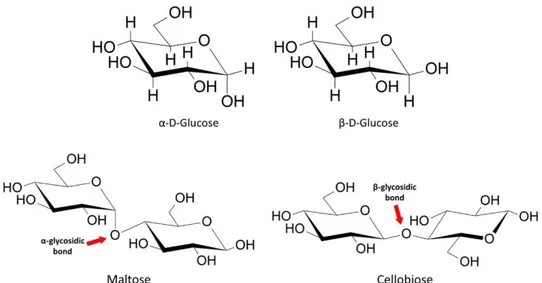
Figure 18 - α and β anomers of glucose; glycosidic bonds in maltose and cellobiose. Figure 19 - Intra and inter hydrogen bonds in cellulose.
Figure 20 – Xylan and glucomannan polymeric structure [106]. Figure 21 - Monolignols and derived phenyl-propanoid units. Figure 22 - Typical bonds in lignin polymer structures.
Figure 23 - Scheme for the classification of compounds in resins
Figure 24 - Typical terpenes present in lignocellulosic biomass: Monoterpene limonene, diterpene abietic acid and politerpene β-Carotene.
Figure 25 - Molecular structure of some typical fatty acids found in lignocellulosic biomass Figure 26 - Schematic classification of phenolic compounds
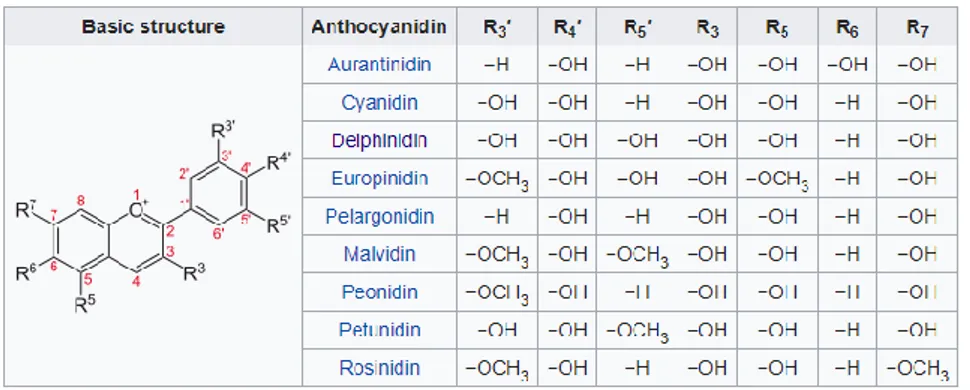
Figure 27 - General structure of anthocyanidins, and the position of functional groups characteristic of some species.
Figure 29 - Molecular structure of benzoic and cinnamic acids, precursors of the phenolic acids.
Figure 30 - Gallic and ellagic acid. The second is the result of combination of two gallic acids by two esterification steps.
Figure 31 - Hydrolysable tannins. Glucogallin and corilagin. Figure 32 - The five possible nucleotides
Figure 33 - Main chlorophyll configuration present in plants and algae. Figure 34 - Some sugars present in algae.
Figure 35 - Scatter plots of biomass composition (cellulose, hemicellulose, lignin, and extractives) versus the carbon content (weight fraction).
Figure 36 - Scatter plots of biomass composition (cellulose, hemicellulose, lignin, and extractives) versus the hydrogen content (weight fraction).
Figure 37 - Reference species for biomass characterization
Figure 38 - Van Krevelen diagram reporting the composition of some solid fuels (after Hurt [143])
Figure 39 - Van Krevelen diagram: lignocellulosic biomass samples and the reference species Figure 40 - System of equations used to find the solution for the samples characterization. Figure 41 - Composition of typical lignin samples, lignin reference species and characterization range
Figure 42 - Composition of biomass samples, the reference species (except extractives) and the reference mixtures that allow to determine a mobile characterization range.
Figure 43 - Van Krevelen diagram: The reference mixtures defined with standard ratios of reference species and the characterization range.
Figure 44 - Parity diagrams of experimental and predicted biomass composition in terms of cellulose, hemicellulose, lignin, and extractives.
Figure 45 - Optimal splitting parameter α (ratio between cellulose and holocellulose) as a function of H% for the overall database, for the wood, and for the grass/cereal samples Figure 46 - Characterization limits for both grass and wood set of equations. The colored area represents the region in which no reference specie return unfeasible values.
Figure 47 - Grass/Cereal Samples. Contour map of TGL and TANN estimated values. Feasible region from the intersection of TANN and TGL surfaces.
Figure 48 – TANN and TGL species versus biomass hydrogen content. Figure 49 - Correlation between TANN and TGL species
Figure 50 - Scheme of characterization procedure.
Figure 51 - Van Krevelen diagram showing the composition of Algae (initial, protein and inorganics-free)
Figure 52 - Composition of proteins from algae (as reported in Chapter 2), proteins obtained with the characterization method, and reference protein species (C, H and PROT-O).
Figure 53 – Characterization of Arthrospira platensis. Steps for definition of weight fraction of reference species. The first column refers to the C/H/O/N compositions of Figure 51. Figure 54 - Scatter diagram of experimental and predicted protein content.
Figure 55 - Multistep kinetic mechanism of cellulose pyrolysis.
Figure 56 - Pyrolysis of cellulose. Left Panel: TGA at 1 and 10 °C/min[170], 100 and 1000 °C/min [171]. Right Panel: TGA at 5, 20, and 60 K/min [172].
Figure 57 - Thermogravimetric analysis of xylan and glucomannan samples at 3, 10, 20, and 80 K/min. [181-192].
Figure 58 - Multistep kinetic mechanism of cellulose pyrolysis.
Figure 59 - Pyrolysis of Hemicellulose: thermogravimetric analysis of commercial xylan, glucomannan and hemicellulose extracted from two different cereals (rice husks and corn stalks)..
Figure 60 - Torrefaction of Xylan. Mass loss versus temperature program [193] and reaction time [194].
Figure 61 - Multistep kinetic mechanism of pyrolysis of the three reference lignins.
Figure 62 - Pyrolysis of Lignin: thermogravimetric analysis of the three reference species at 20K/min.
Figure 63 - Heavy molecular weight lignin (HMWL). Lumped components C24H28O4
Figure 64 - Lignin pyrolysis (heating rates 20 K/min). Comparisons of model predictions (lines) and experimental data (marks) [199-201]
Figure 65 - TGA and DTG of condensed tannins samples heated at 10 K/min, model predictions (lines) and experimental data (marks).
Figure 66 - TGA and DTG of lumped specie for resins (TGL) and natural vegetable oils, heated at 20 K/min, model predictions (lines) and experimental data (symbols) [210, 211]
Figure 67 - Comparisons of predicted (lines) and experimental (marks) TGAs of Pinus radiata (Left Panel) and Wheat Straw (Right Panel) at heating rate of 80 K/min [201, 216].
Figure 68 - Comparisons of predicted (lines) and experimental (marks) TGAs of Oil Palm Shell (Left Panel) at heating rate of 20 K/min and Softwood bark (Right Panel) at 10 K/min. Figure 69 - Comparison of predicted (line) and experimental (marks) TGA of Almond shell at heating rate of 2 K/min. DTG of the reference species that characterize this sample.
Figure 70 - Effect of ash content on the yields of bio-oil from fast pyrolysis of biomass in the VTT pyrolyzer [236].
Figure 71 - Cellulose Pyrolysis: Selectivity towards active cellulose and levoglucosan as a function of the reaction temperature.
Figure 72 - Cellulose pyrolysis. Selectivity towards active cellulose and towards levoglucosan as a function of the ash parameter AF. Solid lines refer to the kinetic scheme of Table 20. Figure 73 - Thermal gravimetric analysis of fuels in nitrogen showing mass loss at 25 K/min for Algae (Macrocystis pyrifera and Fucus Vesiculosus) and ligno-cellulosic biomass (Oat straw, Willow, and Miscanthus). [After Ross, Jones [117]].
Figure 74 - Pyrolysis of proteins. Comparison of experimental pyrolysis of several protein samples (symbols) and predicted value (line) of TGA at 10 K/min.
Figure 75 - Details on the evolution of important intermediate species.
Figure 76 – CO2 release from calcium carbonate at different heating rates. Comparison of predicted results (lines) and experimental data (marks)
Figure 77 - Decomposition of NH4NO3 at different heating rates. Comparison of predicted results (lines) and experimental data (marks)
Figure 78 - Predicted thermogravimetric analysis of reference species: proteins, sugars, lipids, and inorganics at 10 K/min.
Figure 79 - Thermal gravimetric analysis of algae samples. Comparison of predicted results (lines) and experimental data (symbols) [117, 120, 250-253].
Figure 80 - Comparisons of isothermal tests.
Figure 81 - Overview of the major approaches used to improve the quality of the pyrolysis bio-oils. Adapted from [271].
Figure 82 - Chemical composition of several bio-oils (weight fraction of total bio-oil) [283]. Figure 83 - H-abstraction reactions. Rate constants of H, OH and CH3 (per H-atom) for single primary, secondary, tertiary H-atoms (top) and for secondary H-atoms in alkyl, vinyl and allyl-sites (bottom).
Figure 84 - Dehydration reactions of 2-butanol to form 1-butene and 2-butene, via four center molecular reactions.
Figure 85 - Glycerol pyrolysis. Successive water elimination reactions
Figure 86 - Pyrolysis of glycerol at 1 atm. Effect of temperature on gaseous product yields. Comparisons of experimental data (symbols) [304] and model predictions (lines).
Figure 87 - Pyrolysis of glycerol at 1 atm. Comparisons of experimental data and model predictions [305]
Figure 88 - Levoglucosan pyrolysis in a flow reactor [306]. Left panel. Levoglucosan fractions at 898 and 973 K. Right Panel. Successive decomposition reactions of LVG and predicted yields of 5-hydroxymethyl-furfural, furfural, furan, and benzene at 973 K.
Figure 89 - Pyrolysis of levoglucosan. Comparisons between experimental data (symbols) [309] and model predictions (lines).
Figure 90 - Hydroxymethyl-furfural pyrolysis in a flow reactor at 898 and 973 K [306]. Left panel: comparisons of experimental data (symbols) and model predictions (lines). Right panel: predicted successive decomposition products.
Figure 91 - Mole fraction profiles of major species during the stoichiometric oxidation of anisole at residence time 2 s and 106.7 kPa. Symbols refer to experiments [318] and lines to model predictions.
Figure 92 - Effect of secondary gas-phase reactions on volatile species released from cellulose pyrolysis at 700°C and 800°C. Comparison between experimental data (symbols) [31] and model predictions (lines).
Figure 93 - Volatile species released from lignin pyrolysis at different temperatures with residence time of 3.6 s in the second tubular reactor. Comparison between experimental data [33] (symbols) and model predictions (lines) with (dark lines) and without using the experimental intermediate data of lignin pyrolysis (light lines).
Figure 94 - Fast pyrolysis of pine sawdust. Comparisons of experimental data (symbols) [331] and model predictions in terms weight yields of bio-oil (including water), gas, and residual biochar vs reactor temperature. Effect of residence time of biomass particles: 10 min (solid lines), 5 min (dashed lines), and 2 min (dotted lines).
Figure 95 - Pine wood pyrolysis. Comparisons between experimental data (symbols) and model predictions (lines) in terms of organic oil, water, gas, and residual biochar yields respect to the initial biomass [333]. Oil and gas profiles are reported for gas residence time of 1 s (solid lines) and 5 s (dashed lines).
Figure 96 - Predicted typical yields of bio-oil, biochar and gas from fast pyrolysis of different biomass samples (residence time: solid 5 min, gas 2 s)
Figure 97 – Analysis of the three samples
Figure 98 – Cellulose, Hemicellulose and Lignin Pyrolysis. Comparisons between experimental data (symbols) and model predictions (lines) in terms of bio-oil and gas. Oil and gas profiles are reported for gas residence time of 2 s (solid lines).
Figure 99 - Xylan pyrolysis. Yield of biochar, gas and bio-oil, CO and CO2 [182].
Figure 100 - Distribution of condensable products of hemicellulose from different types of biomass. Comparison between predicted (GMSW, XYHW, XYGR) and experimental data of Softwood (Pinus, Tsuga), Hardwood (Eucalyptus, Fraxinus) [336] and Grass/Cereals (Corn stalk, rice straw) [335]
Figure 101 - Comparison of experimental [283] and predicted products from the fast pyrolysis of softwood (pine), hardwood (eucalyptus), and grass samples.
Figure 102 - Cellulose Pyrolysis and the effect of ash on organic yield.
Figure 103 - Four stages of structural rearrangements leading to crystalline order (after [344]. Figure 104 - Elemental C/O/H composition of dry ash-free biochar as a function of the pyrolysis peak temperature. Dashed lines are given in eq. (2)-(4). Open symbols: wood. Solid symbol: non-wood. After Neves, Thunman [345].
Figure 105 - Raman spectra of the biomass chars. (after Guizani, Haddad [346]) Figure 106 - Rate constant of the release of metaplastic species.
Figure 107 - Torrefaction of (A) Spruce (Softwood) and (B) Birch (Hardwood) [347]. Comparison of experimental data (bars) and model predictions (lines) in terms of biochar yield and composition vs pyrolysis temperature.
Figure 108 - Pyrolysis of peanut shell (A) [348], waste wood shavings (B) [349], and maple wood (C) [43]. Comparison of experimental data (bars) and model predictions (lines). Figure 109 - Parity diagram of experimental and predicted values of biochar yield
Figure 110 - Parity diagrams of experimental and predicted values of biochar elemental composition
Figure 111 - Distribution of residuals (experimental-prediction) of elemental composition and yields of biochar vs peak pyrolysis temperature.
Figure 112 - Predicted pyrolysis of a typical wood biomass, heated at 20 K/min, and the evolution of the elemental composition of the solid residue.
Figure 114 – Possible cluster structures of biochar at increasing pyrolysis temperatures. Figure 115 –Estimated values of γ (density of active sites) and the exponential correlation in function of the carbon content.
Figure 116 – Evolution of the surface area per unit of volume, as a function of the conversion, for several values of φ.
Figure 117 - Surface area per unit of mass of Biochars.
Figure 118 - Potential energy diagram for oxidation of pyrenyl radical by O2. Potential energies calculated at the G3(MP2,CC) level are shown in kilocalories per mole relative to the C16H9|i1 + O2. (After Singh, Mebel [379])
Figure 119 - H-abstraction from benzene (A) and equivalent path on gas-solid (B).
Figure 120 – Oxidation of biochar under air atmosphere at 5, 10 and 15 °C/min. The biochars were obtained by pyrolysis of raw wood at 527 °C.
Figure 121 - Oxidation of fir wood biochar under air atmosphere at 10 °C/min. Demineralized fir wood was pyrolyzed at 527 °C to produce the biochar.
Figure 122 - Oxidation of beech wood and oat bark biochar under air atmosphere at 10 °C/min.
1
CHAPTER
1
INTRODUCTION
1.
Mankind, Biomass, Energy and Materials
The development of human life into the modern society we live today was aided by technological improvements along the time span of our species existence. At first, primitive human being developed tools for aiding daily tasks for life support, such as hunting and defending from predators. The technological achievements were always useful for a period of time, until a better technology overcome the previous, including the discovery of new materials and methods of production. Using energy for supporting human activities started with the discovery of fire, but it took a long time from its discovery to its mastery. According to Gowlett [1], interaction with fire occurred in three steps, evolving from passive to active use: fire foraging for resources across landscapes; social/domestic hearth fire, for protection and cooking; and fire used as tool in technological process, such as pottery and metallurgy. When mankind mastered the technics of starting and manipulating fire, there was a revolution on the way to produce, manage and consume food, equipment, protection, hunting and other activities, and an expansion of environments that humans could survive took place [1]. Fire provided means of modifying and greatly extending the range of
2
properties available in materials themselves [2]. From the beginning, biomass was the main source of fuel to generate heat by combustion, until mankind discovered other sources [3].
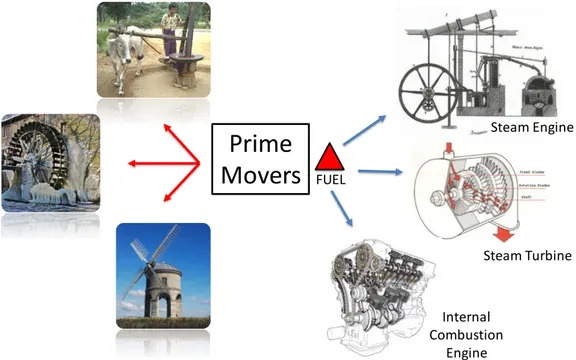
Human activities also evolved supported by the sources of power available to perform daily tasks. An important concept in this discussion is “prime mover”, which consist of any tool/mechanism that can convert a prime form of energy into mechanical power [4]. Figure 1 schematically shows different sources used by man to power the prime movers. Chronologically, mechanical power was produced by human power, then by animal power, followed by water and wind flows (sails, waterwheels and windmills). Up to this moment, fire was used to generate heat and the prime movers to generate mechanical power. A revolution started when mankind learned how to transform heat into mechanical power, through the invention of steam engines, which could be powered by mostly any fuel, despite the low efficiency of about 0.5% of chemical energy conversion in the early 18th century [4]. This was
a great technological achievement, as fuels could be stored and used on demand, differently than relying on weather conditions for wind and seasons for water flows. Further developments on steam engines significantly increased efficiency, using higher pressure regimes and separate condensers, allowing the application in trains and ships, which lead to affordable and regular intercontinental freight and passengers transport [4]. Later, internal combustion engines were invented, which have significantly improved power conversion efficiency and reduced the equipment size, due to skipping the steam generation step. However, most of the efficiency improvements were attained by making the machines progressively more specific in terms of operating conditions and fuel. The range of possible fuels to be used was shrank, massively driving the economy to liquid and gas fossil fuels systems. Efficiency in these modern engines and turbines reach about 40% conversion efficiency [4].
3
Figure 1 - Sources of power used by man on prime movers
Not only energy, but also the access to materials was determining to mankind evolution. Early human beings used to build with the available and ready-to-use materials such as stones, wood, bones and fibers [2]. With increasing capacity of manipulating materials and energy, refined materials such as bricks, metals, glass and plastics could be made. Nowadays, materials science not only try to increase size and speed of production and reduce costs, but also can design specific materials for each purpose [2]. Most of the materials and tools produced nowadays use petroleum-derivate compounds at some degree, either in its composition or in the production process, that it becomes very hard to imagine our current society without petroleum reserves. The greatest concern regarding using petrol as both fuel and raw material is that once used as fuel, it cannot be recycled. The USA, for example, transform about 97% of crude petroleum to produce a variety of fuels, while only 3% is used as petrochemical feedstock, lubricants and waxes [5]. With our current technology, there is no affordable option to fully substitute crude petroleum as feedstock for materials. Despite the issue on costs of production, it is already possible to obtain similar molecules from biomass. However, crude oil transformation into fuels and chemicals is still much easier for several reasons including the infrastructure present, the transportation of the raw material and its chemical properties.
Looking back into human history, it becomes clear that in order to put aside one technology, a better one must be able to substitute. Taking a step back and resume the
Prime
Movers
FUEL Steam Engine Steam Turbine Internal Combustion Engine4
exploration of renewable resources is necessary for the sustainable development of our society and economy. However, this time we must put our efforts into developing technologies to transform renewable materials into compounds that can fit and substitute non-renewable materials, and perhaps that can even work in a better way. Not only as a challenge to our capability of improving technologies, substituting fossil fuels is also a required task to keep our civilization in this level of development.
2.
World Energy Scenario
As energy plays a key role in most of our daily tasks and in the development of our economy [6], the combination of global population growth and constant rising in living standards is significantly impacting the worldwide demand for energy and materials over the last several decades [7]. The extensive exploration of fossil fuels in the last century provided the necessary boost for this worldwide development. However, we have reached a point that fossil fuel reserves are shortening and the atmospheric pollution is rising to critical levels in several countries. As a result of the combustion process, fuels introduce CO2 to the
atmosphere, which is the major responsible for greenhouse effect. This effect actually is necessary to maintain life conditions on earth, by reflecting partially the infrared waves emitted from earth. However, this increase in atmospheric CO2 concentration is breaking the
balance and rising the global temperatures. Moreover, not only greenhouse gases are emitted from fossil fuel combustion, several other pollutants like soot, partially unburned fuels, carbon monoxide, SOx and NOx compounds are also emmited. These pollutants are
responsible for acid rain, smog effect and increasing number of respiratory problems mainly in metropolitan areas.
The International Energy Agency (IEA) recently released the report “Key world energy statistics - 2017” [8], which reports interesting numbers of the global energy scenario. Some important data was extracted from this report and is shown in Table 1. Figure 2 shows the area plots of different fuels distribution in the world energy matrix of 1973 and 2015. The plot divides fuels in oil, coal, natural gas, nuclear, hydroelectricity, biofuels and waste, and the remaining sources are grouped in others, accounting for geothermal, solar, wind and tide/wave/ocean.
5
1973 2015 Growth (%) 2040 (EIA)
Fuel Mtoe % Mtoe % In capacity In share Mtoe % Fossil Non-Renewable Oil 2819 46.2 4326 31.7 53.5 -31.4 5670 30.0 Coal 1495 24.5 3835 28.1 156.6 14.7 4032 21.3 Natural Gas 976 16 2948 21.6 202.0 35.0 4662 24.7 Non-Fossil Nuclear 55 0.9 669 4.9 1117.8 444.4 1134 6.0 Renewable Hydro 110 1.8 341 2.5 210.7 38.9 3402 18.0 Biofuels & Waste 641 10.5 1324 9.7 106.6 -7.6 Other 6 0.1 205 1.5 3255.3 1400.0 Total 6101 100 13647 100 123.7 - 18900 100
Table 1 – World energy scenario in 1973 and 2015. Global capacity by energy source and their share on the global energy matrix
Figure 2 – Percentual share of fuels in the world energy matrix (1973 – 2015)
By grouping the fuels in just two categories (Figure 3) we can say that, global energy matrix in 2015 was majorly composed by fossil fuels, with only 18.6% contribution of non-fossil fuels. If we sort these fuels by their renewability, we have an overwhelming 86.3% share of non-renewable fuels in the matrix.
1973
Oil Coal Natural Gas Nuclear Hydro Biofuels and Waste Other
2015
Oil Coal Natural Gas Nuclear Hydro Biofuels and Waste Other
2015
Oil
Coal
Natural Gas
Nuclear
Hydro
Biofuels and Waste
Other
2015
Oil
Coal
Natural Gas
Nuclear
Hydro
Biofuels and Waste
Other
Oil
Coal
Coal
Gas
Gas
Oil
6
Figure 3 – World energy scenario (2015), comparison of different grouping of the fuels by their characteristics
From 1973 to 2015, the world total primary energy consumption more than doubled, increasing from 6101 to 13647 Million Tons of Oil Equivalent (Mtoe) (Figure 4). This growth in demand was supported
by increasing energy production by all means, but they have increased in different rates. The bar plots in
Figure 5 reports the growth of each category, comparing with the global growth. In terms of share growth in the matrix, hydroelectricity increased by 40%, nuclear power by 5.5 times, and geothermal, solar, wind, tide/wave/ocean significantly increased 15 times. In terms of capacity growth, these numbers become even more interesting: Biofuels and waste production doubled, hydroelectricity tripled, nuclear power increased 12 times, and together geothermal, solar, wind, tide/wave/ocean energy production increased by remarkable 33.5 times. This means that many efforts were done and new technologies are rising and they are being progressively refined, allowing this energy resources to fulfill a significant share of the global energy demand. Besides being the largest producer of electricity from coal in 2015 (4109 TWh), China has shown remarkable achievements in production of renewable energy from all means (1398 TWh), generating more than twice the USA production (the second place). China alone consumes about 22% of the world energy demand. Together with the USA, they reach about 40% of the world energy demand.
7
Figure 4 - Absolute share of fuels in the world energy matrix (1973 – 2015 – 2040 (IEA projection))
Figure 5 - Growth of absolute fuels demand from 1973 to 2015
The energy demand for the next 20 years was projected by the US Energy Information Administration (EIA) in the International Energy Outlook 2017 (IEO2017) [9], and an increase of about 30% is expected, as shown in Figure 4. The projection reports that renewables will be have the largest capacity growth, followed by natural gas, petroleum and nuclear, while coal consumption should stop increasing and remain almost constant. As the energy demand increase, CO2 emissions tends to follow the trend.
When compared to 1971, the global emissions of CO2 doubled, and the most
significant increase came from intense use of coal (as seen in Figure 6) in the industrialization of Asiatic countries (as seen in Figure 7). The Organization for Economic Co-operation and Development (OECD) is an intergovernmental economic organization with 37 member countries, founded in 1961 to stimulate economic progress and world trade. Most of the
1973
Oil Coal Natural Gas Nuclear Hydro Biofuels and Waste Other
2015
Oil Coal Natural Gas Nuclear Hydro Biofuels and Waste Other
2015
Oil Coal Natural Gas Nuclear Hydro Biofuels and Waste Other
2015
Oil Coal Natural Gas Nuclear Hydro Biofuels and Waste Other
2015
Oil Coal Natural Gas Nuclear Hydro Biofuels and Waste Other
6101
Mtoe 13647
Mtoe
2040 IEA
Oil Coal Natural Gas Nuclear Renewable
Mtoe 13647 18900 Mtoe
Renewables
0.0 50.0 100.0 150.0 200.0 250.0Oil Coal Natural
Gas Hydro Biofuels and Waste Total C ap ac ity G ro w th % 0.0 500.0 1000.0 1500.0 2000.0 2500.0 3000.0 3500.0
8
OECD members are high-income economies with a very high Human Development Index (HDI) and are regarded as developed countries. Because of their developed economy, it is expected to observe higher energy demands from countries that are part of this group. On the other hand, their growth rate in terms of energy demand is not elevated, as they are already highly industrialized. The non-OECD countries, highlighted in Figure 7, show that the non-members of the OECD had largest increase in energy demand, mostly in Asia and Africa.
Figure 6 - World CO2 emissions by fuel combustion from 1971 to 2015 (Mt of CO2) (after [8])
Figure 7 - World CO2 emissions by regions from 1971 to 2015 (Mt of CO2) (after (IEA 2017)) This increase in emissions are causing global climatic effects which are being discussed internationally since 1988 in the Toronto Conference on the Changing Atmosphere, followed by a series of global meetings and discussions, finally culminating in a formal international commitment for reduction of greenhouse gases emissions with the Kyoto protocol. This commitment expired in 2012 and it is being a hard task to meet a new global agreement for climate purposes. The reason is clear, the development of national economies relies on more energy production and consequently, more greenhouse gasses emissions. Countries with a more developed environment consciousness are putting more efforts into
9
developing new technologies and putting barriers to the expansion of fossil fuels. Moreover, countries with a more developed economy can afford to invest in science and technology, and also to set political barriers to the exploration of non-renewable fuels. This is a critical point for economies in development, which cannot afford to invest and rely only on full developed technology imported, that already has a degree of economical attractiveness.
From the information observed in these reports, it becomes clear that the energy profile around the world and along the past decades is very dynamic. Some interesting facts were reported by the World Energy Council, in the “World Energy Trilemma Index - 2017”[10], where they evaluate and rank countries in base of three indicators: energy security, energy equity and environmental sustainability. Except for New Zealand and the USA (9th and 15th rank), the other top 15 ranked countries in the index are European. This is
a result of commitments and policies that push the exploration of alternative resources and development of new technologies, which enhances the diversification of the energetic matrix of the country. These policies reduce the need of non-renewable resources and the dependency of importation from foreign countries, paving the way to self-sustainability in energy production. In other words, transiting from an oil-based economy to a multi-resources economy is not only cleaner but safer, as it protects against reserve shortages and price wars, also promotes the development of local economies.
Figure 8 – Top 15 ranked countries by the World Energy Council, in the “World Energy Trilemma Index - 2017”[10].
Furthermore, the British Petroleum recently released an updated report of the global energy status, the “BP Statistical Review of World Energy - June 2017” [11]. Agreeing to the IEA and WEC reports, and adding some interesting facts, Figure 9 clearly shows that besides
10
a global increase in energy demand, each region of the world has particularities on their energy matrix. The availability of natural resources in a territory drives the selection of means to produce energy. For example, the large reserves in Russia provides natural gas with attractive prices for European countries, which are short on fossil fuel resources. Nevertheless, relying only on importation is not safe, and the economical position of Europe allows the promotion of nuclear and renewables to provide a bigger share of the demand. The European energy matrix is the most diversified and, therefore, the safest. Brazil is rich in water bodies which can constantly provide hydroelectricity, but the country is also rich in petrol reserves. Venezuela and Bolivia have vasts reserves of petrol and natural gas. These facts strongly impact the South and Central America matrix, which as almost absent in nuclear and coal energy production. Controversially, Asiatic countries strongly rely their energy production on coal (~50%), which is the cheapest and dirtiest fossil resource. The last decades boom in Asiatic industrialization pushed the intense exploration of this abundant local resource, mainly present in China and India.
Figure 9 – 2016 energy matrix by world regions. Share of each fuel in total energy production.
Together, the shortening of fossil fuels reserves, the problems caused by its usage, and the constraints of having a highly dependent energy matrix are boosting the interests into the development of a renewable and sustainable economy. Most of the energy available in our planet is directly or indirectly coming from the sun. Exceptions are geothermal, nuclear
North
America
S. & Central
America
Europe &
11
and partially tidal energies. Solar panels directly harvest the sunlight into electricity. The energy moving a wind turbine is the result of temperature gradients caused by earth’s surface heating by the sun. Hydroelectricity harvests the potential gravitational energy of water bodies, which only exists due to the water cycle, result of the sun’s energy. Fossil fuels are the result of transformation of ancient biomass into solid (coal), liquid (petrol) and gas (natural gas) fuels. However, this process takes millions of years and is much long compared to human life span, we must assume that they are non-renewable. On the other hand, biomass can provide energy and chemicals in a time scale that we can consider renewable in the lifespan of mankind.
3.
Biomass as Renewable Source of Fuels and Materials
Biomass is another indirect form of solar energy resource, as plants grow by absorbing carbon dioxide from the atmosphere as well as water and nutrients from soils followed by converting them into hydrocarbons through photosynthesis, a process that consumes energy provided by sunlight.All carbon contained in biomass is gained from carbon dioxide. Therefore, carbon is cycled in the atmosphere when biomass is consumed as a fuel, which makes biomass a carbon neutral fuel when it is burned. Controversies exist to assume that biomass is carbon neutral, as the processing is not perfect and losses and residues needs to be accounted. Nevertheless, biomass is far more neutral when compared to fossil fuels. When planning the transition to a renewable and sustainable economy, several technologies can be applied to solve the energy problem, but biomass also play several other essential roles. The exploration of biomass with advanced technology aids the solution of multiple problems: diversifies the energy matrix, provides raw material for the production of advanced materials, explore and treat industrial and municipal residues, promotes local economy.
Biomass resources are widely and quite fairly distributed on the Earth׳s surface, differently from fossil fuel reserves. It comprises a broad range of different types of biomaterials, such as wood, forest and agricultural residues, waste from pulp and food industry, algae, energy grasses, straw, bagasse, sewage sludge, municipal solid wastes, among others. The common aspect of all these materials is that they are result of biological metabolism, and that they can be produced in a short time spam (a few days up to a few years). However, these materials widely differ in their chemical composition and physical properties. Therefore, the use of different types of biomass results in different challenges
12
and solutions for transportation, storage, feeding, and finally for converting these raw materials into more useful chemicals and substitutes for fossil fuels [12, 13].
First generation biofuels, those derived from food crops, represent a temporary answer to the energetic problem. Countries like Brazil and the USA have remarkably developed the production of bioethanol from sugarcane and corn respectively, which substitutes gasoline with few engine modifications. Also Biodiesel production from oilseeds has been significant in Brazil and Europe. Great concern lies on the expansion of first generation biofuels production, as it impacts food availability and market prices. Substituting whole countries demand of gasoline and diesel with bioethanol and biodiesel would require vasts areas of agriculture destined to fuel production, if not causing further deforestation [14]. Nevertheless, these technologies are simple and well stablished, which promoted a first push into biofuels. On the other hand, second generation biofuels, also known as advanced biofuels are based on non-food crop biomaterials [15]. These biofuels require specific pre-treatments and application of high technology for production and replacement of fossil fuels in large scale [6, 15]. Third generation biofuels are derived from micro and macro algae. Modern biotechnology is capable of genetically modify algae allowing them to direct produce target molecules, such as alcohols and acids, which can be direct used as liquid fuels. Algae outcomes for their fast growth rate and elevated lipid production per land area occupied.
While first generation biofuels technology use fermentation to transform sugars into alcohols (bioethanol) and triglycerides in methyl/ethyl-esters (biodiesel), second generation biofuels rely on several different technologies to transform a wide range of raw materials into fuels and chemicals. Biochemical and thermochemical are the main routes for this transformation. The first uses microorganisms, enzymes and/or acid/alkali to break down the complex structure and separate the components, which is an interesting process for high moisture feedstock, as the process usually occurs in aqueous medium. Products are usually biogas (methane) and alcohols from fermentation. Figure 10 schematically shows the biomass conversion routes and the products obtained.
13
Figure 10 – Biomass conversion routes into fuels.
The thermochemical route uses heat to break down biomass structure. The main thermochemical transformations of biomass are pyrolysis, combustion, gasification, hydrothermal liquefaction and hydrothermal carbonization.
Pyrolysis is the thermal degradation of a material in the absence of an oxidizing agent. The process releases condensable and non-condensable volatiles (tar and light gases), together with a solid residue (biochar). Figure 11 shows a scheme of typical biomass pyrolysis process and the resulting products.
Tars condense when cooled down, forming the bio-oil, which can be used as substitute for crude petrol oil, directly employed for power and heat generation or even upgraded to liquid fuels for internal combustion engines [16, 17]. For this last purpose, reducing the oxygen content of bio-oil via catalytic hydrotreating/hydrogenation [18] or catalytic cracking [19] must be required to improve its heating value. The wide range of chemical components in the bio-oil supports its use in a biorefinery concept. Light gases can be directly used for heat and power generation in burners, turbines and internal combustion engines. Biochar can be employed as soil amendant, as a domestic cooking fuel instead of wood, upgraded to high-value activated carbon for cosmetic and pharmaceutical purposes, or used in the metallurgical industry instead of coal, among others [20]. Light gases can be used also in internal combustion engine.
Moisture
14
Figure 11 - Scheme of thermochemical conversion of biomass. Typical products obtained after pyrolysis.
Pyrolysis operating conditions can be adjusted to improve the yield of desired products. In this sense, torrefaction, slow pyrolysis, fast pyrolysis and flash pyrolysis are the possible variations to this process. Torrefaction is a pyrolysis performed at low temperatures (180-300oC) for long residence times, improving some properties of the material such as
grindability, hydrophobicity, heating value, and reduce biological activity. In this process, the main components partially decompose and re-polymerize, releasing some oxygen-rich functional groups. This process starts to form the typical polyaromatic char structures, while the solid loses about 20% of initial mass. Slow pyrolysis (300-400oC) is typically used with
large particle sizes for biochar production, with hours of residence time and slow heating rates, allowing also cross-reticulation and tar repolymerization. Fast pyrolysis (400-600oC)
aims the production of liquids by using temperatures and residence times adequate for devolatilization, but not for tar cracking. Flash pyrolysis (above 600oC) uses small particle
sized and very high heating rates to force the conversion into gases by promoting complete devolatilization and tar cracking.
Gasification is the thermal degradation of biomass in the presence of an oxidizing agent (Air, pure oxygen, steam or CO2). The material is partially oxidized generating a mixture
of gases (producers gas), mainly composed by CO, CO2, H2O, CH4, H2, N2 (when air is used),
together with reduced amounts of tars, char and ashes. The aim of this process is increasing
Pyrolysis
Reactor
Biomass
Pretreatment Condenser Gas Bio-Oil Biochar15
significantly the yield of gases, in comparison to the pyrolysis alone. This mixture of gases, also called producers gas, can be used for the same purposes as the light gases from pyrolysis, but can also be employed to make liquid fuels through Fischer-Tropsch synthesis [21-23].
Combustion is the complete oxidation of the feedstock, producing mainly CO2 and
H2O, together with minor amounts of secondary combustion sub-products. This process does
not consist in a fuel conversion technology, it is a heat/electrical energy generation process. The hydrothermal liquefaction is a process that direct liquefies organic matter suspended in an aqueous medium, without the drying step. Temperatures at 250-400oC and
high pressure (up to 200 bar) promotes this transformation method [24]. Hydrothermal carbonization uses similar technology, but at lower temperatures (180-250oC) and longer
residence times, promoting the formation of higher solid yields.
Figure 12 shows schematically the typical distribution of products from different thermochemical conversion processes of biomass. In addition, Table 2 reports these processes and the characteristic residence times of volatiles and solids
Residence time Product Yields (wt.%) Mode Temperature [°C] volatiles solid Liquid solid gas
Fast Pyrolysis 500 1-2 s 75 12 13
Intermediate Pyrolysis 500 5-30 s 50 25 25
Slow (Carbonization) 400 hours-days hours 30 35 35
Torrefaction 280 10-60 min 0 80 20
Gasification 750-900 1-5 s 3 1 95
16
Figure 12 – Typical product spectrum from thermochemical conversion processes (After Bridgwater [13])
These thermochemical processes can be used also as a complementary method for residue treatment from other industrial activities. These residues could either be costly to dispose or even cause environmental issues. The non-convertible compounds in a biochemical conversion leave residues, such as bagasse from sugarcane. Pulp industry and food processing produce large amounts of organic residues (e.g. black liquor, soybean/olive cake). Solid municipal waste and sewage sludge are daily produced in large amounts and represent a big problem for metropolitan areas. Cattle and poultry manure is produced in rural areas and release CH4, which is much more hazardous than CO2. All these residues can
be treated through thermochemical conversion, solving the problem of waste dumping and creating additional value to the whole process.
Thermochemical conversion of biomass open paths to very promising technologies, not only for remediation of immediate problems but to find long term solutions for human activities. Much information was already acquired in the past decades, but many efforts are still required to build knowledge and develop efficient and affordable technologies. In the next section, a brief review of the state-of-the-art both on experimental activities and modeling will be reported.
4.
State-of-the-Art of thermochemical conversion of
biomass
4.1. The Multi-Complexities of the Problem
Fully understanding of the thermochemical conversion of biomass is very challenging as its complexity occurs at several levels:
Multi-component problem: Biomass is a complex feed and also its composition widely varies, requiring a proper characterization.
Multi-phase problem: The biomass first reacts in a condensed phase and forms a solid (biochar), a liquid (bio-oil), and a gas phase. Successive heterogeneous solid reactions involve the bio-char, while gas and bio-oil react in the gas-phase.
Multi-scale problem: The chemical reactions occurs at the molecular level, but transport phenomena compete with chemical kinetics and needs to be
17
considered both at particle and reactor scale. Different time scales also take place in the overall process.
Because of its complexity, understanding all the aspects involved in this process require extensive experimental activity to produce data, followed by the mathematical modelling activities that process these data and help the understanding of the phenomena. Modeling this process is still a challenge, but constitutes an essential step to better understand the aspects involved and provide tools to the design of improved systems and reactors.
Much is already understood about the multicomponent aspect of biomasses. Most of this information derives from intense experimental activity to unveil the composition and properties of these materials. Institutions such as the National Renewable Energy Laboratory (NREL) and the American Society for Testing and Materials (ASTM) propose standard preparation procedures and complete analytical methodologies [25]. The analytical methods and sort of experimental data obtained with them will be discussed later.
4.2. Pyrolysis: Measurements and Analysis of Products
4.2.1. Kinetic and Thermal Regimes
Investigating and developing general kinetic mechanism of solids decomposition require especial attention to avoid fluid dynamics effects. Data must be gathered from experiments in which heat and mass transfer characteristic times are negligible to allow proper observance of the kinetics of the process. These aspects define the reactive regime that is taking place in the experiment. For this matter, two dimensionless parameters essentially define four different regimes. The Biot number (BI) introduces the ratio of heat transfer resistances inside of and at the surface of a particle. This ratio determines whether or not the temperatures inside the solid has significant variation in temperature profile along the space. The Pyrolysis number (Py), on the other hand, introduces the ratio of heat exchange and the kinetic characteristic times. This ratio indicates whether the chemical kinetics of the process or the global heat transfer is determining the evolution of the system. The equation (1) describes the Biot number, which is defined by the external heat exchange coefficient (hext), the diameter of the particle (Dp) and the thermal conductivity of the material (Equations (2) and (3) define the Pyrolysis number in two different cases, when the internal or external heat transfer, respectively, are controlling the heat exchange. The definition of the Pyrolysis number involves also the density of the particle (ρ), the specific heat (Ĉ), and the kinetic constant (K).
18
ext p ph
D
Bi
(1) int 2ˆ
p p pPy
C K D
(2)ˆ
ext ext p ph
Py
C K D
(3)When plotting the values of BI and Py for different particle sizes and external temperatures, the four different pyrolysis regime can be defined, as seen in Figure 13. At high temperatures, for particles larger than 100 μm, the pyrolysis assumes a conduction-limited process (lower-right), while for smaller particles, the process becomes convection-limited (lower-left). On the other hand, by working with smaller particles and/or low temperatures, the regime becomes kinetically-limited (upper-right) or even can reach kinetically-limited with isothermal conditions (upper-left).
19
Figure 13 - The four pyrolysis regimes defined by Biot and Pyrolysis numbers.
Therefore, the experiments considered in this work take place preferably in the kinetically-limited region, meaning that BI<<<1 and Py>>>1. Several experimental apparatuses are nowadays available and frequently used for this kind of investigation. It is worthwhile to describe the most relevant ones.
4.2.2. Experimental Devices for Kinetic Measurements
A thermogravimetric analyzer (TGA) provides a simple but very useful way to investigate the thermal behavior of a sample (Bach & Chen, 2017; Cai et al., 2018; Murillo, Biernacki, Northrup, & Mohammad, 2017; Shurong Wang et al., 2016). The derivative of mass loss (DTG) is contemporaneously produced. The analysis can be performed isothermally or with a temperature program, under normal or pressurized, inert or oxidizing atmosphere, with tiny or relevant sample sizes (micro and macro-TGA). This versatile method identifies the mass loss profile under different conditions, providing information for understanding the decomposition mechanisms, which can even support forest fire prevention. Once individuated the thermal behavior of each major component of biomass, the method can also be used to quickly estimate their amounts in a biomass sample [26]. Recently, TGA apparatus incorporates also differential thermal analysis (DTA) and differential scanning calorimetry (DSC), which gives information on the endo/exothermicity of the process. TGA has been performed for decades to gather global kinetics of biomass and its components but no intrinsic kinetics can be measured.
TGA provides good conditions for slow heating rates, by exchanging heat through the controlled temperature of the flowing gas. However, different set-ups are required for fast pyrolysis experiments, providing faster heating rates to the sample.
Micro-pyrolyzers serve this purpose by providing a pre-heated environment where the solid is dropped, and sometimes a second-stage reactor is also present for gas-phase kinetic studies. The two stage allow to investigate separate residence times and temperatures for solid and gases. It also offers the possibility to couple analytical techniques like gas-chromatography coupled with mass spectrometry (MS), time-of-flight mass spectrometry (TOF-MS) or Flame Ionization Detector (FID), for qualitative and quantitative measurement of volatiles [27-29]. Similar apparatus, U-shaped two-stage reactor, was used from Norinaga and collaborators for both cellulose and lignin studies [30-34]. Pyro-probe offers similar conditions, but in a horizontal set-up. However, the heat is electrically provided through the sample holder, not by the surrounding atmosphere. It allows precise controlling

![Figure 8 – Top 15 ranked countries by the World Energy Council, in the “World Energy Trilemma Index - 2017”[10]](https://thumb-eu.123doks.com/thumbv2/123dokorg/7498410.104323/37.892.182.780.675.953/figure-ranked-countries-world-energy-council-energy-trilemma.webp)

![Figure 1 shows the relative concentration of several carbohydrates, lignin, extractives, and ash in different lignocellulosic biomass samples [91]](https://thumb-eu.123doks.com/thumbv2/123dokorg/7498410.104323/57.892.249.711.531.796/figure-relative-concentration-carbohydrates-extractives-different-lignocellulosic-biomass.webp)