QUADERNI DEL DIPARTIMENTO DI ECONOMIA POLITICA E STATISTICA
Margherita Casini Francesca Gagliardi Gianni Betti
Sustainable Development Goals indicators: a methodological proposal for a fuzzy Super Index in the Mediterranean area
1
Sustainable Development Goals indicators: a methodological proposal for a
fuzzy Super Index in the Mediterranean area
Margherita Casini, Francesca Gagliardi and Gianni Betti
Abstract
This paper provides a methodological proposal for the construction of a multidimensional index for sustainability assessment in the context of the Sustainable Development Goals (SDGs) of the 2030 Agenda for Sustainable Development. In particular, the paper proposes a new methodology to properly estimate the multidimensional nature of sustainable development and the SDGs introducing an innovative fuzzy approach. Specifically, we present a multidimensional methodology to build a Super Index to measure the performance of the Mediterranean countries towards the SDGs with a focus on the agro-food sustainability in line with the Partnership for Research and Innovation in the Mediterranean Area (PRIMA). For this purpose, drawing on the fuzzy approach developed by Betti et al. (2015), a step by step procedure is provided in the paper: first the underlying dimensions of a set of selected indicators for the SDGs are identified through an exploratory factor analysis and then an innovative weighting methodology is applied for the aggregation of the indicators to calculate the countries’ scores for each dimension and finally the overall index.
2
1. Introduction
In order to assess sustainability, the development of methods able to capture its multidimensional nature is today fundamental to guide policy makers in implementing appropriate strategies to achieve the SDGs of the 2030 Agenda for Sustainable Development (hereinafter Agenda 2030) as well as to monitor the progress towards such goals.
Sustainable development plays indeed nowadays a key role for humanity and the future of our planet. It is a complex phenomenon which involves not only economic growth, but also the integration of other important dimensions for long term global development: social equity and environmental protection. The relationship between these multiple dimensions is at the core of the SDGs in the Agenda 2030 and it was first advocated in the 1987 Brundtland Report which paved the way for the modern concept of sustainable development. In the recent years, in fact, growing concerns have been raised about the unsustainability of the current patterns of economic growth associated to inequality, social issues, environmental degradation and natural resources depletion. Such concerns have sparked public and literature debate to rethink development worldwide. In 2015, the UN established 17 SDGs, also called the Global Goals, to set the world towards a sustainable form of development. Hundreds of official indicators have been adopted to monitor and quantify the progress on these goals, which are integrated, indivisible and balance the multiple dimensions of sustainable development.
It is hence necessary to consider these multiple and interrelated dimensions simultaneously to correctly assess sustainability and the progress on the SDGs. To this end, we have introduced a methodological proposal for the construction of a multidimensional index for sustainability assessment through an innovative fuzzy approach. This enables to weight and aggregate the SDG indicators to better capture the multidimensionality of sustainable development. The basic idea of the new approach is that the indicators for the SDGs may belong to more than one goal at the same time and not only to one specific goal exclusively due to their multidimensional and integrated nature. According to the proposed methodology, the dimensions identified using a set of indicators for the SDGs are seen in the form of fuzzy sets to which the indicators may simultaneously belong to varying degrees. The membership of an indicator to more than one dimensions thus becomes a matter of degree rather than a simple true-false binary attribute as in the classical crisp approach.
This new methodology draws on the fuzzy approach developed by Betti et al. (2015) to build a multidimensional index of poverty and deprivation. Indeed, the fuzzy set theory, initiated by Zadeh in 1965, has proved to be an effective tool to describe the multidimensional nature, complexity and vagueness of social phenomena such as poverty, the quality of life and sustainable development.
In particular, the methodology is applied to the 17 Mediterranean countries involved in the PRIMA programme to construct a Super Index to measure the agro-food sustainability in such countries. Today, in fact, environmental, economic and social issues are severely challenging the sustainability of the agro-food system in the region with harmful impacts on the well-being and prosperity in the Mediterranean basin.
Building a Super Index to assess the sustainability in a multi-country comparative context, such as the Mediterranean area, is a complex task for the difficulty in finding available and internationally comparable data for all countries, the choice of suitable and statistically sound
3
indicators and the adoption of appropriate weighting and aggregation methods able to capture the multidimensional nature of sustainable development and the SDGs.
This paper is organized as follows. In section 2, after the description of the concept of sustainable development, the Agenda 2030 and the PRIMA programme, we analyse the statistical quality of the main datasets available for the SDGs indicators according to specific criteria examining both the primary and secondary sources. Then, in section 3, we identify and evaluate the indicators covering mainly the SDGs related to the agro-food sustainability (namely 2, 6, 12 and 15) in conformity to statistical selection criteria. Next, in section 4, after an overview of the fuzzy set theory and the main works developed in the literature for the construction of multidimensional indices, the new methodological proposal for a fuzzy Super Index is described in detail providing a particular step by step procedure to weight and aggregate different indicators of sustainability through an innovative fuzzy approach. This constitutes the original theoretical contribution of the paper since the new fuzzy approach allows to consider sustainable development and the SDGs in their multiple and interrelated dimensions simultaneously. Finally, section 5 presents the empirical contribution of the paper. The results of the proposed methodology, applied to the 17 Mediterranean countries involved in the PRIMA programme using a set of selected indicators for the SDGs, are provided to assess the agro-food sustainability in the Mediterranean area. Section 6 concludes the paper providing some recommendations for further research.
2. State of the art and data sources analysis
2.1. State of the art
The modern concept of sustainable development finds its roots in the famous definition introduced in 1987 by the UN World Commission on Environment and Development (WCED) in the report Our Common Future, also known as the Brundtland Report. It is defined as follows: “Sustainable development is development that meets the needs of the present without compromising the ability of future generations to meet their own needs. It contains within it two key concepts:
- The concept of 'needs', in particular, the essential needs of the world's poor, to which overriding priority should be given; and
- The idea of limitations imposed by the state of technology and social organization on the environment's ability to meet present and future needs” (UN, 1987).
This concept of sustainable development requires hence an integrated approach combining economic growth with social equity and environmental protection to ensure the well-being of the current and future generations. The relevance of both inter-generational (within each generation) and intra-generational (between generations) equity1, i.e. equal access to resources and opportunities, is thus highlighted in the report. According to the report itself, “what is needed now is a new era of economic growth - growth that is forceful and at the same time socially and environmentally sustainable” (ibid).
1 In the context of inter-generational equity, see for example, among others, Solow (1974) and Hartwick (1977)
(weak sustainability), Noël & O’Connor (1998) and Ekins et al. (2003) (strong sustainability), while for intra-generational equity Arrow et al. (2004).
4
Indeed, on the one hand, the considerable economic growth experienced after the industrial revolution in the late 18th century and its recovery after the end of the World Wars along with the advent of globalization have generated significant improvements in income and living standards, reducing extreme poverty and facilitating the access to basic needs, health and education worldwide. Furthermore, the spread of information and communications technology (ICT) and the development of scientific and technological innovations has led to increased opportunities, faster cross-border communication as well as easier human and capital flows among countries. However, on the other hand, the benefits of economic growth have sometimes been achieved without taking into account the long-term consequences of these changes on the natural environment and human society. Our generation is indeed the first to suffer the negative effects of an overexploitation of non-renewable resources such as climate change, pollution and environmental degradation. Moreover, a large part of the population is still living in poverty and there are rising inequalities and social tensions within and between countries causing conflicts, terrorism and migrations.
Since the late 1960s, a number of important events as the first view of our planet from the moon and several publications have contributed to raising awareness about the negative effects of an unsustainable economic growth (Carson, 1962; Hardin, 1968; Ehrlich, 1968 and Meadows et al., 1972). In 1972, the UN held the first global conference on environmental issues (known as the Stockholm conference) to promote international cooperation around this topic. The oil crisis in 1973 and the Chernobyl disaster in 1986 further called for a rethinking of the current production and consumption patterns.
As mentioned before, the concept of sustainable development intended as composed of multiple dimensions – economic, social and environmental - (“broad sustainability”) was first advocated in the Brundtland Report in 1987 overcoming the concept of “narrow sustainability” which considered only the relationship between the economic and environmental dimensions of sustainability. This broader concept of sustainable development obtained formal recognition in the international arena at the Rio Earth Summit in 1992. It was a milestone event bringing together Heads of State from all over the world, after the Cold War, to define shared strategies to pursue sustainable development in its multiple dimensions. An important result of the summit was the Convention on Climate Change, which then led to the Kyoto Protocol in 1997 and the Paris Agreement in 2016.
Sustainable development is hence today conceived as a multidimensional concept where all economic, social and environmental dimensions are interrelated. This conceptualization breaks the previous rigid boundaries existing between these different areas in favour of a cross-sectoral view of development. The importance to consider the multidimensional nature of the quality of life along with the need to adopt new measures of well-being in addition to GDP and economic variables emerged during the 1970s and the 1980s. Indeed, since the 1940s, GDP had been the most widely used measure of economic growth and development. However, the limitations of GDP as a measure of human welfare have been generally recognized by a number of economists such as Kuznets (1934), Sen (1993), Layard (2006) and Stiglitz et al. (2009) shifting the focus of development thinking from per capita economic growth only to a more comprehensive view of well-being. Also Kennedy in his famous speech in 1968 noted that GDP “measures everything in short, except that which makes life worthwhile” since it is mainly a measure of market production and does not account, inter alia, for non-market activities, wealth distribution
5
as well as social and environmental externalities, i.e. inequality and pollution. The Sen’s capability approach (1989) defines human well-being as “a combination of functionings - the various things a person may value doing or being that are feasible for them to achieve”. It is thus conceived not merely in terms of resources or utility, but rather as the various functions a person may wish to perform and its capabilities to achieve these, which may include a wide array of factors, i.e. social, besides the economic ones. This approach has encouraged throughout the years the development of a multidimensional view of well-being in contrast to the one-dimensional focus on monetary measures. Indeed, Sen’s ideas have paved the way for the concept of human development introduced in 1990 by UNDP and the Human Development Index (HDI), which comprises other indicators of well-being (life expectancy and education) besides per capita income. Moreover, Sen’s work had largely influenced the process that led to the adoption of the UN Millennium Development Goals (MDGs) at the dawn of the century in 2000. The MDGs were eight global goals committing the international community to face the serious issues related to poverty, education, health, gender and the environment thus going beyond the narrow idea of development represented by economic growth only. The goals on poverty reduction were reached five years ahead of the deadline. The MDGs laid the foundations for the Sustainable Development Goals (SDGs) adopted by the UN in 2015. In 2002, the World Summit in Johannesburg resulted in a plan of implementation including concrete actions for sustainable development emphasizing the “collective responsibility to advance and strengthen the interdependent and mutually reinforcing pillars of sustainable development - economic development, social development and environmental protection - at the local, national, regional and global levels” (UN, 2002).
At the Rio +20 Summit in 2012, the UN member states agreed to initiate an intergovernmental process for the definition of a new set of global goals, called SDGs, to be effective after the expiration of the MDGs, contributing to the “full implementation of the outcomes of all major summits in the economic, social and environmental fields” (UN, 2012). This process culminated in the adoption, in September 2015, of the 2030 Agenda for Sustainable Development including 17 SDGs to guide the world on a path towards sustainable development by 2030. The SDGs are universal, integrated and indivisible and balance the multiple dimensions of sustainability. They provide a roadmap to help the world to end poverty, hunger and promote sustainable agriculture, ensure healthy lives, quality education, gender equality, sustainable consumption and production patterns, protect the environment, tackle climate change and promote peaceful societies. Associated to these global goals there are 169 targets and more than 200 official indicators have been identified by the UN to monitor the progress towards such goals. The Agenda 2030 highlighted the importance to implement the goals at global, regional and national levels and to develop a follow-up and review framework at all levels “to ensure that no one is left behind” (UN, 2015).
Indeed, in order to support the implementation of the SDGs and their localization, several Sustainable Development Solutions Networks (SDSNs) have been created to promote cooperation between universities, civil society and the private sector to advance practical solutions and the elaboration of indicators for the SDGs at regional and national level.
SDSN Mediterranean is the regional network of SDSN in the Mediterranean area and its activities are coordinated by the University of Siena. It plays a key role since the challenges to sustainable development are particularly critical in the Mediterranean region, which is an area
6
of the world with unique characteristics, such as the Mediterranean climate and diet, the exceptional ecosystems and biological diversity as well as a long-lasting history and cultural heritage. Notwithstanding these common features, significant socio-economic differences exist nowadays between the Northern Mediterranean Countries (NMCs) and the Southern and Eastern Mediterranean Countries (SEMC). Most of the NMCs are EU member states with an average income per capita much higher than the SEMCs (with the exception of Israel). Population growth is stagnant in the North while it is increasing fast in the South East. Moreover, weak national institutions and lack of effective governance especially in the SEMCs are generating political instability and migration. Today, the sustainability of the agro-food system in the Mediterranean area is seriously threatened by environmental, economic and social challenges: climate change, population growth, urbanization, unsustainable agricultural practices, environmental degradation, water scarcity, food insecurity, loss of biodiversity, low profitability of smallholders and lack of adequate infrastructures and innovation along the agro-food value chain.
In this context, important is the Partnership for Research and Innovation in the Mediterranean area (PRIMA), a joint research and innovation programme among the Euro-Mediterranean countries, managed by the University of Siena, aimed at promoting the sustainable management of the agro-food systems and water resources in the region contributing to the implementation of the SDGs.
The partnership is a ten-year initiative (2018 – 2028) to face the evolving challenges affecting the agro-food sustainability in the region. It is set in the context of the several policies adopted to strengthen the Euro-Mediterranean cooperation in order to promote prosperity and stability in the region, i.e. the Euro-Mediterranean partnership, also known as the Barcelona process, started in 1995, the European Neighbourhood policy in 2003 and the Union for the Mediterranean in 2011.
In line with the PRIMA initiative, we have indeed proposed a methodology for the construction of a Super Index to assess the agro-food sustainability in the 17 countries bordering the Mediterranean Sea participating in this programme, namely, among the NMCs, Portugal, Spain, France, Italy, Malta, Slovenia, Croatia, Greece, Cyprus, and among the SEMCs, Turkey, Lebanon, Israel, Jordan, Egypt, Tunisia, Algeria, Morocco.
2.2. Datasets for SDG indicators
In order to select suitable and statistically sound indicators for inclusion in the Super Index, we have first analysed the statistical quality of the main datasets available for the SDGs indicators examining both the primary and secondary sources.
For this purpose, we have used six criteria identified on the basis of internationally recognized criteria for data quality selection. These are the following:
1. Completeness (in terms of indicators): The indicators provided by a compiling agency
have to cover most of the SDGs.
2. Availability for all or most MED Countries (Coverage): Data are available for most of
the 17 Mediterranean countries considered in this analysis.
3. Clarity: Data are available in a clear and understandable way.
4. Timeliness: Data have to be disseminated by a compiling agency in a prompt manner and
7
5. Comparability over time (ability to monitor): Data of the same phenomenon are
available and comparable at different points in time.
6. Comparability among indicators (internal): Data have to be compiled in a statistically
reliable and valid manner using common standards, definitions, classifications and units in the different sources and countries.
According to this criteria, among the primary sources, we have evaluated the databases of the main agencies responsible for compiling the UN official SDG indicators, namely UN organizations, and Eurostat, which is the principal institution providing indicators for the SDGs in an EU context. Concerning the secondary sources, we have investigated the compliance with the aforementioned criteria of the datasets used by SDSN (the UN Sustainable Development Solutions Network) in the SDG Index (Sachs et al., 2017) as well as those of CIHEAM (international Centre for Advanced Mediterranean Agronomic Studies) and BCFN Foundation (Barilla Centre for Food and Nutrition Foundation) which are focused on the Mediterranean agro-food system.
2.2.1. Primary sources
In order to monitor the progress towards the SDGs, in 2017 the UN adopted a global indicator framework including 232 official indicators for the 17 SDGs. For each indicator, specific international institutions have been identified as “custodian” agencies responsible to collect data from national sources and to compile internationally comparable estimates. These are then provided to the United Nations Statistics Division (UNSD), the UN Statistical Office, to be included in the Global SDG Indicators Database.
The main UN organizations committed to this task are: FAO, WB, WHO, UNESCO, ILO, UNICEF, UNEP, WTO and IMF. In addition, OECD is responsible for a number of UN official SDG indicators.
The Food and Agriculture Organization (FAO) plays a leading role in providing food and agriculture statistics at global level through a series of databases of which FAOSTAT is the world’s most comprehensive on these topics. It is custodian agency for 21 SDG global indicators (around 10% of the total) covering overall 6 SDGs. Most of these indicators (9) cover SDG #2, dedicated to food security and sustainable agriculture, since this goal is at the hearth of FAO’s efforts.
The World Bank (WB), whose aim is to reduce poverty worldwide, provides data on global development in its World Development Indicators (WDI) database. It is responsible for 22 UN official indicators related to 10 SDGs.
The World Health Organization (WHO) is the custodian agency for the highest number of SDG indicators (31) covering 7 SDGs with a focus on SDG #3 concerning health promotion which is central to its mission. The Global Health Observatory (GHO) is the main WHO database of health related statistics.
The International Labour Organization (ILO) committed to promote decent work and employment opportunities around the world is custodian agency for 5 SDGs with 15 indicators, of which 9 for SDG #8 as such goal is precisely related to its aim. ILOSTAT is the world’s largest database on labour market statistics.
The UN Educational, Scientific and Cultural Organization (UNESCO) is the global leader of data for education which are disseminated through the UNESCO Institute for Statistics (UIS)
8
databases. It is responsible for 22 indicators across 10 SDGs and significant is indeed its contribution for SDG #4, aimed to ensure quality education, providing 9 of the total 11 indicators for this goal.
The United Nations Children's Fund (UNICEF) aims to protect the rights of children through humanitarian and development assistance and is the leading global provider of data for children with 17 indicators across 7 SDGs.
The United Nations Environment Programme (UNEP) is the UN authority dedicated to the environmental issues and it is custodian agency for a significant number of indicators (29) across 6 SDGs. Among these indicators, 11 out of the total 13 cover SDG #12 promoting sustainable consumption and production patterns. The UNEP Environmental Data Explorer contains datasets on a wide range of environmental statistics.
The World Trade Organization (WTO) and the International Monetary Fund (IMF) are responsible for a lower number of indicators, respectively 8 for 5 SDGs and 4 across 3 SDGs. The WTO Statistics Database provides data on international trade and, among the IMF databases, the World Economic Outlook (WEO) contains global macroeconomics data.
Also the Organization for Economic Cooperation and Development (OECD) is responsible for 20 SDG global indicators covering overall 13 SDGs. It provides a large number of databases related to its field of action concerning mainly its 35 member countries, of which only 7 are Mediterranean countries (Greece, Italy, Israel, Portugal, Slovenia, Spain and Turkey).
All these primary sources provide generally statistically sound data for the SDG global indicators, which are timely, available in a clear way, for different time periods and compiled through internationally comparable standards. They cover all or most of the Mediterranean countries in our analysis except for OECD.
Besides the UN, also the EU adopted in 2017 a set of indicators to monitor the implementation of the SDGs in an EU context, including 100 indicators equally distributed across all the 17 SDGs. Eurostat, the EU statistical office, provides most of these indicators (69) for almost all the SDGs. However, its databases cover EU member countries only, thus 9 of the 17 Mediterranean countries considered in our analysis, namely Croatia, Cyprus, France, Greece, Italy, Malta, Portugal, Slovenia and Spain. The data for the SDGs indicators are clear and internally comparable, even if not all are updated annually or are available for a long period of time.
The overall evaluation of the primary data sources for the SDG indicators according to the six criteria identified is shown in the table below through a traffic light rating system indicating the level of suitability of the datasets (green: high; green/yellow: high/medium; yellow: medium; red/yellow: low; red: low).
Table 2.1: overall primary sources evaluation
Source: own elaboration
FAO WB WHO ILO UNESCO UNICEF UNEP WTO IMF OECD Eurostat 1. Completeness
2. Geographical coverage 3. Clarity
4. Timeliness
5. Comparability over time 6. Internal comparability
9
In conclusion, the primary data sources for the SDG indicators that satisfy all or most of the six criteria are FAO, WB, WHO, ILO, UNESCO, UNICEF, UNEP, WTO and IMF, while OECD and Eurostat datasets do not cover most of the 17 Mediterranean countries.
2.2.2. Secondary sources
The UN Sustainable Development Solutions Network (SDSN) in 2016 issued the SDG Index and Dashboards which was then revised in 2017 (Sachs et al., 2016, 2017). It is a composite index that aggregates available data on the SDGs to measure the countries’ performance on the Agenda 2030. It builds on 99 unofficial indicators to monitor all the 17 SDGs using data available for all the Mediterranean countries. The data used in the index derive mainly from official sources but also from other unofficial reputable sources. These are clear, but not all data are updated annually at the same time across countries and only the most recent available data are included in the index.
The Barilla Center for Food and Nutrition Foundation (BCFN) is a private non-profit institution devoted to foster more sustainable agro-food systems in order to face the global challenges related to food and nutrition. It has developed, in collaboration with the Economist Intelligence Unit (EIU), the Food Sustainability Index (FSI) to assess the sustainability of the countries’ agro-food systems. Its activities are hence consistent with the implementation of mainly 6 SDGs related to this topic (SDGs # 2, 3, 10, 12, 13 and 15). In the 2017 edition of the FSI, 34 countries are included in the study, of which 12 are Mediterranean countries (France, Greece, Italy, Portugal, Spain, Egypt, Israel, Jordan, Lebanon, Morocco, Tunisia and Turkey). The data used for the construction of the FSI derive mainly from the UN institutions (primarily FAO) and EIU databases which are available in a clear manner and are compiled in a reliable way. However, not all the indicators selected to build the index are available in the most recent years and most of these are provided only for a single year.
The International Centre for Advanced Mediterranean Agronomic Studies (CIHEAM) is a Mediterranean intergovernmental organization aimed to promote the sustainability of the agro-food system in the Mediterranean countries. Its 2015 version of the Statistical Review includes several indicators on agriculture, food and development in the Euro-Mediterranean area deriving from different sources such as the UN organizations and Eurostat. These statistics concern the 13 CIHEAM member states (Albania, Algeria, Egypt, France, Greece, Italy, Lebanon, Malta, Morocco, Portugal, Spain, Tunisia and Turkey) and 6 other Mediterranean countries (Bosnia and Herzegovina, Croatia, Jordan, Libya, Montenegro and Syria). Therefore, CIHEAM provides indicators for most of the Mediterranean countries in our analysis (14) covering mainly 5 SDGs regarding the agro-food sustainability (SDGs # 2, 6, 12, 14 and 15). The data are collected over several decades, from the 1960’s to the most recent years, even if these are not always available for all countries. Moreover, the estimates are not updated annually, i.e. the previous edition of the 2015 version of the Statistical Review was published in 2012, and more information on the criteria used for data selection could be provided.
Table 2.2 reports the evaluation of the secondary data sources for the SDG indicators in conformity to the criteria identified for the analysis of the statistical quality of the datasets.
10 Table 2.2: overall secondary sources evaluation
SDSN BCFN CIHEAM 1. Completeness
2. Geographical coverage 3. Clarity
4. Timeliness
5. Comparability over time 6. Internal comparability
Secondary sources
Source: own elaboration
In summary, all the secondary data sources analyzed may be considered suitable for our study even if they do not fully meet all the six criteria and SDSN as well as BCFN Foundation databases do not generally provide time series data.
3. Indicators selection
After the datasets analysis, we have then identified and evaluated the indicators that may be appropriate to gauge the sustainability of the agro-food systems in the Mediterranean region according to specific statistical criteria. Among the 17 SDGs, we have thus focused on four specific goals related to the agro-food sustainability, namely SDGs #2 (“End hunger, achieve food security and improved nutrition and promote sustainable agriculture”), #6 (“Ensure availability and sustainable management of water and sanitation for all”), #12 (“Ensure sustainable consumption and production patterns”) and #15 (“Sustainable land use, forest and other terrestrial ecosystems”).
The criteria adopted for the selection of suitable indicators to be included in the Super Index are internationally recognized criteria proposed by the University of Siena. These criteria are arranged in a hierarchical order and are the following:
1. Policy relevance
- Ability to measure the direct impact of PRIMA Programme
Indicators have to be relevant and clearly linked to the PRIMA programme. 2. Admissibility Requirements
- Availability for all or most MED Countries (Coverage)
They cover most of the 17 Mediterranean countries considered in this analysis. - Statistical process adequacy
Indicators have to be produced in a statistically reliable and robust way according to internationally established methodologies and standards.
- Compliance: Type of sources (Official, internal, censuses, surveys, etc.)
They comply with international common standards in the different type of sources (official, internal, censuses, surveys, etc.).
3. Data Quality - Timeliness
Data are disseminated promptly and are available for the most recent years. - Comparability over time (ability to monitor)
11 - Comparability among indicators (internal)
Indicators are processed using common standards, definitions and classifications in different countries.
Following these criteria, for each of the four goals considered, we have analysed first the indicators provided on the UNSD Global SDG Indicators Database (primary source), which contains data on the countries’ performance in terms of the official indicators provided by the custodian agencies mentioned before, and then those used by SDSN in the SDG index (secondary source). Indeed, since not for all the UN indicators internationally established methodologies or standards yet exist nor data are widely available, SDSN has selected alternative unofficial indicators from other reputable sources to complement the official indicators when gaps remained. The official indicators are in fact classified into three tiers in descending order of methodological development and data availability (tier I, II and III). Table 3.1 reports the number of indicators for SDGs 2, 6, 12 and 15 along with their tier classification. All these goals include tier III indicators with SDG 12 showing a particularly high number of these. For this type of indicators, methodology and standards are not yet developed and thus are normally not available on the UN official database. SDG 15 presents the largest number of indicators classified as tier II while SDGs 2 and 6 the highest number of tier I indicators, for which agreed methodologies exist and data are easily available.
Finally, the most suitable indicators identified by the PRIMA programme to measure the agro-food sustainability in the Mediterranean region in relation to the aforementioned goals are described in detail in section 3.5. We have hence used these indicators to build the Super Index.
Table 3.1: Official indicators for SDG 2, 6, 12 and 15 and tier classification Tier I Tier II Tier III Tier I/III Tot
SDG 2 6 4 3 - 13
SDG 6 4 4 3 - 11
SDG 12 1 1 11 - 13
SDG 15 2 7 3 2 14
Tot 13 16 20 2 51
Source: own elaboration
3.1. SDG 2: Food security and sustainable agriculture
All the 13 official UN indicators for SDG 2 are relevant and clearly linked to the PRIMA programme. However, some of these indicators are not available on the UNSD Global SDG Indicators Database and only 4 cover most of the 17 Mediterranean countries. We have thus analyzed these 4 indicators, namely 2.1.1 “Prevalence of undernourishment” (FAO, 2017a), 2.5.1 “Conservation of genetic resources for food and agriculture” (FAO, 2017b), 2.5.2 “Risk status of livestock breeds” (FAO, 2017c), and 2.a.1 “Public Investment in agriculture” (FAO, 2017d). All these indicators derive hence from the same official source.
The 6 indicators used by SDSN for SDG 2 in the SDG Index are policy relevant and available for all the Mediterranean countries in our study. Among these, we do not consider the indicator “Prevalence of undernourishment (%)” since it is similar to the one in the official database. The indicators analysed are thus the following: “Prevalence of stunting, under-5s (%)” (UNICEF et al., 2017), “Prevalence of wasting, under-5s (%)” (UNICEF et al., 2017), “Prevalence of adult
12
obesity” (WHO, 2017a), “Cereal yield (t/ha)” (FAO, 2017e) and “Sustainable Nitrogen Management Index” (Zhang & Davidson, 2016). These indicators are provided by official sources excluding the last one which is described in a research paper.
Table 3.2 shows the overall evaluation of the UN official indicators and those used by SDSN according to the criteria for indicators selection described before. The level of suitability is indicated through a traffic light rating system (green: high; green/yellow: high/medium; yellow: medium; red/yellow: low; red: low).
Among the UN indicators, the 2.1.1 covers almost all the selection criteria. It is indeed classified as tier I and it is an estimate of the proportion of population undernourished which is today below 5% in all the 17 countries in this study. The other UN indicators are classified as tier II and include different components/sub-indicators. Even if they rely on established methodologies and standards, data for these indicators are not regularly produced by all the 17 countries at the same time for all the components/sub-indicators and the most recent data are not widely available on the official database. The internal comparability depends on the quality of the country data compiled by the official source.
Concerning the SDSN indicators, “Prevalence of stunting, under-5s (%)” and “Prevalence of wasting, under-5s (%)” are perfectly matched to the official indicators 2.2.1 and 2.2.2 which are not available for most of the 17 Mediterranean countries on the UN global SDG indicators database. For these, an established methodology exists but data are not provided for the most recent years in all countries at the same points in time. Also the indicator “Prevalence of adult obesity” is closely aligned to the official indicator 2.2.2 while “Cereal yield” and “Sustainable Nitrogen Management Index” are not in the UN official database. The first two indicators satisfy almost all the criteria excluding timeliness but the last one shows some limits since its methodology is provided in a research paper and it is available only for a few not recent years.
Table 3.2: SDG 2 UN and SDSN indicators evaluation
Source: own elaboration
In conclusion, the potential indicators that may be suitable to monitor SDG 2 in the
Mediterranean region are indicators 2.1.1, 2.5.2, “Prevalence of adult obesity” and “Cereal yield” since they meet most of the selection criteria.
2.1.1 2.5.1 2.5.2 2.a.1 Prev. of stunting, under-5s Prev. of wasting, under-5s Prev. of adult obesity Cereal yield Sust. Nitrogen Management Index 1. Policy Relevance 2. Admissibility Requirements Geographical coverage Statistical process adequacy Compliance
3. Data Quality
Timeliness
Comparability over time Internal comparability
UN indicators SDSN indicators
13 3.2. SDG 6: Clean water and sanitation
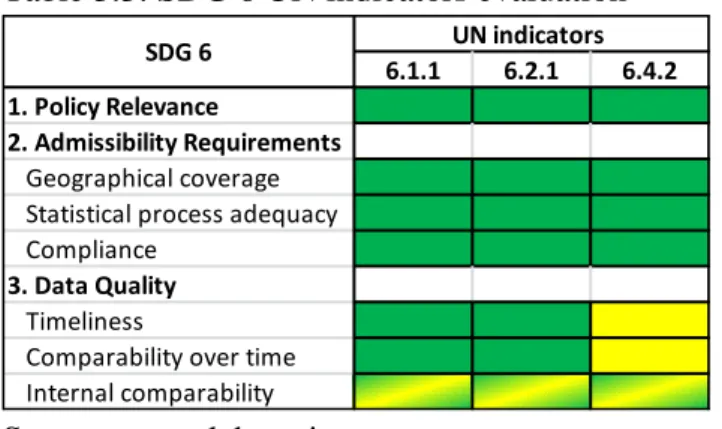
The 11 UN official indicators for SDG 6 are all policy relevant, but only 6 of these are available on the UNSD database. Among the remaining indicators, 3 cover most of the Mediterranean countries in the study, namely indicators 6.1.1 “Proportion of population using safely managed drinking water services” (WHO & UNICEF, 2017), 6.2.1 “Proportion of population using safely managed sanitation services” (WHO & UNICEF, 2017) and 6.4.2 “Level of water stress: freshwater withdrawal as a proportion of available freshwater resources” FAO (2017f). All these indicators derive thus from official sources. In this case, among the 4 indicators used by SDSN for this goal we do not consider the one measuring a spillover effect, that is the effect occurring when one country’s action generates externality on another country, since it is not relevant to the PRIMA programme. We also do not evaluate the other indicators “Access to improved water”, “Access to improved sanitation” and “Freshwater withdrawal” because these are perfectly matched to the official indicators 6.1.1, 6.2.1 and 6.4.2.
As shown in table 3.3, the indicators 6.1.1 and 6.2.1, which are classified as tier I, almost completely satisfy all the selection criteria, while for the tier II indicator 6.4.2 there is an agreed methodology but the most recent data are not easily available in all countries as well as time series data. In summary, all these indicators may be considered appropriate to monitor the progress towards SDG 6 in the 17 Mediterranean countries.
Table 3.3: SDG 6 UN indicators evaluation
Source: own elaboration
3.3. SDG 12: Sustainable consumption and production patterns
Of the 13 UN indicators for SDG 12, only 3 are available on the official database. Indeed, almost all the indicators for this goal are classified as tier III and do not have yet established methodologies. Among these 3 indicators, the tier I indicator 12.4.1 is not policy relevant while the remaining indicators 12.2.1 “Material footprint, material footprint per capita, and material footprint per GDP” (UNEP, 2017a) and 12.2.2 “Domestic material consumption, domestic material consumption per capita, and domestic material consumption per GDP” (UNEP, 2017a) are relevant to the PRIMA programme and are available for all the 17 Mediterranean countries. Both derive from the same official source.
Among the 8 indicators selected by SDSN for this goal, we do not analyze the two indicators measuring spillover effects neither the one covering OECD countries only. All the other 5 indicators are policy relevant and cover most of the 17 countries. These derive from research papers and are the following: “E-waste (Kg/capita)” (UNU-IAS, 2015); “Wastewater treated
6.1.1 6.2.1 6.4.2 1. Policy Relevance
2. Admissibility Requirements Geographical coverage Statistical process adequacy Compliance
3. Data Quality Timeliness
Comparability over time Internal comparability
14
(%)” (Hsu et al., 2016); “Production-based SO2 emissions (Kg/capita)” (Zhang et al., 2017); “Nitrogen production footprint (Kg/capita)” Oita et al. (2016) and “Municipal solid waste” (WB, 2012). “Wastewater treated” and “Municipal solid waste” are similar to the official indicators, respectively 12.4.2 and 12.5.1, which are not available on the UN official database. The other indicators “E-waste”, “Production-based SO2 emissions” and “Nitrogen production footprint” are not related to any of the official SDG indicators. As reported in table 3.4, among the UN indicators, the 12.2.1 (tier III) and 12.2.2 (tier II) do not meet most of the criteria since they are produced compiling data from different international or national sources which are not easily available in all countries, for the most recent years and are not comparable over time. The SDSN indicators are provided in research papers only at a point in time and generally not for the most recent years. They are indeed produced through methodologies which are not easily applied in all countries according to common definitions.
Therefore, the UN and SDSN indicators for SDG 12 do not seem the most appropriate indicators for this study.
Table 3.4: SDG 12 UN and SDSN indicators evaluation
Source: own elaboration
3.4. SDG 15: Sustainable management of terrestrial ecosystems
Among the 14 UN official indicators for SDG 15, all are policy relevant with the exception of indicators 15.6.1, 15.a.1 and 15.b.1 and 5 are not available on the UNSD database (15.3.1, 15.7.1, 15.8.1, 15.9.1 and 15.c.1). The remaining 6 indicators cover most of the Mediterranean countries in our analysis. These are the following: 15.1.1 “Forest area as a proportion of total land area” (FAO, 2017g), 15.1.2 “Proportion of important sites for terrestrial and freshwater biodiversity that are covered by protected areas, by ecosystem type” (BirdLife International et al., 2017), 15.2.1 “Progress towards sustainable forest management” (FAO, 2017h), 15.4.1 “Coverage by protected areas of important sites for mountain biodiversity” (BirdLife International et al., 2017), 15.4.2 “Mountain Green Cover Index” (FAO, 2017i) and 15.5.1 “Red List Index” (Birdlife international & IUCN , 2017). We do not consider the 5 SDSN indicators for this goal because one of these measures a spillover effects and the other 4 are the same or are closely aligned to the official indicators 15.1.1, 15.1.2 and 15.5.1.
Table 3.5 shows that the UN indicators for SDG 15 satisfy a high number of selection criteria. For all the indicators, there is indeed an internationally agreed methodology. The 15.1.1 and 15.1.2, classified as tier I, may be suitable for our study, even if the first one is not provided
12.2.1 12.2.2 E-waste generated Wastewater treated Production-based SO2 emissions Nitrogen production footprint Municipal solid waste 1. Policy Relevance 2. Admissibility Requirements Geographical coverage Statistical process adequacy Compliance
3. Data Quality
Timeliness
Comparability over time Internal comparability
UN indicators SDSN indicators
15
every year, but at intervals of years. Concerning the other indicators (tier II), although there is uncertainty around the quality of the data for some countries, the indicators 15.4.1 and 15.5.1 meet almost all the criteria, while the 15.2.1, which comprises a number of sub-indicators, as well as the 15.4.2 are not easily available in the most recent years and at different points in time. Therefore, overall, the most appropriate indicators seem to be 15.1.1, 15.1.2, 15.4.1 and 15.5.1.
Table 3.5: SDG 15 UN indicators evaluation
Source: own elaboration
3.5. PRIMA indicators
The PRIMA programme in order to measure the performance of the Mediterranean countries in terms of agro-food sustainability has identified a set of Key Performance Indicators (KPIs) (Saladini et al., 2018) contributing to the implementation of the SDGs, namely SDGs 2, 6, 12 and 15, in the region. We have hence used these indicators for the construction of the Super Index adjusting some of these to provide a more accurate measure of the phenomena concerned (table 3.6). The selected indicators are described in detail below.
Table 3.6: PRIMA selected indicators
# Indicator Unit Year Source
1 Population overweight % 2016 WHO (2017b)
2 Land use % 2015 FAO (2017l)
3 GHG emissions (total)
per sq. Km t CO2e /sq.Km 2014
UNFCCC (2017), FAO (2017m)
4 Cereal yield kg/ha 2014 FAO (2017e)
5 Agriculture value added US$/worker 2016 WB (2017)
6 Fertilizer consumption kg/haarable land 2014 FAO (2017n)
7 Crop water productivity kg/m3 2010 Zwart (2010)
8 Annual freshwater withdrawal
for agriculture
(% of total freshwater withdrawal)
2014 FAO (2017o)
9 Population using safely managed
water services (rural) % 2015
WHO, UNICEF (2017a)
10 Population using safely managed
sanitation services (rural) % 2015
WHO, UNICEF (2017a)
11 Research and Development
expenditure % of GDP 2015 UNESCO (2017a)
Source: own elaboration from Saladini et al. (2018)
15.1.1 15.1.2 15.2.1 15.4.1 15.4.2 15.5.1 1. Policy Relevance
2. Admissibility Requirements Geographical coverage Statistical process adequacy Compliance
3. Data Quality Timeliness
Comparability over time Internal comparability
16
1. Population overweight (%)
The indicator is defined as the percentage of adult population with a body mass index (BMI) of 25 kg/m2 or higher. It is similar to the indicator used by SDSN for SDG 2 in the SDG Index “Prevalence of adult obesity (%)”. The proportion of adult population overweight may indeed be a useful indicator to describe the nutritional situation in the Mediterranean area characterized by growing overweight and obesity rates in the population along with the demise of the traditional Mediterranean diet.
2. Land use (%)
This indicator provides an estimate of the proportion of land for Agriculture, Forestry, and Other Land Use (AFOLU). We have calculated such indicator as the sum of “Forest area (% of land area)” and “Agricultural land (% of land area)”. The difference between the total land area (%) and this sum represents the proportion of land devoted to other use. “Forest area” and “agricultural land” are precisely defined by FAO (2017l). It allows to compare the proportion of forest and agricultural land to that for other use, i.e. the land covered by urban areas, and thus to assess the status of the conservation of land for forestry and agriculture.
3. GHG emissions (total) per sq. Km
This indicator measures the total net greenhouse gas (GHG) emissions expressed in tons of CO2
equivalent (tCO2e) in line with the United Nations Framework Convention on Climate Change (UNFCCC). For a more accurate estimate, we have divided the total GHG emissions (tCO2e) by the surface area of a country (sq. Km) to measure the total net greenhouse gas emissions (tCO2e) per square kilometer limiting the possible distortions caused by different surface area sizes in the countries considered in our analysis. Emissions of CO2e derive mainly from fossil fuel combustion, such as oil, coal and natural gas as well as from industrial processes causing air pollution which may seriously damage human health, the environment and increase earth’s surface temperature.
4. Cereal yield (kg/ha)
It is an indicator of agriculture productivity and it is the same as the indicator used by SDSN in the SDG Index for SDG 2. It is measured as kilograms per hectare of harvested land. Increases in crop yields contribute to agriculture efficiency, however, new crop production systems may cause negative environmental impacts, such as pollution from fertilizers consumption, soil degradation and biodiversity loss. Therefore, this indicator should be better used in combination with indicators #6 (fertilizer consumption), #7 and #8 in terms of water availability and efficiency as well as indicator # 2 concerning the changes in AFOLU.
5. Agriculture value added (US$/worker)
The value added in agriculture is an important indicator of agricultural productivity. “Value added in agriculture measures the output of the agricultural sector (ISIC divisions 1-5) less the value of intermediate inputs. Agriculture comprises value added from forestry, hunting and fishing, as well as cultivation of crops and livestock production” (WB, 2017). It is calculated in constant 2010 U.S. dollars.
6. Fertilizer consumption (kg/ha arable)
Fertilizer consumption measures the quantity of fertilizers used (Kg) per unit of arable land (ha). It is a relevant indicator because the use of fertilizers is unsustainable and harmful for health and the environment. “Fertilizer products cover nitrogenous, potash, and phosphate
17
fertilizers (including ground rock phosphate). Arable land includes land defined by the FAO as land under temporary crops (double-cropped areas are counted once), temporary meadows for mowing or for pasture, land under market or kitchen gardens, and land temporarily fallow” (FAO, 2017n).
7. Crop water productivity (kg/m3)
Crop water productivity is defined by Zwart (2010) as the marketable crop yield (kg ha-1) over the seasonal crop water consumption by actual evapotranspiration (m3 ha-1). This indicator provides a measure of water productivity in agriculture and may be better interpreted in conjunction with the indicator #8 (freshwater withdrawal for agriculture) as its meaning changes according to the availability of water resources, i.e a higher water productivity may be caused by the use of less water resources and the same production level or an increase in production with the same resources. It is a useful indicator since the increasing pressure on water resources negatively affects the agricultural sector, which is the major water-consuming sector in most of the Mediterranean countries and has to face the competition for a higher water demand from the other sectors. Along with indicators #4 (Cereal yield) and #5 (Agriculture value added), it provides a picture of the agriculture productivity in the Mediterranean region.
8. Annual freshwater withdrawal for agriculture (% of total freshwater withdrawal)
This indicator measures the pressure exerted by the agriculture sector on the renewable water resources of a country and it is similar to the official indicator 6.4.2. The spread of irrigated agriculture, along with population growth and industrialization, are nowadays the main causes for higher water demand. It is an important measure since water scarcity is one of the major issues in the Mediterranean area characterized by the presence of arid and semi-arid ecosystems, drought and infrequent rainfalls and the agriculture sector is the main water-consuming sector in the region.
9. Population using safely managed water services (rural, %) and 10. Population using safely managed sanitation services (rural, %)
These indicators are similar respectively to the official indicators 6.1.1 and 6.2.1. However, the indicators identified by the PRIMA programme measure only the percentage of rural population using safely managed water and sanitation services and not the urban one. Indeed, the rural population has normally less access to water and sanitation facilities in the Mediterranean area. “Safely managed drinking water” is defined as “the use of an improved drinking water source which is located on premises, available when needed, and free of faecal and priority chemical contamination” while “safety managed sanitation” as “the use of an improved sanitation facility which is not shared with other households and where excreta is safely disposed in situ or excreta is transported and treated off-site” (WHO, UNICEF, 2017a).
11. Research and development expenditure (% of GDP)
R&D expenditure is a fundamental indicator of countries efforts for innovation in science and technology. Total R&D expenditures include current and capital expenditures carried out by both public and private sector and are expressed as a percentage of a country GDP. This indicator is essential for the development of innovative solutions along the Mediterranean agro-food value chain.
The proposed methodology for the construction of the Super Index is applied to the 17 Mediterranean countries involved in the PRIMA programme using these 11 indicators.
18
4. Construction of a multidimensional Super Index
In the previous section, after the datasets analysis, we have selected the most suitable indicators to measure the performance of the Mediterranean countries towards the four SDGs related to the agro-food sustainability in line with the PRIMA programme. Then, in order to weight and aggregate these indicators into a Super Index to properly estimate the multidimensional nature of sustainable development and the SDGs, we have proposed a new methodology based on an innovative fuzzy approach. This new methodological proposal is described in detail in this section after an overview of the fuzzy set theory and the main works developed in the literature for the construction of multidimensional indices.
4.1. Literature review
The multidimensional nature of sustainable development and the quality of life in general has been widely recognized, as mentioned in section 22. Indeed, in literature, several
methodological studies on multidimensional indices have been developed in the recent years especially in the field of sustainability (UNDP, 1990; Sachs et al., 2016, 2017), the quality of life (OECD, 2011; Betti et al., 2016; Betti, 2016, 2017) and poverty (Cerioli and Zani, 1990; Cheli and Lemmi, 1995; Anand and Sen, 1997; Betti and Verma, 1999, 2008; UNDP, 1997, 2010; Eurostat, 2002; Belhadj, 2011; Betti et al., 2015, 2017).
Among these works, noteworthy are those based on the fuzzy logic. In fact, the fuzzy set theory has shown to be a powerful tool to describe the multidimensionality and complexity of social phenomena replacing the classical crisp approach which generally tends to overestimate or underestimate social dynamics, i.e. transient and persistent poverty.
The fuzzy set theory, introduced by Zadeh in 1965, emerged in response to the evidence that real situations are often characterized by imprecision, uncertainty and vagueness and cannot be properly described by the classical set theory representing reality in a simple true-false binary logic. Indeed, in the classical crisp approach the sets are characterized by sharp and clearly defined boundaries and thus an item may fully belong or does not belong at all to a set according to a bivalent condition. On the contrary, in the fuzzy set theory, an item may belong to a set with partial degrees of membership between 0 and 1 and not only with the extreme membership values of 0 and 1. A fuzzy set is hence an extension of a classical set. It is a collection of elements with a continuum of grades of membership and it is characterized by a membership function defining to what extent an element belongs to the set, that is the grade of membership for the elements of a given set.
According to Zimmermann (1996), “if X is a collection of objects denoted generically by x, then a fuzzy set A in X is a set of ordered pairs A = {(x, µA(x)|x ∈ X} where µA(x) is called
the membership function or grade of membership/degree of truth of x in A. It maps each element of X to a membership value between 0 and 1”.
As shown in the commonly used example of tall people (fig. 4.1), the crisp approach identifies whether a person is tall or not in binary terms over the interval {0,1}. In this case, tall men are
2 Concerning the multidimensional nature of the quality of life and poverty, see also, among others, Sen (1993,
1999), Atkinson and Bourguignon (1982), Tsui (1985), Maasoumi (1986), Atkinson (2003) and Bourguignon and Chakravarty (2003).
19
those above 180 cm, and not tall men those below 180 cm. The fuzzy approach, instead, describes how tall a person is through a membership function which defines how each height value is mapped to a membership value over the interval [0, 1]. All people belong to the fuzzy set “tall people”, but their degrees of membership depend on their height. Indeed, the concept of tall person cannot often be sharply defined as it may be ambiguous and may depend on each individual’s perception.
Figure 4.1: Crisp vs fuzzy sets
Source: own elaboration from Negnevitsky, 2005
Therefore, fuzzy logic allows to consider truth as a matter of degree in the whole interval [0, 1] rather than a simple {0,1} dichotomy.
The methodological proposal for the construction of a multidimensional index for sustainability assessment is hence based on the fuzzy set theory. In particular, it draws on the fuzzy approach proposed by Betti et al. (2015) to build a multidimensional index of poverty and deprivation. This approach relies on the contributions of Cerioli and Zani (1999), Cheli and Lemmi (1995), Cheli and Betti (1999) and it has been further elaborated in Betti et al. (2005, 2006) and Betti and Verma (2008). It considers poverty and deprivation as a matter of degree overcoming the simple dichotomization of the population into poor and non-poor with respect to a given poverty line. The state of deprivation is described by monetary and also non-monetary aspects of living conditions, defined respectively as Fuzzy Monetary (FM) and Fuzzy Supplementary (FS). The propensity to poverty and deprivation for any individual of rank j, that is the degree of monetary and non-monetary deprivation, is quantitatively specified through the following generalized form of membership function:
𝜇𝑗,𝑘 = (∑ 𝑤𝛾|𝑋𝛾 > 𝑋𝑗 𝑛 𝛾=𝑗+1 ∑𝑛𝛾=2𝑤𝛾|𝑋𝛾 > 𝑋1 ) 𝛼𝑘−1 (∑ 𝑤𝛾𝑋𝛾|𝑋𝛾 > 𝑋𝑗 𝑛 𝛾=𝑗+1 ∑𝑛𝛾=2𝑤𝛾𝑋𝛾|𝑋𝛾 > 𝑋1 ) = (1 − 𝐹𝑗,𝑘) 𝛼𝑘−1 (1 − 𝐿𝑗,𝑘) 𝑗 ∶ 1, … , 𝑛 − 1; 𝜇𝑛,𝐾 = 0
where X is the equivalised income in the monetary deprivation or the overall score s in the non-monetary deprivation; wγ is the sample weight of individual of rank γ and αK (K = 1,2) are two
20
deprivation. Each parameter αK is estimated so that the mean of the corresponding membership
function is equal to the at-risk-of-poverty rate (ARPR) computed on the basis the official poverty line. 𝐹𝑗,𝑘 and 𝐿𝑗,𝑘 are respectively the normalized distribution of income and the value of the Lorenz curve for any individual of rank j. Therefore, (1 − 𝐹𝑗,𝑘) represents the proportion of individuals less poor than a given person (as in Cheli and Lemmi, 1995) while (1 − 𝐿𝑗,𝑘) indicates the share of the total equivalised income received by all individuals less poor than a given person (as in Betti & Verma, 1999). Both the parameters αK have thus an economic
interpretation: the mean of the membership functions is expressible in terms of the generalised Gini measures 𝐺𝛼𝐾, a generalisation of the standard Gini coefficient: 𝛼𝐾+ 𝐺𝛼𝐾
𝛼𝐾(𝛼𝐾+1) = ARPR.
For non monetary deprivation, Betti et al. (2015) provides the following step-by-procedure to combine different supplementary indicators of living conditions into a composite index: 1. Selection of meaningful and useful indicators for the analysis;
2. Trasformation of the indicators into the [0, 1] interval (𝑠𝑗,𝑖 is the standardized j-th indicator for the i-th individual where 𝑗 = 1,2, … , 𝑘 and 𝑖 = 1,2, … , 𝑛).
3. Identification of underlying dimensions through exploratory and confirmatory factor analysis;
4. Calculation of weights within each dimension; 5. Calculation of scores for each dimension;
6. Calculation of an overall score and the parameter α of the m.f.;
7. Construction of fuzzy supplementary indicators in each dimension and overall.
After the indicators selection, their normalization and the identification of the latent dimensions, the indicators are weighted within each dimension to calculate the scores of any individual i for each dimension (step 5) using the methodology of the Second European report on Poverty, Income and Social Exclusion (Eurostat, 2002):
𝑠ℎ𝑖 =
∑ 𝑤ℎ𝑗∙ 𝑠ℎ𝑗,𝑖
∑ 𝑤ℎ𝑗
where 𝑤ℎ𝑗 is the weight of the j-th indicator in the h-th dimension (ℎ = 1,2, . . . , 𝑚).
The weights to be assigned to a given item within each dimension (step 4) are calculated using the “prevalence-correlation” method proposed by Betti and Verma (1999) taking into account both the dispersion of a deprivation indicator (prevalence weights) and its correlation with the other deprivation indicators in a given dimension (correlation weights).
The dispersion of a deprivation indicator (𝑤ℎ𝑗𝑎) is the coefficient of variation of the complement to one of the deprivation scores s. Thus, the weights for the items affecting a large proportion of the population are low and on the opposite, the items with lower dispersion get higher weights since these can be respectively considered less/more critical in describing deprivation. The correlation among indicators within a given dimension (𝑤ℎ𝑗𝑏) is computed in a way through which low weights are given to the indicators more highly correlated with others in the same dimension to limit the effect of redundancy and arbitrariness in assigning weights to the indicators.
The final weights for the indicators are hence calculated as: 𝑤ℎ𝑗 = 𝑤ℎ𝑗𝑎 ∙ 𝑤ℎ𝑗 𝑏 where 𝑗 = 1,2, … , 𝑘ℎ.
21
Then, the overall score, that is the non-monetary indicator FS for any individual i, is calculated (step 6) with the following arithmetic mean:
si = ∑mh=1shi
m
These values are then used in the m.f. to calculate the parameter α2, so that the mean of the FS
values is equal to the conventional at-risk-of-poverty rate (ARPR).
Finally, the estimated parameter α2 is used in the m.f to calculate the FS indicators for each
dimension of deprivation and overall.
This multidimensional methodology has proved to be robust and applicable also to other fields besides poverty (among others, Aassve et al., 2007, 2009; Betti et al., 2011; Belhadj, 2015). In this context, we have introduced a methodological proposal for a new fuzzy approach in the field of sustainability assessment.
4.2. Methodological proposal
This study proposes a new methodology to describe sustainability in its multiple dimensions. In order to properly assess the progress towards the SDGs, we have proposed an innovative fuzzy approach to weight and aggregate a set of indicators for the SDGs into a Super Index in a way that allows to capture their multidimensional and interrelated nature. Such methodological proposal starts from the idea that the indicators for the SDGs may cover not only one specific goal exclusively but more than one goal at the same time. According to the proposed multidimensional methodology, the dimensions identified through an exploratory factor analysis, performed on a set of indicators for the SDGs, are seen in the form of fuzzy sets to which the indicators may simultaneously belong with different degrees. Hence, the new approach enables to consider the membership of an indicator to more than one dimensions as a matter of degree, replacing the conventional crisp membership to only one dimension in a classical binary logic.
Figure 4.2 shows graphically the traditional fuzzy approach (Betti et al., 2015) in contrast to the proposed innovative fuzzy approach at the bottom. In both approaches, the statistical units, in this case the countries, belong to all the dimensions identified with a certain membership function but in the innovative fuzzy approch the indicators belong to all or almost all the dimensions with different degrees and do not belong anymore exclusively to only one dimension as in the crisp logic.
Precisely, in order to build a multidimensional Super Index to measure the agro-food sustainability in the Mediterranean region in line with the PRIMA programme we have proposed a particular step by step procedure drawing on the procedure of Betti et al. (2015) described before. First, the most suitable indicators to measure the Mediterranean agro-food sustainability are selected. Then, after their normalization, the latent dimensions are identified through an exploratory factor analysis (EFA) and finally the indicators are weighted and aggregated to calculate the score of each country over each dimension and the overall index.
22
Figure 4.2: Fuzzy approach – traditional vs innovative methodological proposal
Source: own elaboration
Each step is described in detail below.
1. Selection of indicators to measure the agro-food sustainability in the Mediterranean area. For this purpose, we have used the 11 indicators identified by the PRIMA programme described in paragraph 3.5. Since the values of some indicators were not available for some countries, in order to preserve all cases (countries), we have imputed the missing values, that is we have replaced these with a substituted value estimated using other available information in the dataset. Indeed, missing data in our analysis may create problems to examine the agro-food sustainability in the Mediterranean region introducing bias and affecting the statistical quality of the results. Therefore, we have replaced the missing values for the countries in the north and south Mediterranean areas respectively with the mean of the values of the northern and southern Mediterranean countries. In this way, we could