POLITECNICO DI MILANO
Master course in Urban Planning and Policy Design A.y. 2016/2017
FINAL THESIS
ACCESSING BUENOS AIRES
Proposing a method to ensure activity participation through publictransport policies in the Metropolitan Area of Buenos Aires
authors:
LUCIA VICTORIA BOCCHIMUZZI GIOVANNI LANZA
supervisor:
ACCESSING BUENOS AIRES
Proposing a method to ensure activity participation through public
trans-port policies in the Metropolitan Area of Buenos Aires
Introduction
Research background Research aims and structure Research method
Relevance of the research
Ch 1: Knowing the Metropolitan Area of Bs.As.: Current territorial organization and mobility practices
Several definitions for the same area
A city of corridors: historical growth of the urban fabric A fragmented region: land use patterns
Describing the complexity of the mobility system: Infrastructure, service and management
A region of inequities: analyzing the socio-economic profile of the population Moving around: mobility patterns and accessibility assessment
Ch 2: Plans for the future: Official strategies and transport projects Legal framework: transport and land use planning in Argentina The strategic spatial plan for the metropolitan region:
The strategic spatial plan for the city Under development and future projects
Ch 3: Towards a new perspective: A literature-oriented critical review on the two strategic spatial plans for the future
Different approaches, common weaknesses
When transport meets society: A theoretical background
Ch 4: Accessing Buenos Aires: A method to ensure activity participation through public transport policies in the Metropolitan Area of Buenos Aires
Scope of the research
Data research and organization Methodology and findings
Testing Marten’s approach Matching the indicators Orienting future policies
Ch 5: Final remarks: potential uses of the method
The method as an interpretative and propositive tool The method as an evaluative tool
2 2 3 4 5 8 8 10 15 22 31 34 40 40 44 47 51 56 56 59 64 64 66 69 78 80 82 88 88 89
In the last decades, transport planning has evolved towards a broader definition of mobility. Traditional approaches were focused primarily on efficiency concerns related to the provision of infrastructures and services to answer to an existent demand for movement. The main element of study was the movement itself, intended as the possibility to displace from an origin to a destination, without taking into account the motivations that were behind the choice, or the necessity, to move. Nowadays, new theoretical and operative perspectives, able to complement the established practices, are emerging (Kaufmann, 2002; Urry, 2000; Ascher, 2004; Lévy, 2004; Orfeuil, 2004; Bourdin, 2005; Cresswell, 2006). Mobility and social needs are being considered as complementary matters.
“Mobility, conceived as a necessity and as a right, reflects the possibility of access to basic services for the development of social life, for active participation in the economic activities and for the socialization of people.
Introduction
Research background Increasingly, the possibilities of mobility qualify
people and places and are systematically incorporated in concept such as the right to the city (…)” (Blanco et al. 2014).
In this sense, it is possible to assume that the role of mobility has a key role in the social participation. However, the possibility to move is strictly dependent on socio economic aspects. Belonging to the most disadvantaged portions of the population may limit the freedom of choice and access to activities that represent valued opportunities such as jobs, schools, hospitals and all the other spheres that can contribute to the quality of life of an individual.
The idea of choosing Buenos Aires and its Metropolitan region as our field of study comes from the curiosity to analyze a region where social dynamics different from the ones present in the European context could be found. The region, which population is almost 13 million of inhabitant and that has grown between 2001 and 2010 by 11% (INDEC), features a stronger degree of social inequality.
Furthermore, the demographic growth was accompanied by a continuous extension of the urban fabric with more fragmented forms. “(In Buenos Aires) the current dilemma of urbanism and transport is not a compact “or” diffused city. It is a compact “and” diffused city. Both coexist in the same metropolitan territory” (Gutierrez, 2012).
The historical development of the urban structure of Buenos Aires was directly related to the presence and improvement of the transportation networks. Nowadays, the dispersed growth challenges this tradition exacerbating the social segregation of the territory. Because of this, it may be interesting to evaluate if there is a connection between the quality of the public transport system, the policies that have been proposed by the authorities and the social inclusion (or exclusion) of the inhabitants.
Buenos Aires Metropolitan region becomes, thus, an ideal field of experimentation to understand if mobility and social inclusion are as complementary as conceived by the recent theoretical framework.
Research aims and structure
The aim of the research is to analyse the relation between quality and supply of public transport and the level of social exclusion of an individual in terms of accessibility to valued
opportunities. In order to reach this goal, an operative method of analysis has been developed to understand which are the most vulnerable areas of the whole Metropolitan Region of Buenos Aires. In this way, the method generates a criterion of priority of intervention, thus, identifies the weakest areas where a set of specific policies related to this matter is proposed. According to the referred theoretical background, these policies should, by upgrading the quality of the public transport, improve activity participation for the more disadvantaged people. In order to reach the proposed aim, the thesis:
1.analyses the current territorial organization and mobility practices of the Metropolitan Region of Buenos Aires, offering a general framework of its urban structure, its relationship with the infrastructural scheme, its socio-economic profile and a description of the mobility trends. This is made in order to understand the main dynamics of the study area and to be able to make informed proposals.
2.describes the main policies proposed by the strategic plans of the city and of the metropolitan region. Furthermore, the main ongoing transport projects have been identified to understand which are the priorities in the public policy agenda with regards to mobility issues and the organization of the transport network. The aim is to understand the type of approach followed by the plans regarding
the topic of mobility and accessibility.
3.proposes an operative and experimental method as a tool to identify, at a neighbourhood scale, the areas where low quality of the public transportation system, low access to valued opportunities (defined as access to jobs, schools, hospitals, etc.), low demand for movement and low socio-economic condition coexist. Furthermore, the method is used to orient more effective policies in the some of the most disadvantaged localities of the region.
4. defines which would be the relevance of the analytical tool in the sphere of transport planning, the potential users to whom may be directed and the evaluative and interpretative value it may have.
Research method
The method, by the combination of five indicators related to mobility and social aspects, creates a synthetic index to assess a priority of intervention based on the social value of public transport. The starting point implies the collection of data necessary to build the indicators. This process was particularly challenging considering the general scarce availability and quality of the open data specially when related to the chosen scale of analysis (neighbourhood). To analyse the mobility trends the Gravitation and Mobility indexes (describing the attractiveness level and the density of displacements of a specific location) are used to describe the real demand for movement. The Potential Mobility index (describing the average speed of the public transport) and Job Accessibility index (describing the number of jobs reachable in 60 minutes time by public transport) are used
1. DATA COLLECTION 2. INDICATORS SELECTION: 3. NORMALIZATION 4. UTILITY FUNCTION MOBILITY AS “ACCESS TO VALUED OPPORTUNITIES” ANALYSIS OF THE FIELD OF STUDY OPERATIVE METHOD 1 23 PRIORITY ASSESSMENT POLICY ORIENTATION DEMAND OFFER SOCIAL CONDITION
The thesis is divided in two main parts. The first one, characterized by a descriptive profile, aims to describe the territorial organization and mobility practices of the Metropolitan Region of Buenos Aires as well as the main urban and mobility policies proposed in the strategic plans (points 1 and 2). The second one, instead, introduces the analytical approach applied to the whole Metropolitan Region through an operative profile (points 3 and 4).
reference to a well-established literature (see Chapter 3) that validates the initial theoretical assumptions. The theories that are considered to orient the research conceptualize mobility as a basic necessity that is cause and effect of the participation of people in society. In a policy making field the method, even with an experimental character, could be used in an interpretative phase to understand the negative dynamics affecting the local scale without losing the metropolitan perspective: the possibility to consider the two scales at the same time may be relevant because mobility issues are often not constrained to the administrative limits. Moreover, the tool may be used with a propositive meaning.
According to a prioritarian perspective, public policies should be oriented with a priority criteria in order to guarantee benefit to the more disadvantage ones considering that, “benefits matter more the more worse-off the person to whom the benefit accrue” (Martens, 2017, Casal, 2007). Because of this, the areas that the method considers as most vulnerable become the place where specific policies related to the improvement of public transport are justified by concerns of social equity and fairness. This confirms the social value of the research. Finally, the method may be also useful in an evaluation process, because it may help to understand what can be the social impact of ongoing or proposed transport policies. It may be assessed that this method represents a first step towards the Relevance of the research
The method at the core of this research is characterized by scientific, social and political value. Regarding the first aspect, the scientific reliability is confirmed by the to describe the potential offer and quality of the public transport network. Finally, the Unsatisfied Basic Needs index is used to describe the socio-economic profile of the several areas of study. The five indicators were chosen because they are interdependent when proposing a policy on transport aimed to enhance activity participation. In fact, an amelioration of the transport system may increase the potentialities expressed by the indexes of offer and, by consequence, generating a change in the real demand for transport. This process can be at the base of a final improvement of the social condition of the inhabitants. All the indicators were normalized and managed to be combined by applying a utility function. The result is represented by a general map where each locality of study can be easily identified according to its level of priority of intervention. Finally, by analysing only the most disadvantaged areas, a more specific set of policy guidelines is proposed considering their real demand trends and the possibility, through an improvement of the transport supply, to increase the level of activity participation of the inhabitants as a pre-condition for their social inclusion.
construction of more informed public policies, even if it will require a further refinement to be effectively applied and its precision increases when better open data are available.
In conclusion, the aspiration of this research is to propose to policy makers a different point of view when approaching a territory of this complexity and aims to stress the concept that every decision related to the mobility sphere has a strong impact on the activity participation of people.
Knowing the
Metropolitan Area
of Buenos Aires
Current territorial organization and
mobility practices
Several definitions for the same area
In this Chapter the administrative status of the Metropolitan Region of Buenos Aires is described. Before deepening on this topic, a general political overview of the country is presented to understand the national context in which the study area is framed.
The Republic of Argentina is a federal nation with an estimated population of 44.044.811 inhabitants (INDEC, 2017) located in the southern part of South America. It is divided into 23 federal entities called Provincias and the Ciudad Autonoma de Buenos Aires (CABA) which is the capital special autonomous district. Each Province is considered by the national constitution as autonomous, which means that it can hold all the powers that chooses not to delegate to the federal government. The provincial governor (Gobernador de la Provincia), is directly elected by the people, as well as the Jefe de Gobierno which is at the same time the governor and the mayor of the CABA. There is a secondary administrative level which is
under the provincial one and it is composed by a large number of municipalities called Departamentos or Partidos. Each of them is often formed by several cities, towns and villages called Localidades and it is governed by an Intendente.
Buenos Aires is the capital and largest city of Argentina. When speaking about Buenos Aires it must be taken into consideration that there are two different administrative bodies that share the same name: one is the Province of Buenos Aires (PBA), while the other one is the Autonomous City of Buenos Aires (CABA). The PBA is the largest one in Argentina, with a surface of 307,571 sqkm and a population of 15,625,083 inhabitants (national census 2010) and, by far, the most populated one in the country. The urban fabric of the city of Buenos Aires has extended beyond its administrative limits creating a wide agglomeration which involves several municipalities of the PBA.
Because of the inexistence of a pubic body which regulates this agglomeration, several
definitions can be found throughout the scope of public plans and other legal documents,, these are:
Region Metropolitana de Buenos Aires (RMBA), 40 municipalities + the CABA. This definition is recognized by the Provincial Government of Buenos Aires and taken into consideration in the Lineamientos Estrategicos Para la RMBA, the last strategic plan presented for the region. The RMBA municipalities are chosen because of the following shared characteristic: production, commerce, urbanized habitats, mobility and environmental issues.
Area Metropolitana de Buenos Aires
(AMBA), 35 municipalities + the CABA. This division is used by the National Institute of Statistics and Census (INDEC).
Aglomerado Gran Buenos Aires (AGBA), composed by the CABA and 30 surrounding municipalities of the PBA that have a strong relation with the core city.
Conurbano bonaerense, following the law N°13473 of 2006 with 32 municipalities + the CABA. “In order to proceed to the administrative decentralization, granting and financing of programs and/or plans, of international and/or national and/ or inter-provincial organizations, and/ or interregional and/or provincial and/
44.044.811 12.800.000 population ARGENTINA AMBA 2.780.000 13.000 surface (sqkm) 52% 48%
GDP production as % of the National
A city of corridors: historical growth of the urban fabric
or inter-municipal organizations, be these social, health, production, promotion of cooperative activity, employment, education, environmental sanitation, security, housing, urban regularization, urban and interurban social infrastructure, road, water and energy networks for regional development, in the provincial area, will be understood that integrate the territorial area of the Buenos Aires the suburban municipalities of ... (LIST) “ Gran Buenos Aires (GBA), 24 municipalities + the CABA. This is the main definition used by the National Institute of Statistics and Census (INDEC).
The limits of the study area of this research
follow this last definition because it includes the municipalities which are an integral part of the continuous urban tissue. A secondary reason is that the availability of data referred to these portion of the territory is wider than for the rest of the region.
The urban configuration that currently presents the Metropolitan Area of Buenos Aires was conformed since the establishment of the City of Buenos Aires in 1580. The Territorial Model 2020-2060 says that, at the end of the 19th century, the urban form
Avellaneda Quilmes Berazategui Berisso Ensenada La Plata Pte. Peron Tigre San Fernando Escobar Pilar Vte. Lopez Moreno Gral. Rodriguez Marcos Paz Ezeiza Merlo San Isidro San Vicente Cañuelas
Ciudad de Buenos Aires Campana
Zarate
Exaltacion de la cruz
Lujan
Gral. Las Heras
Brandsen 1 2 3 4 5 6 7 8 9 10 11 12 13 14 RMBA AMBA Lanus Lomas de Zamora E. Echeverria La Matanza Moron Ituzaingo Hurlingham Tres de Febrero Gral. San Martin Malvinas Argentinas 14 Jose C. Paz San Miguel Almirante Brown Florencio Varela Conurbano bonaerense GBA | Study area
13 12 11 10 09 08 07 06 05 04 03 02 01
Different administrative boundaries
north, the railroad arrived to Belgrano (city) in 1862, and to San Fernando (province), in 1863. In the same year, the South railroad opened its services, which by 1872 reached Quilmes (province). During this time, it was formed the spatial configuration of the terminal stations that were located in the periphery of the urban plot of that time. Retiro to the North, Miserere to the West, and Constitucion to the South, linked the city with the nearest rural periphery and, essentially, the interior of the country. Beyond these transformations, in 1870, Buenos Aires still presented a small urban plant that maintained its traditional organization, reason why most of the daily activities of the population was made by foot. In 1869, the first drainage of the running water network was created, with a very limited extent.
Between 1870 and 1880 population growth and the diversification of economic activities drove the expansion of the city with the consolidation of new peripheral neighbourhoods. The trip from the centre to the neighbourhoods began to be quotidian for much of the population. Nevertheless, despite its expansion, Buenos Aires continued revolving around the traditional centre. The tram network was increased to cover the increasing need for mobility, gradually integrating the whole city. In 1880 Buenos Aires became the Federal Capital of the country and in 1888 its territory was precisely defined. The federalization of the city encouraged several of perpendicular streets and squared blocks
was expanded through the circulation axes, forming peripheral neighbourhoods that were then gathered together and consolidated the urban fabric of the city.
As the central area planned avenues to improve circulation, the centre became the main area of the inhabitants and of the city itself. Very close to it, but still detached, were also born numerous settlements of rural origin related to the activity of the city.
By 1860 the traditional urban scheme was quickly transformed. The central area was consolidated and the neighbourhoods were acquiring different functions and hierarchies. The population of bigger resources was abandoning its traditional location in the southern part of the city to build their new residences in the north, in the neighbourhoods of Retiro, Recoleta and Palermo. This was due to the poor health conditions of the southern area (cholera epidemic of 1869 and yellow fever of 1871) and the trends of the time, which favoured individual houses. The centre started to be defined by commercial and banking sectors.
It is during this decade that some growths on the new axes of the railroad begin to appear in the Metropolitan Area. Towards 1857, the railroad of the West arrived until Flores (located in the city), and in 1860, until Moreno (located in the province). Towards the
urban projects aimed at meeting the growing demands of sanitary services, sewers, electric lighting and mobility. In 1912 the construction of subway line A and new railway terminals began.
The changes in means of transport were historically key players in the dynamics of the expansion. In the first three decades of the twentieth century the horse-drawn tram is replaced by the electric one. In 1913 the underground was inaugurated, the first one in Latin America. The transport network was gradually expanded, extending its main lines to the outlying neighbourhoods of the city such as Belgrano, Flores and Liniers, and improving the urban and suburban rail services. All these events promoted a radial growth in the form of great tentacles that came out from the centre of the city also generating the growth of a great number of small towns in the border of it. From 1905 the use of the car began to be incorporated together with the construction of roads suitable for them. Urban growth was driven by the main public transport networks, first by the railroad and then by the public bus. The population of the city continued to grow.
Whereas in 1904 only 26% of the population of the Capital City resided more than 5 km from the centre, only ten years later, in 1914, 46% were in this situation. The pattern of occupation in the city, was different between one place and another, due mainly to cultural
habits, and different quality of transport offer. Benefited by very good transport services and by highlands, the North corridor continued the movement initiated by the wealthy class in 1860 and was receiving the population of greater resources. The South corridor was linked to the workers’ sectors, in relation to the growing industrial location. At the same time the West axis was losing momentum in this period. In 1914 the group formed by the Capital City and the 19 municipalities represented little more than two million inhabitants, 78% of which lived inside the City. In 1935, two decades later, this proportion had declined to 69%. In the middle of 1920 the public buses began to have a greater presence.
From the 1930s, there was a profound social transformation, associated with the participation of the population in the labour market, especially linked to industries. In this context, the population of the Metropolitan Area grew at an accelerated pace, well above the country average, which boosted the concentration of the population in Buenos Aires, from 25.2% of the country in 1935 to 35.4% in 1970. In this period, migration from the interior of the country to the metropolis became the main responsible for the accelerated growth, which allowed the consolidation of the first metropolitan crown. In 1947, the City of Buenos Aires stopped its population growth (with 3 million inhabitants) unlike the Metropolitan Area, which continued
Urban fabric 1910
Urban fabric 1947
Urban fabric 1972
to grow.
In the early 1950s, railroads and natural resources were nationalized, and the internal consumption expanded. All this situation gave rise to new territorial reconfigurations of the Metropolitan Area.
Since 1940, in the traditional corridors, the growth was continuous. The North axis is consolidated extending from the districts of Retiro and Recoleta to Tigre. As today, the neighbourhoods on this corridor were well served by public transportation, and connected by fast-track car traffic with abundant landscape resources. They also focused on the best level of infrastructure and housing
equipment. In the southern neighbourhoods, in general, there is a lower density and socioeconomic level. Between these extremes, diverse gradations are reproduced along the City. The social mix recognizes a historical density and a decreasing socioeconomic level from the centre to the periphery, as well as from the nods to the gaps between them. In 1970 only a little more than a third of the population of the Metropolitan Area of Buenos Aires lived in the City. Industrial development played a very important role in the concentration and growth of the metropolitan area. In 1970, large public projects were carried out, such as the built up of highways. In this period the growth of 10km crown 1 crown 2 crown 3 Tigre San Fernando Pilar Vte. Lopez San Isidro Avellaneda Quilmes Berazategui F. Varela
Alte. Brown Berisso
Ensenada La Plata Pte. Peron Moreno Gral. Rodriguez Marcos Paz E. Echeverria Merlo San Vicente Cañuelas
Gral. Las Heras
Escobar CABA La Matanza 8 4 5 1 2 9 12 6 7 11 10
poverty increased sharply.
In the Metropolitan Area, the mechanisms that had driven the expansion (the economic price of lots) showed signs of exhaustion, and population growth was demonstrated through the occupation of vacant lots, the densification of the space already built through the subdivision of plots, housing overcrowding, and the growth of precarious settlements and villas miserias. A process of de-concentration of the population began in the Metropolitan Area of Buenos Aires, as a result of a decrease in the annual growth rate, which reversed the so far high growth trend. In any case, the population in the Gran Buenos Aires continued to increase and in 2001 exceeded 12 million inhabitants. In terms of territorial expansion, the Metropolitan Area reached the third crown. As an additional information, the population in villa
miserias doubled between 1991 and 2001.
In the outer periphery of the City, another phenomenon facilitated by highways was consolidated: gated communities oriented to high class sectors.
Nowadays, it is in the central area of the Autonomous City of Buenos Aires that most metropolitan, national and even global financial and administrative activities are located.
By analysing the description of the Territorial Model 2010-2060 produced by the CABA,
A fragmented region: land use patterns
The current distribution of land use in the Metropolitan Area of Buenos Aires reflects the urbanization process which began its expansion in the late 1800s. The areas with highest residential densities can be found inside the city of Buenos Aires distributed specially along the centre and north part of it. The south of it, because of its evolution and geographic characteristics its more relegated to a high mix of industries and medium density residential areas. In the borders of the City, next to the main arteries there is concentration it is possible to understand how the region that was born concentrically concentrated and continuous, was gradually transformed into a fragmented and discontinuous scheme due to the lack of planning and regulation of its growth, mainly, along the axes of public and private transport. It is possible to stand that this growth was also influenced by the different political actions and the consequences that these actions entailed in the appropriation of the land of the different areas of the metropolitan region.
Nowadays, large sectors of medium and high income classes are located in the City of Buenos Aires, while middle and low income sectors predominate in the peri urban area, with the exception of the north axis and some new gated communities spread throughout the territory.
roads as moving away from the city.
The residential areas, even though they can be found at different distances from the urban area, are usually associated with the infrastructural corridors. This because they are the concentration of the fast and easy access roads as well as of the rail system. In a vast context of this characteristics, the access to a fast mean of transport may be crucial to develop the daily activities. Some exceptions can be found in the Southern rails which are mainly dedicated to industrial uses. Although in some cases the residential areas are second homes frequented mostly at weekends, most of them are permanent residences. It is important to underline that there’s no general map of
Rural Area Residential_High density Residential_Medium density Residential_Low density Residential Mix Industrial_Exclusive Industrial_Mix Centralities Gated community Country Club Reserved Area Specific use Equipment Recreation Recover area Protected area 10km Rural area Res. high density Res. med. density Res. low density Residential mix Industrial exclusive Industrial mix Centralities Gated community Country club Reserved area Specific use Equipment Recreation Recover area Protected area
Land use patterns in the study area
of industrial areas as well as some green spaces or areas designated to other kind of uses.
The rest of the peri-urban area is characterized as a transition zone between the urban use and the rural area, where there are spread sectors with different types of allowed construction, from high density to medium density and some farmhouses and open fields. Generally, with the exception of the northern area and some gated communities, the areas of the second and third crown are occupied by inhabitants of low purchasing power and, in some extreme cases, do not count on cloacal services and water of network, among others. It is also common to find a lack of paved
land use of the Metropolitan Area. In order to analyse the hole area, it was necessary to consider a map, made by the Province of Buenos Aires, which had gathered the different land uses planned by each municipality. The different land use patterns observable in the Metropolitan Region of Buenos Aires lets the reader assume how the built environment
8 4 5 1 2 9 12 6 7 11 10 10km Tigre San Fernando Vte. Lopez San Isidro Avellaneda Quilmes Berazategui F. Varela Alte. Brown Pte. Peron Moreno E. Echeverria Merlo La Matanza CABA 0 1000 2000 3000 4000 5000 6000 7000 8000 9000 10000
1 crown 2 crown 3 crown
is highly different and heterogeneous at the same time, diffuse and compact, which has an impact on the territorial levels of population density. The AMBA presents an average value of 3,342.39 inhab/sqkm according to the 2010 INDEC national census. The compact and dense CABA presents a value
of 14,000 inhab/km2, that is, as expectable,
the highest that can be encountered in the 0-500 501-1.000 1.001-2.000 2.001-3.000 3.001-5.000 5.001-10.000 10.001-50.000 50.001-100.000 +100.001 Lanus Lomas de Zamora E. Echeverria La Matanza Moron Ituzaingo Hurlingham 01 02 03 04 05 06 07 Tres de Febrero Gral. San Martin Malvinas Arg. Jose C. Paz San Miguel 08 09 10 11 12
Population density (inhab./km2) in the study area at census track scale
Train network Mun. limits
10 Km
third crown. In this area the average density
is 436,9 inhab/km2 and the settlements are
mostly concentrated around the main centers or dispersed in the countryside due to the rural activities. This areas, because of the vastity of the territory, the notable distance to the CABA and its lower number of inhabitants, depend mainly on interurban bus lines to move and, in a secondary level, on low frequency train lines. Because of this, as described in following chapters, the third crown tends to be a territory where projects on public transportation are not proposed, probably because the main strategies to develop a strong and frequent public transportation network are directed to the most populated areas.
In order to have a more concrete idea of the real configuration of the territory each of the land use definitions will be presented:
whole metropolitan area.
The density value starts to decrease while moving from the Federal Capital to the outskirts. The municipalities of the first crown have an average density of 6,555.7 inhab/sqm, with the highest values in the municipalities directly neighboring the CABA (Lanus, Vicente Lopez and General San Martin). Usually, the neighborhoods of the first crown that are located close to the boundary with the City of Buenos Aires present the higher values of density, creating an urban continuum that is only interrupted by the presence of the General Paz Avenue. Other densified places in the first crowns municipalities are located in correspondance with areas of historical development that are also usually close to the main local railway stations.
In the second crown the size of the municipalities increases widely and the urbanized settlements become less dense and more dispersed, with few concentrated area, mainly located along the main infrastructures (road and rails) also as a response to the land use. In this wide area the density drops to
2,954.5 inhab/km2. The municipalities that
maintain a “first crown” level of density are the highly populated cities of Malvinas Argentinas and Jose C. Paz, on the north, and Quilmes and Almirante Brown on the south. Finally, the lowest density values are encountered in the further urban area that is composed by the vast and low populated rural communities of the
Areas destined to sites of uses related to ex-tensive agricultural production, forestry, min-ing and others.
Rural Area
Area destined to residential use with a high degree of densification and consolidation, in which compatible uses are accepted with the dwelling
Residential High Density
Areas for exclusive residential use of medium density with individual and collective dwellings Residential medium
Areas for exclusive residential use with individual and collective houses of medium density and low limited height.
Residential low
CABA
Merlo Moron
Residential mix
In this zone, there can be only industrial estab-lishments defined as 1st Category, as well as residential uses.
They are the areas destined to the location of the administrative, commercial, financial and institutional equipment, at local level, with ad-equate accessibility.
Centralities
Industrial exclusive
In these areas any industrial establishment (1st, 2nd or 3rd category) may be installed regardless of its Level of Environmental Complexity (N.C.A.*).
In this zone only industrial establishments defined as 1st and 2nd category can be established.
Industrial Mix
Quilmes Avellaneda
Gated community
Country Club
Reserved Area
Specific interest oriented to the common good. These areas give rise to the conformation of natural environments where different species of native flora and fauna can be maintained in perpetuity or increase its diversity.
Specific Use
Areas for transport uses (terrestrial, maritime or fluvial and aerial), of the communications, the production or transmission of energy, the defence, the security and other specific uses.
Berazategui San Miguel
Describing the complexity of the mobility system: Infrastructure, service and management Equipment
They are areas where are located activities that serve the city in general and that by their characteristics admit the restricted coexistence with the residential use.
Recover area
The one that, in its current state, is not suitable for urban uses, but is recoverable through suitable works or actions.
The one mainly destined to the leisure activity idle or active, with the equipment adapted to these uses. It can be located in any of the areas.
Recreation
This district encompasses areas that, due to their historical, architectural, symbolic and environmental values, have a high heritage significance, being deserving of a protection treatment of their differential characteristics.
CABA
San Isidro
Lanus Merlo
Protected area
As highlighted in the previous sections, the development of the urban fabric is strongly related to the growth of the infrastructural network. Because of this relation, and according to the scope of this research, a deeper description on the mobility system is
presented.
The general structure of the mobility network of the AMBA is dominated by six main radial corridors formed by the compresence of railways and highways that converge in the CABA and four concentric roads (General. Paz Avenue, route N4 known as Camino de Cintura, Camino del Buen Ayre, and route N6) which are partially under construction. The Avenue General Paz is the first concentric axis built during the first half of the XX century. At the time, it represented a sort of a buffer between the urbanized areas and a mainly rural territory. By the 60s the urban expansion transformed the avenue into an urban express way with 6/8 lanes. The highway physically demarks the administrative boundary of the CABA (except for the southern side) and it is today, by far, the most congested highway in the country. Route N4 (Camino de cintura), was initially conceived to delineate the urban expansion as a major tangent corridor and runs completely into the expanded urban realm of the AMBA. It is a 70km road which is mainly composed by two carriageways with two drive lanes each but it becomes also a standard urban street (with two lanes in a single carriageway) when crossing denser urban areas, especially in its southern part. The Camino del Buen Ayre, opened in 1982 being the first completed branch of an under-construction highway that is expected to surround the urbanized area of the AMBA (second crown), allowing the connection
between all the radial highways crossing the territory. The decision to extend the Camino del Buen Ayre, was taken in the 90s by the government where the new branch of the concentric axis would be called Autopista Presidente Peron. A long projectual phase was hold between 1995 and 2011, when works finally started. Even though the completion of the 94km highway was expected for 2019, due to economic and organizational problems, such as the necessity to expropriate lands and environmental issues, the highway is still in its initial steps. Finally the route N6 is the most external concentric axis. It is a 180km long corridor built during the 60s to finally delimit the expansion of the AMBA. It is manly composed by two carriageways with two lanes each. After its completion, many productive sites where located along it, generating a consistent commercial traffic that convince authorities from the province to impose a toll that still stands today.
Concerning the public transport infrastructure, most of the rapid transit lines serve directly the city: all the rails that cross the metropolitan region are headed to their terminus in the CABA and the subway system is totally included inside the city boundaries. The six subway lines that compose the underground network are also designed in a radial way, connecting the city center, where they converge, to different cardinal points on the outskirts of the city, with the exception of two transversal connections. There are also eight
Tigre San Fernando Vte. Lopez San Isidro Avellaneda Quilmes Berazategui F. Varela Alte. Brown La Plata Pte. Peron Moreno E. Echeverria Merlo San Miguel Ezeiza 1 8 4 195 18 17 23 24 25 21 53 14 26 27 201 6 4 4 6 6 8 1 205 205 58 200 3 3 4 210 205 6 6 28 25 21 215 Au8 CBA AvGP AuR AuBP AuO PAN Au2 AuPP 8 4 5 1 2 9 6 7 11 10 Highways
Prov. and nat. routes Planned highway General streets Lanus L. de Zamora E. Echeverria La Matanza Moron Ituzaingo Hurlingham T. de Febrero G.S. Martin M.Argentinas Jose C. Paz Study area 6 Mun. limits Road network Airport 01 02 03 04 05 06 07 08 09 10 11
bus rapid transit lanes and one pre-metro (an overground light rail).
In order to better understand the characteristic of the infrastructure and the specificities of the service of the public transport system, each mean of transport will be described individually.
The urban train network is structured on eight lines with a total of 832.9km and 273 stations with 41 of them located inside the city. The system is radially distributed in relation to the city and covers the northern area with three lines (Mitre, Belgrano Norte and Tren de la Costa), the northwest with two lines (Urquiza y San Martin, the southwest with two lines (Sarmiento and Belgrano Sur), and, finally, the south with one line (Roca), which also covers a small part of the southwest. Even though it has a big extension, it still doesn’t beat the use of the bus to get to the city or to move between municipalities of the Metropolitan region. According to the official timetables, the daily frequencies inside the city and in the first crown are pretty high, with very good performances on the main coastal corridor (Mitre – Roca). This performance change when reaching the second crown, where the offer tends to decrease to less than 150 daily trips. In 2015, according to the data of the CNRT (National Commission of Transport Regulation), the total number of passengers was 330.347.361 making the train the second most used mean of transport for AMBA
to CABA displacements (19%), a figure that is very low if compared with the one related to the use of public bus (52%). Regarding the management side, the service has known different changes during the last decades. During the 90s, all the lines were given in concession to several business companies, a process that ultimately brought to a decrease in the use and quality of the service, a situation that got particularly critical with the national crisis of 2001 (Barbero, 2012). The process of deterioration of the infrastructure and the poor management are at the base of the reform of 2014 when six of the lines returned to be controlled by the state. Together with this change, new investments have been directed in the improvement of the infrastructure and of the service. The two lines that are still privately managed are the Urquiza line which belongs to the same private company of the subway and pre-metro (Metrovias S.A.), and the line Belgrano Norte which is in the hands of Ferrovias S.A.C.
The system of public bus has more than 360 lines and some of them have more than eight different branches on a same route. The total number of lines can be divided into three categories. The ones of national jurisdiction (numbered from 1 to 199) are those which at least in one part of the route pass through both, the city and the province. The ones of provincial jurisdiction (numbered from 200 to 499) connect at least two municipalities from the province and the ones of communal
Temperley - Haedo
Constitucion - Ezeiza
Constitucion - A. Korn
Constitucion - Gutierrez
Constitucion - La Plata
P.te Alsina - Bonzi
Bs.As.- G. Catan Bs.As.- M.d. Crucerio
Villa Ballester - Zarate Victoria - Capilla D.S. Retiro - Mitre Retiro - Tigre Avellaneda Quilmes Berazategui Berisso Tigre San Fernando Vte. Lopez Moreno Merlo San Isidro Ezeiza Retiro Constitucion Once Bs.As Lacroze 9 8 7 6 1 2 5 10 11 12 3 13 4 14 Temperley Moreno Haedo J.C. Paz Villa Ballester Victoria Grand Bourg Ezeiza Bonzi Marcos Paz Pilar Capilla del Senor Escobar Campana General Rodriguez P. Peron San Vincente La Plata Ensenada Canuelas Tren de la Costa Mitre Belgrano Norte Urquiza Lanus L. de Zamora E. Echeverria La Matanza Moron Ituzaingo Hurlingham T. de Febrero G.S. Martin Sarmiento Study area San Martin 01 02 03 04 05 06 07 08 09 12 San Miguel M.Argentinas Jose C. Paz Belgrano Sur 10 11 Train network Roca Mun. limits
Trains per day: 0 - 49 50 - 99 100 - 149 150 - 219 220 - 499 + 500
jurisdiction (numbered from 500 onwards) circulate exclusively inside each municipality. According to the law N 24,449, the operative units should not be more than 10 years old. Since October 2013, units that are acquired zero kilometres by companies with national jurisdiction, must have an air conditioning system. On October 2014, the Province of Buenos Aires adhered to these regulations, adding also the mandatory use of accessible units for people with reduced mobility. With respect to the public buses of national jurisdiction “the exploitation of public services is carried out by permits granted by the CNRT, which must be awarded through the public contest of proposals, or by special authorizations” (Act 300/10 of the General
Auditory of the Nation). The service operates 24 hours a day. Although from 22:00 hours onwards the frequency is reduced to the criterion of the provider of each line, the company has the obligation to provide a service, at most, every 30 minutes.
Since 2011, the city of Buenos Aires has incorporated the system of Bus Rapit Transit (Metrobus) along several main corridors. Even though most of them can be found inside the city, extensions are proposed towards the metropolitan area. Nowadays, the total length of the dedicated lanes is 73km and affects 101 bus lines (official data from 2017, Gobierno de la Ciudad). It is necessary to consider that, even do the travel
Tigre San Fernando Vte. Lopez San Isidro Avellaneda Alte. Brown E. Echeverria Quilmes Berazategui F. Varela 8 4 5 1 2 9 6 7 11 10 San Miguel Ezeiza CABA National Provincial Municipal Mun. limits Study area Lanus L. de Zamora E. Echeverria La Matanza Moron Ituzaingo Hurlingham T. de Febrero G.S. Martin M.Argentinas Jose C. Paz 01 02 03 04 05 06 07 08 09 10 11
28
time has been reduced in the places where it was implemented (CEPAL 2012), it may also affect the circulation of the private cars by increasing the already existing congestion. With respect to the CABA subway network, the six lines (A, B, C, D, E, H) have a total length of 53.7km with 86 stations and the pre-metro has a total length of 7.4km with 18 stations. The most used lines are B and D, with 83 and 80.2 million passengers, followed by A (56.3 million), C (45.6 million), E (17.4 million) and H (17.4 million). The Pre-metro light rail carries about 1 million passengers. In 2016 the total number of passengers ascended to 304.057.514 which showed a variation of 11.41% with respect to 2015
(official data from 2016, Gobierno de la Ciudad). The first subway of Buenos Aires, and the whole South hemisphere, was inaugurated in 1913, and even though it positioned the city as a new leader regarding mobility issues, during the 50s its growth rate started to slow down. Not only the subway system is the only one in the whole country but also, other cities like Sao Pablo or Santiago de Chile, which inaugurated their subways in the 70s, already exceed 90km of length in the total network.
Even though the subway system belongs to the City of Buenos Aires, due to a concession contract signed during the 90, it is currently operated by Metrovías S.A..
Berazategui
F. Varela
Alte. Brown
Berisso
Ensenada
La Plata
Pte. Peron
Tigre
San Fernando
Escobar
Pilar
Moreno
Gral. Rodriguez
Marcos Paz
E. Echeverria
Merlo
San Isidro
San Vicente
Cañuelas
Campana
Zarate
Exaltacion
de la cruz
Lujan
Mercedes
Gral. Las Heras
Navarro
Lobos
Malvinas Argentinas
Jose C. Paz
San Miguel
General San Martin
Hurlingham
La Matanza
Moron
Tres de Febrero
Lanus
Lomas de Zamora
Esteban Echeverria
Ituzaingo
1 2 3 4 5 6 7 8 9 10 11 12 13 14Almirante Brown
Florencio Varela
5 4 2 3 6 12 6 7 11 10A
B
C
D
E
H
P
1Subway, Premetro and Metrobus lines
Subway A Subway B Subway C Subway D Subway E Subway H Pre-metro Metrobus Mun. limits Vte. Lopez Gral. San Martin Tres de Febrero 01 02 03 La Matanza Lomas de Zamora 04 05 Lanus Avellaneda 06 07 Train lines
The concessionary has the possibility to increase the ticket fare to improve the service or because of the inflation but, they don’t have the responsibility of lines extension. This is in hands of “Underground of Buenos Aires Society of the State” (Subterráneos de Buenos Aires Sociedad del Estado), which is the company of the City of Buenos Aires that oversees the administration of the network, its development, expansion and control of the operation of the service.
With respect to the vehicles for hire, there are three different kind of services: charter, taxi and remis.
The charter or pullman is a private service contracted for direct trips with reduced stops at the origin and destination. It is used for direct journeys between the periphery and the central area of the CABA for trips with fixed routes and schedules of 30 km and average travel time of 40 minutes. The service is provided on all axes of the RMBA, from 10 to 100 km from the central area. (Gutierrez, 2012)
There is a gradual differentiation of the profile of service: there is a charter of superior quality or expensive and another one of inferior quality or economic. Those of superior quality have higher prices than the public transport, passengers of socioeconomic level medium to high, vans in good to very good state, predominantly legal operators and a
personalized service (telephone reservation, prepayment, discounted packages, drop-in drop-off podrop-ints on demand, deal with the company, offices downtown but distant from the train stations). Low-cost charters have similar prices to public transport, medium to low socio-economic passengers, good to regular vans, predominantly illegal operators, and non-personalized service (waiting at stops, close to the train stations, payment on board and by trip, deal with the driver) (Gutiérrez, 2005)
The charter adapts the service according to the socioeconomic peculiarities of the north, west and south axes. The low-quality ones are concentrated in the south-west corridors (towards La Matanza) and south-east (towards Florencio Varela). There are also transversal trips, which surround the CABA towards the north or northwest of the AMBA, reaching places such as Pilar, which attract workers for industry and construction (new residential, commercial developments, etc.). For distances greater than 50 kms, there are only expensive charters in all corridors (Gutiérrez, 2005). On the other hand, the taxi is a service that responds to a personalized demand. Although it used to be considered a safe, efficient and economical option for users, currently, due to various cases of insecurity and the increase of its fare, it is no longer a viable option for all types of users. Inside the CABA there is also the option of “radio taxi” service. Although
it is considered in the ENMODO (2010) survey, the available data is very few. Unlike other means of transportation, taxis are not subsidized by the government.
The remis also acts as a rental car but without a taximeter, where the rate corresponds to the kilometres of travel to be made. As in the charter, the authorized remis vehicles are around 50% and the rest operates in an irregular way. Different profile services are also distinguished according to price and quality. There are high quality or expensive, with prices above public transport (up to 10 times the price per km), legal vehicles in good condition, with door-to-door service and by telephone request, similar to the taxi. And there are lower quality or economic, with fixed price, equal to the subsidized public transport (or up to 25% lower), old vehicles and/or in poor condition, in a situation of illegality, and with services on fixed routes. This profile is exclusive of the periphery, which correlates with its deficit of public transport. The remiserías are concentrated in central areas, in the CABA or in the main localities of the periphery around the train stations or hypermarkets. It can’t be found in low density areas. “The remis is a discretionary service that operates according to economic, urban, social and personal barriers. Travels for strangers towards “dangerous” districts are hardly accepted. These barriers operate especially in the periphery, where the greater contrasts accentuate the selectivity.
The bad condition of the streets and/or its lack of denomination and numbering makes it difficult to provide the service, as well as the exclusivity of the service for companies (of industrial parks, for example) and closed urbanizations” (Gutierrez, 2012).
Finally, it is important to underline that a big part of the mobility system receives economic subsidies from the national government. The arguments which justify the subsidies to the public transport are usually connected to the economic efficiency and distributed equity. (Castro and Szenkman, 2012).
Since 2011, the subsidies to the transport system have been growing unmeasurably. Several studies show not only the inequity of its distribution but also its ineffectiveness. A report made by the Argentine Association of Budget and Public Financial Administration (ASAP) stands that during 2014 the national subsidies to the public transport represented 1.4% of the national GDP. Regarding the public transport dependent on the National State, 66.1% of the subsidies are directed to the public buses, 23% for the train system and 10.3% for the national flight company Aerolineas Argentinas. Of all these subsidies, half of them are distributed in the AMBA, while 22% are for the rest of the province of Buenos Aires. What is left is distributed between other important provinces as Cordoba, Santa Fe or Mendoza, and the remaining 10.6% is distributed all along the country. With regards
to the public bus exclusively, 40.5% of the subsidies are directed to the national ones, thus,bus lines that circulate through the City of
Source: Updated to 10/2016. Newspaper La Nacion. Gas oil is not included because it is not discriminated by jurisdiction.
Data based on: Secretariat of Transport
40,5% 33,3% 4,7% 4% 3% NATIONAL JURISDICTION BUENOS AIRES CORDOBA SANTA FE MENDOZA TUCUMAN SALTA JUJUY MISIONES SAN JUAN ENTRE RIOS
SANTIAGO DEL ESTERO CHACO CORRIENTES CHUBUT NEUQUEN RIO NEGRO SAN LUIS OTHERS 39% PUBLIC BUS SUBSIDIES BY JURISDICTION National jurisdiction Buenos Aires Cordoba Santa Fe Mendoza Tucuman Salta Jujuy Misiones San Juan Entre Rios
Santiago del Estero Chaco Corrientes Chubut Neuquen Rio Negro San Luis Others
Buenos Aires exclusively, or touch the CABA at some point of its route.
The regulation of the subsidies system is very low and that is why the system is prone to fail (Szenkman, 2012). In this context, some possible negative impacts could be, for example, a high concentration of subsidies in only one sector; no equity in the geographical distribution; possible filtration of the subsidies
to people that do not need them and an increase in the number of subsidies without any improvement of the service that is being offered.
A region of inequities: analysing the socio-economic profile of the population
In this section, a discourse on the social structure of the inhabitants of the Metropolitan Region of Buenos Aires is described. Social condition is a topic of relevance for a research which is aimed to understand how the characteristics of the mobility system may have an influence on the social participation of individuals. This is particularly true for those who, in relation to their low socio-economic status, are potentially more dependent on the public transport offer.
The urban region of Buenos Aires features different kinds of social conditions that can be explored using the available census data, mainly provided by the INDEC (Institute of Statistics and Census of the Republic of Argentina). There are two main indexes, used by official sources, that are used to describe the metropolitan socio-economic patterns. The first is the Human Development Index (HDI), which is provided at a municipal level. The study on this index has been carried out, during the years 2004/2005, by the United Nations Development Program (UNDP) in
cooperation with the Banco de la Provincia de Buenos Aires Foundation based on the official data from the 2001 census. The report on Human Development in the Province of Buenos Aires (IDHPBA) goes more in depth than the usually scopes (related to national and regional scale) and analysis the municipalities that composes the AMBA, offering a general but useful frame to understand, at a great scale, the socio-economic disparities that characterizes the urban area.
According to the UNDP, the HDI is an index composed by data related to three main domains: education, wealth and health. The first domain is based on the level of education of the population, the second on the per capita GDP and the third on the life expectancy. Each of the three dimensions is expressed on a synthetic value comprised between 0 and 1 that represents the ideal development. According to the HDI value, every municipality ranks in four possible categories referred to the quartile in which they are located. The first quartile (0.8 - 1.0) encompasses municipalities with very high human development, while the high human development index municipalities (0.50 - 0.79) are in the second. There are two other quartiles that are medium and low development that are not featured in the AMBA. The result of the 2004/2005 enquiry is synthetized in Figure x.
The map shows that in the AMBA the level of HDI at municipal level are between 0.75
(Florencio Varela) and 0,907 (Vicente Lopez), meaning that in the AMBA there is a gap between municipalities that can be represented by the difference in socio economical aspects existing between, for example, countries such as Bosnia and Herzegovina and Sweden. It is also worth noting how the socio economical level expressed by the HDI tends to be higher in the municipalities located in the first crown, with notable peaks on the northern side of the CABA, where the most affluent municipality, Vicente Lopez, is located.
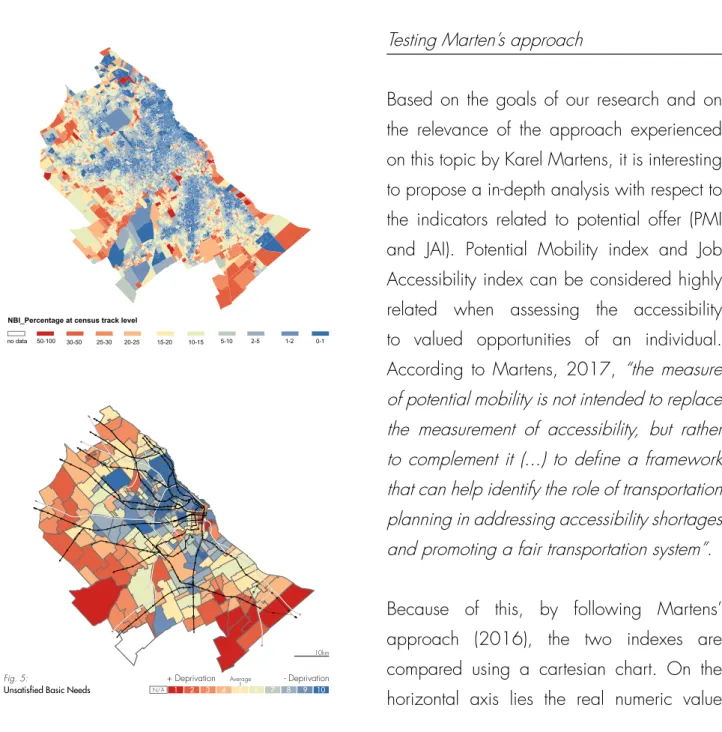
A second available indicator, which is the most descriptive and that is extensively used in the operative part of this research is the Indice de Necesidades Basicas Insatisfechas (Unsatisfied Basic Needs Index). It is a social and housing deprivation indicator that was calculated in the 2010 Indec census by
Vicente Lopez Florencio Varela
01 02
Human Development Index at Municipal scale
7 8 9 10 3 2 A B C D E H P 1 10km + 0.91 0.96-0.90 0.81-0.85 0.76-0.80 0.70-0.75
considering households that feature at least one of the following conditions of socio-economic deprivation:
1)Household living in a precarious building or/and with rent affordability problems
2)Lack of sanitation
3)Residential overcrowding
4)Lack of access to the educational system 5)The presence of a single low educated employed in a household with four or more inhabitants
The result is an index that expresses the percentage of households, at a census track or municipality scale, that feature a problematic situation. The geographical results, at both scales, are represented in Figure x. At the municipal level, the map presents common features with the one of
the Human Development Index. The first crown municipalities have a generally lower percentage of households that are facing social or housing deprivation. As expected, the less problematic areas appear to be the ones located on the north of the CABA, with Vicente Lopez still being the most affluent municipality with only 2,9% of the total households living in poor conditions. On the other side, the second crown municipalities present higher percentages of the figure, touching the 17,10% of Florencio Varela, that is confirmed as the most disadvantaged city in the AMBA. More specific trends can be observed applying the indicator at the census track. Each municipality, in fact, has a more complex socio-economic structure that should be analysed at a smaller scale. At this scale the value of the index ranges between 0 and 100%, meaning that several localities have
10 5 0 10 10km 12.7-17.1 11.9-12.7 10.8-11.9 9.6-10.8 8.7-9.6 7.1-8.7 6.1-7.1 5.0-6.1 3.6-5.0 2.9-3.6 2.9-3.6
Unsatisfied Basic Needs Index at Municipal scale
50-100 no data
NBI_Percentage at census track level
0-1 1-2 2-5 5-10 15-20 20-25 25-30 30-50 10-15 50-100 30-50 25-30 20-25 15-20 10-15 5-10 2-5 1-2 0-1
a totally problematic structural and social condition. There is an evident concentration of well-off areas in the northern side of the CABA and in the northern municipalities located along the coast. Another interesting feature is the location of many of the most affluent areas outside the boundary of the CABA, in the first crown municipalities. The predominance of wealthy areas tends to be maintained when moving towards the periphery of the Metropolitan Area along the main infrastructural corridors, such as the railways and the motorways.
Moving around: mobility patterns and accessibility assessment
The AMBA is a wide urban area where every day around 20 millions of trips are made, generating a network of relationships that is synthetically analised in this section of the thesis. The aim of this description is to understand the demand for movement that is, indeed, an important aspect to be considered when understanding the ways and reasons why people move and that can contribute to the orientation of specific transport planning policies.
The most important feature of the field of study with respect to its influence on the mobility trends, is the urban configuration of the AMBA and the location of its main polar attractors. In this sense, the CABA can be intuitively
pointed as the most important magnet of the urban region, where most of the trips made by the inhabitant all around the metropolitan area are directed. This is due to the great concentration of activity in the city and, conversely, to the strong residential vocation that characterizes many other municipalities that surround it. Most of the data available and presented in this research, with reference to the mobility trends, have been obtained from the analysis of two main enquiries: INTRUPUBA, 2007 and ENMODO, 2010. ITRUPUBA Enquiry on public urban transport of Buenos Aires (Investigaciòn de Transporte Urbano Publico de Buenos Aires) was realized by the National Secretary of transport (Secretarìa de Transporte de la Naciòn) between 2006 and 2007 and it is the first massive collection of data related to the use of the different public transportation modes. The scope of the enquire embraces 27 municipalities of the metropolitan region and the CABA. Generally, it can be observed that the selection of the municipalities can be related to the extension of the urban realm. The enquiry analyses modal share, time of travel, purposes, number of interchanges and a socioeconomic profile of the users. The main results obtained by the enquiry show that the most used mean of transport is, by far, the bus that is used for the 75% of the trips in the region. This is due to its diffusion, especially in the several areas in which no rails or subways are present. Another interesting result is the fact that most of the trips (43%) are originated
all directions inner CABA AMBA to CABA inner AMBA all directions inner CABA AMBA to CABA inner AMBA Bus Bus 39% 18% 24% 38% 15% 28% 51% 18% 18% 36% 19% 31% 46% 20% 10% 44% 19% 12% 16% 52% 14% 20% 44% 24% 12%
Trips for working reasons Trips for all reasons
Train Subway Taxi,Remis Charter
Bus Car Train Walking Subway Cycling Taxi | Remis Moto Charter Others
and destinated in the province (so to say, not entering in the CABA) and only 22% of them is between the province and the CABA. The rest of the trips (35%) is totally comprised into the CABA. Most of the trips are hold between 07.00 and 10.00 in the morning and 17.00 and 19.00 in the evening. They are mainly for working reasons (67%). Finally, an interesting socio demographic perspective is given: by dividing the population in 7 categories of socio economic level (considering income, job and education) it emerges that people pertaining to the highest (6-7) and lowest levels (1-2) are the lower users of the public transportation system. The main users are from the levels 4 (lower medium) and 5 (medium standard).
The second enquiry, called ENMODO, (household mobility enquiry or Encuesta de Movilidad Domiciliaria), is the main source of the data related to mobility that has been used to complete the operative part of this research. It is the most updated enquiry about mobility patterns in the urban region of Buenos Aires. It was made by Secretarìa de Transporte de la Naciòn between 2009 and 2010. It was conducted on 22.500 surveys made at household level. The aim is to provide a full overview of the mobility trends, by including also private means (car, motorcycles, bicycles, walking etc.) that were not considered by INTRUPUBA. As for the previous enquiry, ENMODO considers not just the modal share of the several means
of transportation, but also the time of travel, interchanges and socio demographic features of the travelers. The completeness of the data set is not homogeneous, because it is frequent that, for the most peripheric municipalities, only few information is available.
The results of the enquiry highlight, in accordance with the trends already observed by INTRUPUBA, that public bus is by far the most used mean of transport when considering all the displacements at the regional level. This is probably due to the extension of the network which reaches also the most peripherical spots of the territory. The use of car, displacements by walking and the use of train are also relevant but with a magnitude that is not comparable to the one of the public bus. Among the general regional trends, for the scope of this research it is interesting to observe that there are three main sets of relations. The first is related to the inner CABA displacements. The carried-out analysis shows that the role of the subway is quite secondary and that most of the trips inside the city are still made by bus. This is peculiar, because this is the only part of the metropolitan region where an underground rapid transit system is present. The weakness that can be at the base of its low use is related to the radial structure of the network: all the lines, except for line C and the new line H, are running along the main axis that connects radially the city center with the outskirts of the CABA. This configuration generates a strong use of the subway to reach
the city center while it diminishes considerably for concentric displacements between more peripheral neighborhoods.
Something similar seems to happen regarding the use of train, that is low, even if the CABA is served by 41 stations along the main suburban lines that departs from the terminus located all around the city core. The scarce use of the train can be imputed to two factors. The first is related to the radial structure of the rail system, which can’t support effectively concentric movements. This is the same issue that characterizes the subway network: all the major rail lines are departing from the city center and proceed radially towards the province. Concentric internal connection can
be made only by using the subway (when close to the city center) or by using bus. The second reason is related to the congested and poorly designed interchange spots that make trans board between different means of transport complex and uncomfortable.
The second set of relations that is relevant to be considered are the displacements between the municipalities of the province and the CABA. They represent the 40% of the total daily trips and are mainly made using the bus and, in a lower extent, the train. The peculiar urban structure of the region seems to help this type of displacements, because the infrastructure that define the main radial corridors theoretically allow to move quickly Fig. 4:
Daily trips between municipalities 1000 - 10.000 10.001 - 20.000 20.000 - 50.000 50.001 - 100.000 100.001 - 300.000 300.001 +
from the outskirts of the region to the city center and vice versa. In particular, the means that may be more reliable for these kinds of suburban displacements is the train as it is demonstrated by the fact that it is highly used in comparison with other sets of relations. Finally, the trips that are made between municipalities of the province without entering into the CABA, are briefly described in their trends. Every day around 12 million of trips are made in the peri urban region. 3 million are made between municipalities and 9 million are inner-municipal trips. The trend that can be observed is peculiar, because the number of trips made by walking is particularly high, in direct competition with the one of the bus. This can be explained by the fact that inner trips are considered and they are likely to be made on smaller distances, using private means such as bikes or motos. Moreover, even if the bus network is extended, its quality is inhomogeneous and a trip by bus may be not preferable in localities that are poorly served by the network.
In conclusion, it can be said that the metropolitan region is strongly dependent on its bus network and that the mass rapid transit lines are able to answer only to a limited demand. Even if their number is pretty relevant, the displacements along the corridors are just a percentage of a higher amount of more diffused and differently oriented movements that create a chaotic net of metropolitan relations. While moving between places
that are close or well connected to the radial infrastructural system may be easier, the same can’t be said for movements that follow different paths. This different degree of accessibility is at the same time one of the causes and one of the effects of the strong issue of social segregation that affects the Metropolitan Region of Buenos Aires.
Plans
for the future
Official strategies and transport
projects
Introduction
In this section, it is described the way in which decisions related to mobility and land use are taken in Argentina. The aim is to understand which is the distribution of decisional competencies across the several administrative levels and which is the legal framework that supports it. This description is necessary to introduce the authorities that are involved in policy making related to land use, transport provision and management. Moreover, it is useful to legally frame the most important strategic planning tools that are deeply analysed at the end of the chapter. There are two relevant strategic spatial plans, one produced by the Province of Buenos Aires and one from the CABA, in which are expressed the main guidelines for the future development of the Metropolitan Region of Buenos Aires. The plans, that are characterized by a strategic perspective, have no direct legal impact on the land property configuration but represent a framework that should be addressed in order to orient
more specific planning actions towards a “sustainable” territorial development.
A deeper look on these plans is necessary in order to understand how authorities assess weaknesses and strengths of the mobility system and which are the main policies that are proposed to deal with the main problems that emerge from the official analysis.
At the end of this chapter a brief overview on the main ongoing projects related to the improvement of the public transportation system is presented to understand which are the main strategies that have been concretely developed.
Legal framework: transport and land use planning in Argentina
At the top of the legal framework is the National Constitution which represents the supreme law throughout the whole national territory. In turn, according to the art.123 of the national constitution, each province dictates its own constitution and its own provincial laws,