CHAPTER 4
Determination of the acid dissociation constants of the ligands in the presence of surfactant.
The hydrogen ion concentration in water (bulk solution) generally differs from the value on the micelle surface. For instance, in the presence of SDS micelles, the negatively charged surface will attract protons resulting in an increase in the proton concentration at the surface with a consequent decrease in the pH. Hartley and Roe (1940) showed that the surface pHs is related to the bulk pHw, at 25 °C, by the following equation:
pHs − pHw = Ψ⁄ 59.2 (4.1)
where Ψ is the surface potential of the micelle in mV. The high surface potential of the SDS micelle (~ 120 mV) leads to a decrease in the local pH at the surface which, according to equation 4.1, is equivalent to about two units. This result shows that [H+]s/[H+]w ≈ 100, i.e. the proton concentration on the micelle surface is one hundred times higher than in water. On the contrary, for a cationic surfactant (such as DTAC) the repulsion towards the positive hydrogen ions makes the pH on the micelle surface higher with respect to the bulk solution pH.
The pKA of a ligand which is located on the micelle surface is also shifted. Actually, the major influence on the pKA shift is attributed to the increased proton concentration close to the micelle surface, rather than an effect on the intrinsic pKA of the ligand, arising from the change in environment (James and Robinson, 1978). Again following Hartley and Roe (1940), at 25°C the surface pKA, (pKA)s, is related to the bulk pKA, (pKA)w, by equation 4.2 :
(pKA)s − (pKA)w = Ψ⁄ 59.2 (4.2)
Hence, the (pKA)s values of the ligands used in the present studies (HQ and PADA) have been measured in the presence of SDS or DTAC.
4.1 pKA of 8-HQ
The ligand 8-hydroxyquinoline, here employed to complex and extract Ga(III), is a weak acid with two protonation sites: the quinoline nitrogen and the hydroxylic group. The hydrogen ion equilibria of 8-HQ can be represented as follows :
KA1 H+ H+ KA2 OH O -H OH N H2L+ HL L -N N
Figure 4.1 Protonation equilibria of 8-HQ.
The acid dissociation constants of 8-HQ in the presence of SDS have been measured in this thesis for the first time. The same values of pKA have been measured in pure water solution, (pKA)w in order to determine the term Ψ⁄ 59.2 which should be employed to evaluate the hydrogen ion concentration on the micellar surface occurring to equation (4.1).
4.1.1 Determination of pKA of 8-HQ in water Determination of pKA1
The pKA1 of 8-HQ in water has been evaluated by means of spectrophotometric titrations. In particular it has been indirectly measured by exploiting the protonic exchange reaction between 8-HQ and acetic acid (HA):
8-HQ + HA 8-H2Q+ + A- (4.3) The equilibrium constant of the reaction (4.3) is:
1 2 ] [ ] [ ] [ ] [ A HA K K HA HQ A Q H K = × × = + − (4.4)
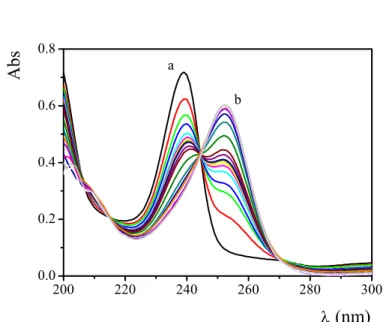
where KHA and KA1 are respectively the acid dissociation constant of the acetic acid and 8-HQ. Known amounts of [HCl] = 1×10⁻² M (I = 0.2 M (NaClO4)) were added by a microsyringe to a cuvette already positioned in the cell holder of the spectrophotometer and containing a known volume of [HQ]=2×10⁻⁵M and [CH3COONa]=1×10⁻³M, I = 0.2 M (NaClO4). Figure 4.2 shows the spectra of 8-HQ recorded in the pH range 8
÷
2.7 during a titration.200 225 250 275 300 0.0 0.2 0.4 0.6 0.8 b a Ab s λ (nm)
Figure 4.2 Absorption spectra of 8-HQ at different pH, CHQ=2x10⁻⁵M, CCH3COONa=1×10⁻³M, I=0.2M (NaClO4), T=25°C. a) pH= 8 the peak, due to the neutral ligand, is centered at 239 nm. b) pH= 2.7, the peak, due to the protonated ligand (H2Q+), is centered at 251 nm.
] [ ] [ 1 1 HA A K Abs CHQ − × ∆ + ∆ = ∆
ε
ε
(4.5)where CHQ is the analytical concentration of 8-HQ, ∆Abs = Abs-
ε
HQCHQ, ∆ε =ε
H2Q-ε
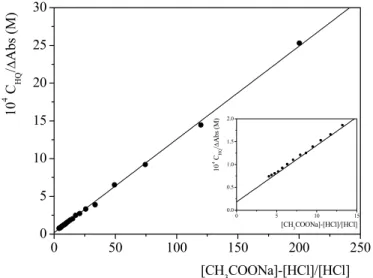
HQ and K is the equilibrium constant of reaction (4.3).Figure 4.3 shows the typical trend of a spectrophotometric titration analyzed by equation (4.5). 0 50 100 150 200 250 0 5 10 15 20 25 30 0 5 10 15 0.0 0.5 1.0 1.5 2.0 10 4 C HQ / ∆ Ab s ( M ) [CH3COONa]-[HCl]/[HCl] 10 4 C HQ / ∆ Abs ( M ) [CH3COONa]-[HCl]/[HCl]
Figure 4.3 Analysis of a spectrophotometric titration for the determination of pKA1 of 8-HQ. CHQ= 2×10⁻⁵M, CCH3COONa = 1×10⁻³M, I= 0.1M (NaClO4), λ= 251 nm, T=25°C. Insert shows an allargment of the plot in the vicinity of the intercept.
The parameters derived from slope and intercept of the straight line in figure 4.3 were :
K = 1.5 ± 0.4
The value of pKHA at I = 0.2 M and T = 25 °C, equal to (4.51 ± 0.02), has been calculated from the literature value at I = 0 M and T = 25 °C, (pKHA = 4.76 ± 0.02) (Martell and Smith, 1977) by using equation (4.6):
COOH CH H COO CH I I
f
f
f
K
K
3 3 2 . 0 0=
=×
−×
+ = (4.6)the activity coefficients were obtained by Davies equation (Davies, 1962)
⎥ ⎦ ⎤ ⎢ ⎣ ⎡ × − + × × = − ( ) 1 log 2 B I I I Z A fi i (4.7)
where A = 0.509, B = 0.3, Zi is the charge of the ion (i) and I the ionic strength (i.e, I = 0.2 M).
Introducing the value of K and KHA in equation (4.4) a pKA1 value of 4.68 ± 0.14 has been obtained, which is in good agreement with the literature value pKA1 = 4.88 (Irving et al., 1949).
Determination of pKA2
The evaluation of pKA2 of 8-HQ in water has been performed similarly to pKA1 by adding known amounts of NaOH 0.1 M at I = 0.2 M (NaClO4) to 2ml of [HQ]=2×10⁻⁵M, I = 0.2 M (NaClO4). Figure 4.4 shows the spectra of 8-HQ recorded in the pH range 8
÷
12.7 during a titration.In this case the dissociation acid constant, KA2, has been determined exploiting the hydrolysis reaction
8-HQ + OH- 8-Q- + H2O (4.8)
W A K K OH HQ Q K 2 ] [ ] [ ] [ = × = − − (4.9) 200 220 240 260 280 300 0.0 0.2 0.4 0.6 0.8 b a Ab s λ (nm)
Figure 4.4 Absorption spectra of 8-HQ at various pH, CHQ=2x10⁻⁵M, I=0.2M (NaClO4), T=25°C. a) pH= 8 the peak, due to the neutral ligand, is centered at 239 nm. b) pH= 12.7, the peak, due to the deprotonated ligand (Q-), is centered at 251 nm.
where KW is the ionic product of water. The equilibrium constant, K, of reaction (4.8) has been obtained from equation 4.10 (Appendix II) by using the absorption data recorded at 239 nm: ] [ 1 1 1 − × ∆ × + ∆ = ∆Abs K OH CHQ
ε
ε
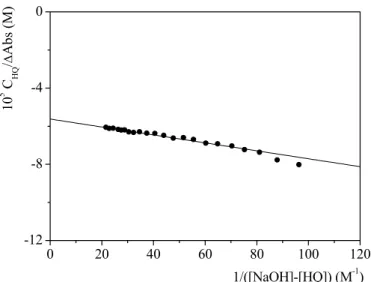
(4.10)where CHQ is the analytical concentration of 8-HQ , ∆Abs = Abs-εHQCHQ, ∆ε = εHQ -εQ and K is the equilibrium constant of reaction (4.3). The trend of a typical spectrophotometric titration analyzed by equation (4.10) is shown in Figure 4.5. The parameters so obtained are:
K = (2.7 ± 0.1) × 102 M-1
0 20 40 60 80 100 120 -12 -8 -4 0 10 5 C HQ / ∆ Ab s ( M ) 1/([NaOH]-[HQ]) (M-1)
Figure 4.5 Analysis of a spectrophotometric titration for the determination of pKA2 of 8-HQ. CHQ= 2×10⁻⁵M, I= 0.2M (NaClO4), λ= 239 nm, T=25°C
Introducing the value of K and KW (KW = 1.8 ×10⁻¹⁴ M2, I = 0.2 M, T=25°C) in equation (4.9) and assuming an error of 0.02 in pKw one obtains KA2 = (4.9 ± 0.3) ×10-12 M corresponding to pKA2 = 11.31 ± 0.03, which is one order of magnitude lower than the literature value 4.2 ×10⁻¹¹ (Stone and Friedman, 1947).
4.1.2 Determination of pKA of sodium dihydrogen phosphate in SDS
The acid dissociation constant (KA) of sodium dihydrogen phosphate has been determined by means of potentiometric titrations, which have been performed by adding, from a microsyringe, increasing volumes of NaOH 0.2 M to 20 ml of NaH2PO4 (2 × 10⁻² M) containing SDS. The solution pH was measured during the titration by using a glass electrode.
Two titrations have been done at different SDS concentration, 0.02 M and 0.04 M. Figure 4.6 A represents the potentiometric curve obtained with SDS 0.02 M, whose first derivative (figure 4.6B) allows to find the equivalent point as the maximum of the curve (1.992 ml NaOH 0.2 M).
Figure 4.6 A)Potentiometric titration curve of NaH2PO4; CNaH2PO4 = 2×10⁻²M, CNaOH = 0.2 M, CSDS= 0.02 M. B) First derivative of curve A; the volume of NaOH corresponding to the peak represents the volume of NaOH (1.992 ml) at the equivalent point of the titration.
The pKA value is equal to the pH corresponding to the volume at the half-equivalence point, that is where half the amount of base has been added to reach the equivalent point. The pH corresponding to 1.992/2 ml NAOH (half equivalent point) was 6.95 ± 0.02, i.e the pKA of NaH2PO4 at SDS 0.02M is 6.95 ± 0.02. In the presence of SDS 0.04 M, pKA resulted to be 6.78 ± 0.02.
It is to be noted that the pKA of NaH2PO4 is only slightly affected by the presence of SDS (Table 4.1).
Table 4.1 Acid dissociation constant of sodium dihydrogen phosphate at different SDS concentrations, T = 25°C. SDS (M) pKA (H2PO4 - ↔ HPO42- + H+) 0 7.2a 0.02 6.95 ± 0.02 0.04 6.78 ± 0.02
afrom literature (Guggenheim and Prue, 1955)
0.0 0.5 1.0 1.5 2.0 2.5 0 5 10 15 20 dpH/dml NaOH (ml) B 0.0 0.5 1.0 1.5 2.0 2.5 6 9 12 pH NaOH (ml) A
4.1.3 Determination of pKA of 8-HQ in the presence of SDS Determination of pKA1
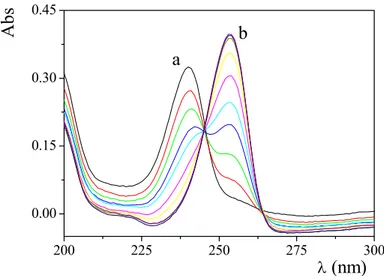
The pKA1 of 8-HQ in SDS has been evaluated by means of spectrophotometric titrations. Known amounts of [HCl] = 1×10⁻² M with SDS 0.02M were added through a microsyringe to a cuvette containing 2 ml of [HQ] = 1×10⁻⁵M, [Na2HPO4] = 1×10⁻²M and [SDS] = 0.02M. Differently from the measure in water, phosphate buffer has been employed in order to buffer the solution between pH 6 and 7. Titrations have been done at different SDS concentrations, 0.02 M and 0.04 M. Figure 4.7 shows the spectra recorded at SDS 0.02 M in the pH range range 4.7
÷
10.8. 200 225 250 275 300 0.00 0.15 0.30 0.45 b a Ab s λ (nm)Figure 4.7 Absorption spectra of 8-HQ in SDS at different pH, CHQ = 1x10⁻⁵ M, CNa2HPO4a = 1×10⁻² M, SDS 0.02 M, T = 25°C. a) pH = 10.8 the peak, due to the neutral ligand, is centered at 240 nm. b) pH = 4.7, the peak, due to the protonated ligand (H2Q+), is centered at 253 nm.
The acid dissociation costant, KA1, has been determined indirectly by exploiting the protonic exchange reaction between HQ and dihydrogen phosphate:
1 4 2 A PO H Na K K K = (4.12)
and equation (4.5) turns into equation (4.13):
] [ ] [ 1 1 4 2 2 4 − − × ∆ + ∆ = ∆ H PO HPO K Abs CHQ
ε
ε
(4.13)where CHQ is the analytical concentration of 8-HQ, ∆Abs = Abs-
ε
HQCHQ, ∆ε =ε
H2Q-ε
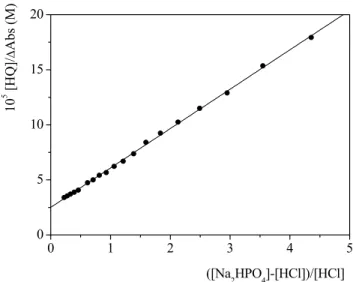
HQ and K is the equilibrium constant of reaction (4.11).Figure 4.8 shows the analysis of titration data according to equation (4.13) at SDS 0.02 M. 0 1 2 3 4 5 0 5 10 15 20 10 5 [H Q] / ∆ Ab s (M) ([Na2HPO4]-[HCl])/[HCl]
Figure 4.8 Analysis of a spectrophotometric titration for the determination of pKA1 of 8-HQ in SDS
0.02 M. CHQ= 1× 10⁻⁵ M, CNa2HPO4= 1× 10⁻³ M, λ= 251 nm, T=25°C .
The parameters obtained at SDS 0.02 M are: K = (7.0 ± 0.2) × 10-1
Using the pKA of NaH2PO4 in SDS 0.02 M (pKNaH2PO4 = 6.95 ± 0.02), experimentally
determined in this thesis (section 4.1.2), from equation 4.12 we obtained KA1 = (1.60 ± 0.11)×10-7 M corresponding to pKA1 = 6.80 ± 0.03, in SDS 0.02 M.
In the presence of SDS 0.04 M, applying the procedure described for SDS 0.02 M and using K = (9.9 ± 0.1)×10-1, ∆ε = (3.8 ± 0.1)×104 M-1 cm-1and using pKNaH2PO4 = 6.78 ± 0.02 measured in SDS 0.04 M (section 4.1.2), one sets pKA1 = 6.77 ± 0.02.
Determination of pKA2
The determination of pKA2 of 8-HQ in the presence of SDS has been performed as in water with the difference that the initial solution of HQ and NaOH contained equal concentration of SDS. Titrations have been done at SDS 0.02 M and 0.04 M. Figure 4.9 shows the spectra recorded at SDS 0.04 M in the pH range 9.8
÷
13.8.200 220 240 260 280 300 0.0 0.1 0.2 0.3 0.4 b a Ab s λ (nm)
Figure 4.9 Absorption spectra of 8-HQ in SDS 0.04M at different pH, CHQ = 1x10⁻⁵ M, T = 25°C. a) pH = 9.8 the peak, due to the neutral ligand, is centered at 240 nm. b) pH = 13.8, the peak, due to the deprotonated ligand (Q-), is centered at 250 nm.
The typical trend of a spectrophotometric titration analyzed by equation (4.10) is shown in Figure 4.10.
0 50 100 150 200 250 -2.0 -1.5 -1.0 -0.5 0.0 10 4 [HQ ]/ ∆ Ab s ( M ) 1/([NaOH]-[HQ]) (M-1)
Figure 4.10 Analysis of a spectrophotometric titration for the determination of pKA2 of 8-HQ in
SDS 0.04 M by using equation (4.10) . CHQ= 1× 10⁻⁵ M, , λ= 240 nm, T=25°C.
The parameters so obtained at SDS 0.04 M are: K = (1.6± 0.1) × 102
∆ε = (1.74 ± 0.02) × 104 M-1cm-1
The equilibrium constant KA2 has been obtained, as described in section 4.1.1 using equations (4.9) and (4.10). The value of KW = 1.45×10⁻¹⁴ M2 (I = 0.04 M, T = 25°C) has been used to find KA2 = (2.31 ± 0.18)×10-12 M corresponding to pKA2 = 11.64 ± 0.03 in SDS 0.04 M.
In the presence of SDS 0.02 M we found K = (1.84 ± 0.02)×102 and ∆ε = (1.93 ± 0.03)×104 M-1 cm-1. The pKA2 at SDS 0.02 M obtained using KW = 1.30×10⁻¹⁴ M2 (I = 0.02 M, T = 25°C) is reported in Table 4.2 together with the value measured in the other experimental conditions.
Table 4.2 shows that going from water (i.e [SDS] = 0 M) to SDS solutions, as expected the pKA1 has a shift of about 2 unit. Moreover the surfactant concentration, provided it’s above the CMC, doesn’t affect the pKA1 value. On the contrary the pKA2 value doesn’t substantially change on going from water to micellar solution.
Table 4.2 Acid dissociation constants of 8-HQ at different SDS concentration, T = 25°C. [SDS]a = 0 M [SDS] = 0.02 M [SDS] = 0.04 M pKA1 4.68 ± 0.14 6.80 ± 0.03 6.77 ± 0.02 pKA2 11.31 ± 0.03 11.62 ± 0.02 11.64 ± 0.03 aI = 0.2 M (NaClO4) 4.2 pKA of PADA
The bidentate ligand pyridine-2azo-p–dimethylaniline (PADA) is a weak acid with two protonation sites: the pyridine nitrogen and the aniline nitrogen. The hydrogen ion equilibria of PADA can be represented as follows :
N N N N(CH3)2 H+ H+ H+ N N N N(CH3)2 H+ H+ N N N N(CH3)2 KA2 KA1
The doubly charged PADA is reported to dissociate with pKA1 value of 2.0 and pKA2 of 4.5 measured in water (James and Robinson, 1978; Klotz and Loh Ming, 1953). Therefore at pH above pH 6.0, the ligand is entirely in the neutral (unprotonated) form. In micellar SDS solution the pKA2 is shifted to a value of 6.5 (Monteleone et al., 2004; James and Robinson, 1978). In that case the ligand will be essentially neutral above a measured pH value of 8.0.
In connection with cadmium extraction, we used the published data about the pKA2 of PADA in SDS. On the other hand, the pKA’s of PADA in the presence of the cationic DTAC have been experimentally measured in this PhD thesis work. 4.2.1 Determination of pKA of PADA in the presence of DTAC
The acid dissociation constants of PADAH+ and PADAH22+ in DTAC micellar solution were determined by spectrophotometric titration at 25 0C. Known amounts of HCl solution were added to the cuvette containing a known amount of PADA initially at pH = 5.
Measurements were carried out at a DTAC concentration of 0.04 mol dm-3, higher than the CMC. Since it has been previously observed that the surfactant concentration, provided it is above the CMC, scarcely affects the pKA value (section 4.1.3), measurements at different DTAC concentrations have not been investigated. Figure 4.12 shows some of the spectra recorded during titration.
The absorbance values at 560 nm, where only PADAH+ absorbs, were analyzed according to equation 4.14 (Appendix III):
2 1 1 2 1 ] [ ] [ ] [ A A A A HL L H K H K K H K C Abs + + = + ε + + (4.14)
where CL is the total ligand concentration, εHL is the extinction coefficient of PADAH+, KA1 and KA2 are the dissociation constants in DTAC of PADA respectively. A non linear least-square procedure was employed to analyze the experimental data according to equation 4.14. The agreement between
experimental and calculated data is shown in Figure 4.13. The resulting acid dissociation constants are KA1 = (3.0 ± 0.1) × 10-2 Mand KA2 = (2.6 ± 0.1) × 10-3 M.
400 500 600 0.0 0.1 0.2 0.3 Abs λ (nm) c a b
Figure 4.12. UV-vis spectra of PADA (5×10⁻⁶ mol dm-3 ) recorded in DTAC 0.04 mol dm-3 micellar solution at different pH values (pH = 5÷0.3 from bottom to top at 560 nm). a) pH = 0.3, corresponding to H2L++, b) black line, pH = 5 corresponding to L, c) pH = 2 corresponding to HL+ with small contribuition from H2L++and HL+.
0.0 0.1 0.2 0.3 0.4 0.5 0.0 1.0 2.0 3.0 4.0 10 - 4 Ab s/ C L (M -1 ) [HCl] (M)
Figure 4.13 Analysis of the titration of PADA with HCl, according to equation 4.14. The continuous line represents the calculated trend.
Comparison of the pKA values in water and DTAC solution (Table 4.3) reveals that the pKA2 on the DTAC micelles is lower by a factor of about 2 compared to water, while the pKA1 is lower by a factor of 0.5.
Table 4.3 Acid dissociation constants of PADA in water and DTAC 0.04 M, T = 25°C.
Watera [DTAC] = 0.04 M
pKA1 2.0 1.52 ± 0.01
pKA2 4.5 2.59 ± 0.02
aliterature data (Klotz and Ming, 1953; James and Robinson, 1978; Monteleone et al., 2004)
Looking at Figure 4.14 one can assert that in DTAC solution the neutral form of the ligand largely prevails above 4.5.
0 2 4 pH 0 20 40 60 80 100 % formation relative to L L LH LH2
Figure 4.14 Distribution of the species of PADA with pH according to the pK value in DTAC shown in Table 4.3.