APPENDIX B: “ON TRANSIENT LEVEL QUALIFICATION”:
QUALITATIVE AND QUANTITATIVE ACCURACY
EVALUATION TO PSB-VVER POST TEST ANALYSES
PERFORMED IN THE FRAMWORK OF THE TACIS 30303
PROJECT
B.1 Qualitative accuracy evaluation
This Appendix is related to the results obtained by the application of the qualitative accuracy
evaluation based on the RTA in the framework of the TACIS 30303 Project. In these tables the
calculations performed with CATHARE2 and RELAP5 codes are summarized.
The qualitative accuracy evaluation is based on upon a systematic procedure consisting in the
identification of phenomena and of the RTA. In this Appendix the results derived by the
application of the qualitative accuracy evaluation, described in section 7.3.2 are compared. Two
tables have been carried out:
•
Tab. B - 1 and Tab. B - 2 compare the judgments derived by the visual observation of the
parameters characterizing the RTA of the post test analyses by CATHRE2 code;
•
Tab. B - 3 and Tab. B - 4 make possible the same comparison for the post test analyses by
RELAP5 code.
The analysis does not consider the qualitative accuracy evaluation performed for the natural
circulation test, the test 10 of the Project.
The RTA considered for this comparison are: PRZ behavior, SG secondary side behavior, mass
distribution in primary side, the saturated and the sub-cooled blow-down, the dry-out
occurrences, the loop seal behavior and the passive and active ECCS interventions
(hydro-accumulators, HPIS, LPIS and MAKE-UP systems).
The considerations on the comparative analysis are summarized hereafter.
•
The judgments on pressurizer behavior are generally excellent or reasonable in all
transients in the CATHARE2 and in RELAP5 simulations. This is not observable for the
number of PORV opening in the high pressure transient (i.e. LOFW) that results always
more than in the experiment. This difference has been explained with the difficulties to
simulate correct behavior of the heat losses.
•
The analysis of the steam generator behavior is also often “minimum” in the number of the
BRU-A valves opening and closure during the high pressure transient (both codes).
Moreover also a general faster pressure increase is observed. This has been judged
generally reasonable or minimum, and it has been explained with the effect of the heat
losses, the simulation of the condensation in the main steam line upstream the valve
simulating the turbine steam valve in the facility.
•
The primary mass distribution has been judged correctly simulated in almost all transients
for CATHARE2 code: the only “minimum” has been given to the test N.5 (performed
with the nodalization having the once through schematization of the SG secondary side).
The RELAP5 code performances shows also two “minimum” (tests N. 11 and 12).
Ph. D. Thesis in Nuclear Safety - XIX Cycle
Alessandro Del Nevo
- January 2007 -
Page 244 of 258
•
The sub-cooled blow-down phase is well predicted in all post test analyses by both codes
(RELAP5 and CATHARE2).
•
The judgments on saturated blow-down are generally positive: the “minimum” has been
given on the primary to secondary pressure reversal occurrence. This has been explained
with the longer coupling between the primary and the secondary side, due to the heat
exchange in SG. It has been associated in particular to the MCP heat losses effect and to
the imperfect knowledge of their behavior.
•
The dryout have been correctly predicted by the code, even if it should be noted that the
timing of the occurrence of this phenomenon was generally anticipated. This occurred in
particular in the post test of the experiment N. 11 and 12 conducted with RELAP5 code.
•
The occurrence of the loop seal clearance has been reasonable predicted by the codes. In
particular, the main difference was the prediction of the loop where the clearance
occurred.
•
The judgments of the passive ECCS, the hydro-accumulators, were affected by the primary
side pressure trends, and they shows that the behavior was not always well predicted by
the codes.
•
The active ECCS (HPIS, LPIS and MAKE-UP systems are also affected by the primary
pressure, and considering the data in the tables, the CATHARE2 simulations seem in
better agreement than the RELAP5 post test analysis form from the point of view of these
RTA.
UNIT T#1 T#2 T#3 T#4 T#5 T#6 T#7 T#8 T#9 T#11 T#12
RTA: Pressurizer behavioremptying time* s -- R R E E -- -- E R E R
scram time s E E R E E -- E E R E E
heaters switched off s E R E E R -- -- -- E -- -- TSE
time of first automatic PRZ opening s M E E -- -- -- E -- -- -- -- NDP N. of PRZ automatic opening and closure -- M R -- -- -- -- M -- -- -- -- SVP PRZ minimum level m -- -- M -- -- -- -- -- -- -- --
RTA: Steam generators secondary side behavior
time of actuation of AFW/EFW s M R -- - E E E -- -- -- --- main steam line valve closure s M R -- E R E R E R E E time of first automatic SG opening s R R -- -- R M -- R -- -- TSE
SG level below 0.1m s E E -- -- -- -- M -- -- -- -- diff. between PS and SS pressure at 100 s MPa R R -- E E E R R -- E --
SG level m E E-R -- E E E-M E-R E E-R E, E
SVP
SG pressure MPa E-R E-M -- R E-R E-R R E-R M-R E-R E NDP N. of SG automatic opening and closure -- M M -- -- E R M -- -- -- E-R
RTA: Mass distribution in primary side
TSE time of minimum mass occurrence s -- E -- E E -- -- R -- E R minimum primary side mass kg -- E -- E E -- -- E -- E E loop seal diff. pressure at time of minimum
mass for each loop kPa -- E-R -- E-R M -- -- R -- R R residual mass in primary system kg -- E -- E E-R -- E E E av. linear power at min. mass kW/m -- E -- E -- -- -- R -- -- -- SVP
minimum mass/ITF volume kg/m3 -- R -- E E -- -- E -- R E RTA: Subcooled blowdown
upper plenum in sat. conditions s -- -- -- E R -- -- E R E E time when PS pressure / initial press. = 0.8 s -- -- -- E R -- -- E R E E TSE
onset of break two phase flow s -- -- -- -- -- -- -- - -- -- -- IPA break flow up to 30 s kg -- -- -- R -- -- -- R -- E E
RTA: Saturated blowdown
TSE time when PS pressure / intial press. = 0.1 s -- -- -- E E -- -- --- E -- -- time of PS to SS pressure reversal s -- -- -- R -- -- -- M M R R IPA integrated break flow for relevant intervals kg -- -- -- E -- -- -- E -- E R integrated break flow at relevant conditions kg -- -- -- E-R -- -- -- E -- E-R E
RTA: First dryout occurrence
time of dry out s -- -- -- E -- -- -- -- -- E E time of PCT s -- -- -- E -- -- -- -- -- E E dryout duration s -- -- -- R -- -- -- -- -- R R range of dry out occurrence at various core
levels s -- -- -- -- -- -- -- -- -- -- --
TSE
time of core recovering s -- -- -- E -- -- -- -- -- E E minimum core collapsed level m -- -- -- -- -- -- -- -- -- -- -- core pressure drop at time of dry out kPa -- -- -- R -- -- -- -- -- R R peak cladding temperature °C -- -- -- R -- -- -- -- -- E E average linear power kW/m -- -- -- E -- -- -- -- -- E E SVP
core power / PS mass kW/kg -- -- -- E -- -- -- -- -- E E NDP PS mass / initial mass (onset of dryout) % -- -- -- E -- -- -- -- -- E E
RTA: Final dryout occurrence
TSE time of dry out s -- -- -- R -- -- -- E -- E R
time of PCT s -- -- -- E -- -- -- E -- E R
dryout duration s -- -- -- M -- -- -- E -- R R range of dry out occurrence at various core
levels s -- -- -- R -- -- -- R -- R R
time of core recovering s -- -- -- R -- -- -- E -- E R SVP minimum core collapsed level m -- -- -- -- -- -- -- - -- -- -- core pressure drop at time of dry out kPa -- -- -- R -- -- -- E -- E R peak cladding temperature °C -- -- -- R -- -- -- R -- R R average linear power at time of dry out kW/m -- -- -- E -- -- -- E -- -- -- rate of rod temperature increase °C/s -- -- -- M -- -- -- R -- M R core power / PS mass kW/kg -- -- -- E -- -- -- E -- E R NDP PS mass / initial mass (onset of dryout) % -- -- -- E -- -- -- E -- E R
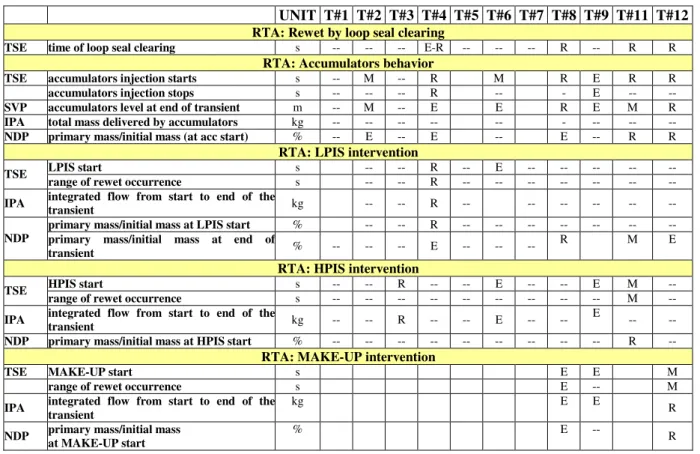
RTA: Rewet by loop seal clearing
TSE time of loop seal clearing s -- -- -- E -- -- -- E-R -- E-R E-R
Tab. B - 1. PSB-VVER post test analyses by CATHARE2/v1.5b (reference results): summary
Ph. D. Thesis in Nuclear Safety - XIX Cycle
Alessandro Del Nevo
- January 2007 -
Page 246 of 258
UNIT T#1 T#2 T#3 T#4 T#5 T#6 T#7 T#8 T#9 T#11 T#12
RTA: Accumulators behavioraccumulators injection starts s -- R -- E -- R -- R R E E TSE
accumulators injection stops s -- -- -- E -- -- -- - E -- -- SVP accumulators level at end of transient m -- R -- R -- R -- R E M M IPA total mass delivered by accumulators kg -- -- -- -- -- -- -- --- -- -- -- NDP primary mass/initial mass (at acc start) % -- E -- E -- -- -- E -- E R
RTA: LPIS intervention
LPIS start s -- -- -- E -- E -- -- -- -- --
TSE
range of rewet occurrence s -- -- -- E -- -- -- -- -- -- IPA integrated flow from start to end of the
transient kg -- -- -- R -- -- -- -- -- M --
primary mass/initial mass at LPIS start % -- -- -- R -- -- -- -- -- E -- NDP primary mass/initial mass at end of
transient % -- -- -- E -- -- -- -- R M E
RTA: HPIS intervention
HPIS start s -- -- R E -- E -- -- R E --
TSE
range of rewet occurrence s -- -- -- E -- -- -- -- -- E -- IPA integrated flow from start to end of the
transient kg -- -- E R -- E -- --
E
E -- NDP primary mass/initial mass at HPIS start % -- -- -- R -- -- -- -- -- E --
RTA: MAKE-UP intervention
MAKE-UP start s -- -- -- -- -- -- -- E E -- E TSE
range of rewet occurrence s -- -- -- -- -- -- -- R -- -- E IPA integrated flow from start to end of the
transient
kg
-- -- -- -- -- -- -- E E -- E NDP primary mass/initial mass
at MAKE-UP start
%
-- -- -- -- -- -- -- E -- -- E
Tab. B - 2. PSB-VVER post test analyses by CATHARE2/v1.5b (reference results): summary
UNIT T#1 T#2 T#3 T#4 T#5 T#6 T#7 T#8 T#9 T#11 T#12
RTA: Pressurizer behavioremptying time* s -- M R R R -- -- R R R E
scram time s E E E R E -- E R E E E
heaters switched off s -- M -- M E -- -- -- R -- -- TSE
time of first automatic PRZ opening s M R E -- -- -- R -- -- -- -- NDP N. of PRZ automatic opening and closure -- R E -- -- -- -- R -- -- -- -- SVP PRZ minimum level m -- -- R -- -- -- -- -- -- -- --
RTA: Steam generators secondary side behavior
TSE time of actuation of AFW/EFW s M M -- - R E E -- E -- -- main steam line valve closure s R R -- E R E R R E E E time of first automatic SG opening s R R -- -- -- M M -- E -- -- SG level below 0.1m S R R -- -- -- M E -- -- -- -- SVP diff. between PS and SS pressure at 100 s MPa R R -- R E -R R M R M R R SG level m E-R E-R -- E E-R E-R E-R E E-R E E SG pressure MPa E R -- E-R E-R R-M E E-R E- M E-R E-R NDP N. of SG automatic opening and closure -- M M -- -- M M M -- -- -- --
RTA: Mass distribution in primary side
TSE time of minimum mass occurrence s -- R -- R R -- -- R -- M M minimum primary side mass kg -- E -- R R -- -- E -- R R loop seal differential pressure at time of
minimum mass for each loop kPa -- E-R -- R M -- -- R -- R R residual mass in primary system
- when PS pressure/initial pressure =0.7 - when PS pressure/initial pressure =0.5
kg -- E -- E-R E -- -- E-R -- E-R E-R av. linear power at min. mass kW/m -- E -- E -- -- -- R -- -- -- SVP
minimum mass/ITF volume kg/m3 -- E -- R R -- -- E -- R R RTA: Subcooled blowdown
upper plenum in sat. conditions s -- -- -- E R -- -- E R E E time when PS pressure / initial press. = 0.8 s -- -- -- R R -- -- R E R R TSE
onset of break two phase flow s -- -- -- -- -- -- -- --- -- -- -- IPA break flow up to 30 s kg -- -- -- E -- -- -- R -- E E
RTA: Saturated blowdown
TSE time when PS pressure / intial press. = 0.1 s -- -- -- R M -- -- --- E -- -- time of PS to SS pressure reversal s -- -- -- E -- -- -- M E R R SVP break flow relevant instant kg/s -- -- -- -- -- -- -- -- -- -- -- IPA integrated break flow for relevant intervals kg -- -- -- E -- -- -- E -- E R integrated break flow at relevant conditions kg -- -- -- E-R -- -- -- E-R -- E-R E-R
RTA: First dryout occurrence
time of dry out s -- -- -- -- -- -- -- -- -- R R time of PCT s -- -- -- -- -- -- -- -- -- R R dryout duration s -- -- -- -- -- -- -- -- -- M M range of dry out occurrence at various core
levels s -- -- -- -- -- -- -- -- -- -- --
TSE
time of core recovering s -- -- -- -- -- -- -- -- -- R R SVP minimum core collapsed level m -- -- -- -- -- -- -- -- -- -- -- core pressure drop at time of dry out kPa -- -- -- -- -- -- -- -- -- R R peak cladding temperature °C -- -- -- -- -- -- -- -- -- R R average linear power kW/m -- -- -- -- -- -- -- -- -- E E core power / PS mass kW/kg -- -- -- -- -- -- -- -- -- R R NDP PS mass / initial mass (onset of dryout) % -- -- -- -- -- -- -- -- -- R R
RTA: Final dryout occurrence
TSE time of dry out s -- -- -- R -- -- -- E -- M M
time of PCT s -- -- -- R -- -- -- E -- M M
dryout duration s -- -- -- R -- -- -- E -- R R range of dry out occurrence at various core
levels s -- -- -- R -- -- -- R -- M M
time of core recovering s -- -- -- R -- -- -- E -- M M SVP minimum core collapsed level m -- -- -- -- -- -- -- - -- -- -- core pressure drop at time of dry out kPa -- -- -- M -- -- -- R -- M M peak cladding temperature °C -- -- -- E -- -- -- E -- R R average linear power at time of dry out kW/m -- -- -- E -- -- -- E -- -- -- rate of rod temperature increase °C/s -- -- -- E -- -- -- E -- R M core power / PS mass kW/kg -- -- -- R -- -- -- R -- R R NDP PS mass / initial mass (onset of dryout) % -- -- -- R -- -- -- E -- R R
Tab. B - 3. PSB-VVER post test analyses by RELAP5/Mod3.3 (reference results): summary
of results obtained by application of the qualitative evaluation (part 1 of 2).
Ph. D. Thesis in Nuclear Safety - XIX Cycle
Alessandro Del Nevo
- January 2007 -
Page 248 of 258
UNIT T#1 T#2 T#3 T#4 T#5 T#6 T#7 T#8 T#9 T#11 T#12
RTA: Rewet by loop seal clearingTSE time of loop seal clearing s -- -- -- E-R -- -- -- R -- R R RTA: Accumulators behavior
TSE accumulators injection starts s -- M -- R M R E R R accumulators injection stops s -- -- -- R -- - E -- -- SVP accumulators level at end of transient m -- M -- E E R E M R IPA total mass delivered by accumulators kg -- -- -- -- -- - -- -- -- NDP primary mass/initial mass (at acc start) % -- E -- E -- E -- R R
RTA: LPIS intervention
LPIS start s -- -- R -- E -- -- -- -- --
TSE
range of rewet occurrence s -- -- R -- -- -- -- -- -- -- IPA integrated flow from start to end of the
transient kg -- -- R -- -- -- -- -- --
primary mass/initial mass at LPIS start % -- -- R -- -- -- -- -- -- -- NDP primary mass/initial mass at end of
transient % -- -- -- E -- -- --
R M E
RTA: HPIS intervention
HPIS start s -- -- R -- -- E -- -- E M --
TSE
range of rewet occurrence s -- -- -- -- -- -- -- -- -- M -- IPA integrated flow from start to end of the
transient kg -- -- R -- -- E -- --
E
-- -- NDP primary mass/initial mass at HPIS start % -- -- -- -- -- -- -- -- -- R --
RTA: MAKE-UP intervention
TSE MAKE-UP start s E E M
range of rewet occurrence s E -- M
IPA integrated flow from start to end of the transient
kg E E
R NDP primary mass/initial mass
at MAKE-UP start
% E -- R
Tab. B - 4. PSB-VVER post test analyses by RELAP5/Mod3.3 (reference results): summary
of results obtained by application of the qualitative evaluation (part 2 of 2).
B.2 Quantitative accuracy evaluation (Fast Fourier Transform Based
Method)
This comparative analysis is based on the special procedure has been developed at University of
Pisa. The procedure is based on the use of the Fast Fourier Transform. This tool gives an
accuracy coefficient (AA) and a weighted frequency (WF) for each variable. Roughly the value
assumed by AA means the error in the calculation of the considered variable. The WF factor
gives information if the calculated discrepancies, between the measured and calculated trends,
are more important at low frequencies (small value of WF) or high frequencies (large value of
WF). In this last case the discrepancies come from various kinds of noise and so it is less
important.
Here the results obtained by the application of this method for each transient has been
summarized and analyzed. The analysis has been focused on the average accuracy evaluation.
•
The results of the FFT-BM applied to the post test analyses performed by CATHARE2 and
RELAP5, taking into account the results of the improved results of the test N. 2 (as
described in the final report of the TACIS 30303 Project) are reported in Tab. B - 5 and
Tab. B - 6. The colored column distinguishes the CATHARE2 results that have been
performed, improving the SG model (schematization of the downcomer) of the secondary
side. Furthermore the red cells highlight the results that do not fulfill the threshold limits
(primary pressure and overall). The yellow cells identified the results slightly outside the
limits. 27 parameters have been selected as significant for the assessment of the accuracy
of the post tests analysis. Between them, the method has been applied selecting the most
relevant (in number between 20-25) compatibly with the availability in the experimental
or calculated database. The summary includes 12 post test calculation of the TM not
including the 3 additional experiments (N: 13, 14 and 15).
•
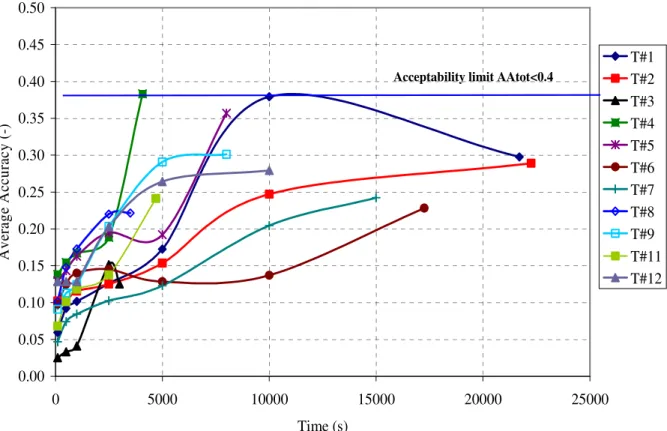
From Fig. B - 1 to Fig. B - 7 the results of the accuracy evaluation has been showed for
different time interval (from 0 to 500, 1000, 2500, 5000, 10000 and end of transient). The
test N. 10, the natural circulation, has been evaluated only for two relevant time interval:
the drainage phase (about 22000 seconds), in Fig. B - 5, and all transient (drainage and
refilling phases). The applications involve all the post test calculation including:
RELAP5/Mod3.3,
CATHARE2/V1.5B,
CATHARE2/V1.3L,
KORSAR/V1.1,
ATHLET/Mod2 Cycle A. In each figure the threshold limits are always reported. Fig. B -
6 highlights, finally, the results putting in evidence the type of the transient (i.e. low
pressure – SBLOCA, hot header break, SGTR - ; high pressure – LOFW and SBO - ; NC)
•
• From Fig. B - 8 to Fig. B - 11 report the trends of the FFT-BM vs. time for primary
pressure and overall transient for RELAP5 and CATHARE2 codes.
The results of this analysis are summarized as follows:
•
4 of 12 primary accuracy evaluations are above the threshold limit for CATHARE2 code;
•
4 of 12 primary accuracy evaluations are above the threshold limit for CATHARE2 code
and other 2 are slightly above;
•
1 of 12 overall accuracy evaluation is slightly above the limit: this is the post test analysis
of NC experiments;
•
the results above the limits are all related to the high pressure experiments characterized by
the cycling of the PORV valve;
Ph. D. Thesis in Nuclear Safety - XIX Cycle
Alessandro Del Nevo
- January 2007 -
Page 250 of 258
•
considering the time window of 100s, 3 results are above the threshold for the primary
pressure
•
considering the time window of 500s, 5 results are above the threshold for the primary
pressure (only one was already outside the limit after 100s)
•
considering the time window of 1000s, 7 results are above the threshold for the primary
pressure
•
considering the time window of 100s, 3 results are above the threshold for the primary
pressure, between them 4 are LOFW events.
•
considering the time window of 2500s, 4 results are above the threshold for the primary
pressure and 2 above the overall results.
•
considering the time window of 5000s, 6 results are above the threshold for the primary
pressure.
•
considering the time window of 10000s, almost all the primary pressure accuracy
evaluation are above the threshold limit: all these tests are LOFW, SBO and NC. No
overall accuracy evaluation overpasses the limit
•
In Fig. B - 8 and Fig. B - 10, it is highlighted that the accuracy decreases fast when in the
high pressure transient the cycling of the onset of the PORV valve.
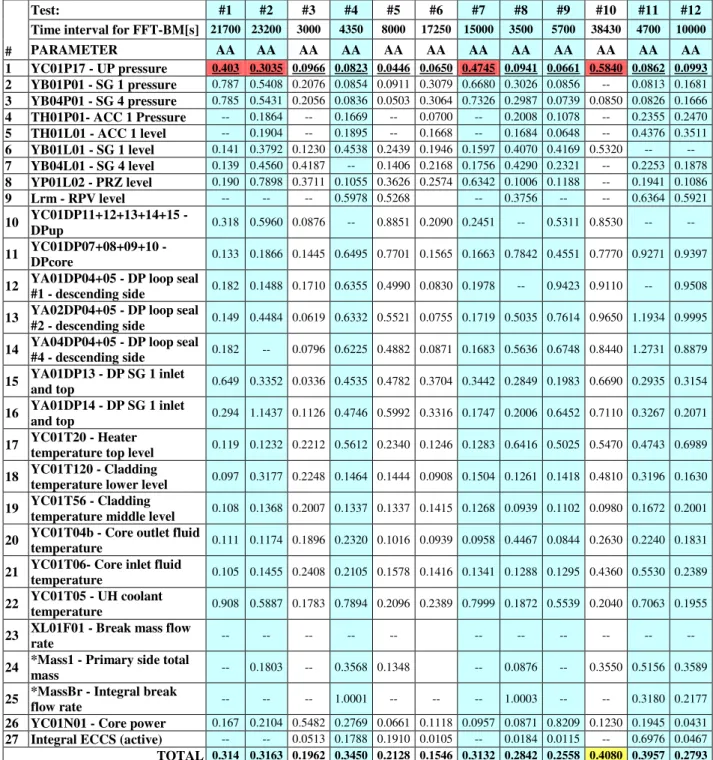
Test: #1 #2 #3 #4 #5 #6 #7 #8 #9 #10 #11 #12 Time interval for FFT-BM[s] 21700 23200 3000 4350 8000 17250 15000 3500 5700 38430 4700 10000
# PARAMETER AA AA AA AA AA AA AA AA AA AA AA AA 1 YC01P17 - UP pressure 0.403 0.3035 0.0966 0.0823 0.0446 0.0650 0.4745 0.0941 0.0661 0.5840 0.0862 0.0993 2 YB01P01 - SG 1 pressure 0.787 0.5408 0.2076 0.0854 0.0911 0.3079 0.6680 0.3026 0.0856 -- 0.0813 0.1681 3 YB04P01 - SG 4 pressure 0.785 0.5431 0.2056 0.0836 0.0503 0.3064 0.7326 0.2987 0.0739 0.0850 0.0826 0.1666 4 TH01P01- ACC 1 Pressure -- 0.1864 -- 0.1669 -- 0.0700 -- 0.2008 0.1078 -- 0.2355 0.2470 5 TH01L01 - ACC 1 level -- 0.1904 -- 0.1895 -- 0.1668 -- 0.1684 0.0648 -- 0.4376 0.3511 6 YB01L01 - SG 1 level 0.141 0.3792 0.1230 0.4538 0.2439 0.1946 0.1597 0.4070 0.4169 0.5320 -- -- 7 YB04L01 - SG 4 level 0.139 0.4560 0.4187 -- 0.1406 0.2168 0.1756 0.4290 0.2321 -- 0.2253 0.1878 8 YP01L02 - PRZ level 0.190 0.7898 0.3711 0.1055 0.3626 0.2574 0.6342 0.1006 0.1188 -- 0.1941 0.1086 9 Lrm - RPV level -- -- -- 0.5978 0.5268 -- 0.3756 -- -- 0.6364 0.5921 10 YC01DP11+12+13+14+15 - DPup 0.318 0.5960 0.0876 -- 0.8851 0.2090 0.2451 -- 0.5311 0.8530 -- -- 11 YC01DP07+08+09+10 - DPcore 0.133 0.1866 0.1445 0.6495 0.7701 0.1565 0.1663 0.7842 0.4551 0.7770 0.9271 0.9397 12 YA01DP04+05 - DP loop seal
#1 - descending side 0.182 0.1488 0.1710 0.6355 0.4990 0.0830 0.1978 -- 0.9423 0.9110 -- 0.9508 13 YA02DP04+05 - DP loop seal
#2 - descending side 0.149 0.4484 0.0619 0.6332 0.5521 0.0755 0.1719 0.5035 0.7614 0.9650 1.1934 0.9995 14 YA04DP04+05 - DP loop seal
#4 - descending side 0.182 -- 0.0796 0.6225 0.4882 0.0871 0.1683 0.5636 0.6748 0.8440 1.2731 0.8879 15 YA01DP13 - DP SG 1 inlet and top 0.649 0.3352 0.0336 0.4535 0.4782 0.3704 0.3442 0.2849 0.1983 0.6690 0.2935 0.3154 16 YA01DP14 - DP SG 1 inlet and top 0.294 1.1437 0.1126 0.4746 0.5992 0.3316 0.1747 0.2006 0.6452 0.7110 0.3267 0.2071 17 YC01T20 - Heater
temperature top level 0.119 0.1232 0.2212 0.5612 0.2340 0.1246 0.1283 0.6416 0.5025 0.5470 0.4743 0.6989 18 YC01T120 - Cladding
temperature lower level 0.097 0.3177 0.2248 0.1464 0.1444 0.0908 0.1504 0.1261 0.1418 0.4810 0.3196 0.1630 19 YC01T56 - Cladding
temperature middle level 0.108 0.1368 0.2007 0.1337 0.1337 0.1415 0.1268 0.0939 0.1102 0.0980 0.1672 0.2001 20 YC01T04b - Core outlet fluid
temperature 0.111 0.1174 0.1896 0.2320 0.1016 0.0939 0.0958 0.4467 0.0844 0.2630 0.2240 0.1831 21 YC01T06- Core inlet fluid
temperature 0.105 0.1455 0.2408 0.2105 0.1578 0.1416 0.1341 0.1288 0.1295 0.4360 0.5530 0.2389 22 YC01T05 - UH coolant
temperature 0.908 0.5887 0.1783 0.7894 0.2096 0.2389 0.7999 0.1872 0.5539 0.2040 0.7063 0.1955 23 XL01F01 - Break mass flow
rate -- -- -- -- -- -- -- -- -- -- --
24 *Mass1 - Primary side total
mass -- 0.1803 -- 0.3568 0.1348 -- 0.0876 -- 0.3550 0.5156 0.3589 25 *MassBr - Integral break
flow rate -- -- -- 1.0001 -- -- -- 1.0003 -- -- 0.3180 0.2177 26 YC01N01 - Core power 0.167 0.2104 0.5482 0.2769 0.0661 0.1118 0.0957 0.0871 0.8209 0.1230 0.1945 0.0431 27 Integral ECCS (active) -- -- 0.0513 0.1788 0.1910 0.0105 -- 0.0184 0.0115 -- 0.6976 0.0467 TOTAL 0.314 0.3163 0.1962 0.3450 0.2128 0.1546 0.3132 0.2842 0.2558 0.4080 0.3957 0.2793
Tab. B - 5. PSB-VVER post test analyses by CATHARE2/v1.5b (reference results): summary
of results obtained by application of FFT to the experiments.
Ph. D. Thesis in Nuclear Safety - XIX Cycle
Alessandro Del Nevo
- January 2007 -
Page 252 of 258
Test: #1 #2 #3 #4 #5 #6 #7 #8 #9 #10 #11 #12 Time interval FFT-BM[s] 21700 22250 3000 4075 8000 17250 15000 3500 5700 39900 4750 9990 # PARAMETER AA AA AA AA AA AA AA AA AA AA AA AA 1 YC01P17 - UP pressure 0.3561 0.2606 0.0664 0.1338 0.0594 0.1062 0.3884 0.0999 0.0445 0.7170 0.1027 0.0893 2 YB01P01 - SG 1 pressure 0.7734 0.6171 0.2089 0.2140 0.1314 0.3140 0.4735 0.2899 0.0548 -- 0.2640 0.2568 3 YB04P01 - SG 4 pressure 0.7709 0.7552 0.2066 0.2159 0.0615 0.3142 0.6277 0.2861 0.0731 0.0920 0.2690 0.2583 4 TH01P01- ACC 1 Pressure -- 0.1831 -- 0.1404 -- 0.0527 -- 0.1364 0.0394 -- 0.1864 0.1453 5 TH01L01 - ACC 1 level -- 0.2487 -- 0.2073 -- 0.0454 -- 0.1381 0.0888 -- 0.3312 0.1607 6 YB01L01 - SG 1 level 0.1812 0.2888 0.1103 0.4806 0.4039 0.2873 0.1540 0.3200 0.3939 0.4490 -- -- 7 YB04L01 - SG 4 level 0.1868 0.1774 0.0884 -- 0.2233 0.1788 0.1567 0.3262 0.3393 -- 0.1890 0.2027 8 YP01L02 - PRZ level 0.8172 0.8990 0.1411 0.1907 0.7997 0.1796 0.2570 0.1308 0.1106 -- 0.1406 0.1511 9 Lrm - RPV level -- -- -- -- 0.8802 -- -- -- -- -- -- 10 YC01DP11+12+13+14+15 – Dpup 1.3620 0.7585 0.0921 0.9993 0.8916 0.4900 0.1280 -- 0.4972 0.8200 -- 0.6101 11 YC01DP07+08+09+10 - DPcore 0.2119 0.1973 0.1068 0.9728 0.9407 0.5826 0.2032 0.5238 0.9739 0.6550 0.8101 1.0652 12 YA01DP04+05 - DP loop
seal #1 - descending side 0.2168 0.1532 0.0258 1.0962 0.9216 1.2456 0.1933 -- 2.7010 0.8210 0.9131 0.8479 13 YA02DP04+05 - DP loop
seal #2 - descending side 0.2060 0.4245 0.0332 -- 0.8344 1.2818 0.1799 0.5028 1.3577 0.4140 0.8184 0.6318 14 YA04DP04+05 - DP loop
seal #4 - descending side 0.2044 -- 0.0972 0.8779 1.4183 1.2797 0.1962 0.3350 1.1786 0.7470 0.6402 0.6899 15 YA01DP13 - DP SG 1 inlet
and top 0.7981 0.3852 0.0536 1.1661 1.3895 0.7780 0.4526 0.2298 0.2038 0.5660 0.2387 0.2501 16 YA01DP14 - DP SG 1 inlet
and top 0.4467 0.9882 0.0630 1.3924 0.2220 0.4463 0.1771 0.2923 0.6330 0.4990 0.8580 1.1572 17 YC01T20 - Heater
temperature top level 0.1178 0.0899 0.0840 0.6630 0.2261 0.1474 0.1665 0.5062 0.4945 0.7420 0.3659 0.3099 18 YC01T120 - Cladding
temperature lower level 0.1305 0.3881 0.1288 0.2052 0.1823 0.0825 0.1719 0.0714 0.1368 0.1530 0.1707 0.1024 19 YC01T56 - Cladding
temperature middle level 0.1226 0.0820 0.0954 0.1666 0.1194 0.1272 0.1585 0.1601 0.0983 0.1070 0.1369 0.1280 20 YC01T04b - Core outlet
fluid temperature 0.0975 0.1024 0.1260 0.1751 0.2659 0.1233 0.1162 0.4381 0.0623 0.2570 0.1075 0.1022 21 YC01T06- Core inlet fluid
temperature 0.1252 0.1206 0.1823 0.2648 0.0729 0.1427 0.1522 0.0782 0.2023 0.3580 0.1034 0.1795 22 YC01T05 - UH coolant
temperature 0.3070 0.2634 0.1017 0.3197 1.3639 0.1791 0.3387 0.0899 0.5893 0.1420 0.1337 0.1212 23 XL01F01 - Break mass flow
rate -- -- -- -- -- -- -- -- -- -- --
24 *Mass1 - Primary side total
mass -- 0.2988 -- 0.6548 0.8813 -- 0.1498 -- -- 0.3976 0.3129 25 *MassBr - Integral break
flow rate -- -- -- 0.5041 -- -- -- 0.3287 -- -- 0.2650 0.1868 26 YC01N01 - Core power 0.2305 0.2883 0.4086 0.2917 0.2488 0.1391 0.2048 0.2534 0.2162 0.1080 0.2255 0.1480 27 Integral ECCS (active) -- -- 0.1170 0.7191 0.7086 0.0210 -- 0.0099 0.0217 -- -- 0.1058 TOTAL 0.2978 0.2891 0.1253 0.3833 0.3570 0.2282 0.2423 0.2214 0.3012 0.3640 0.2413 0.2283
Tab. B - 6. PSB-VVER post test analyses by RELAP5/Mod3.3 (reference results): summary
of results obtained by application of FFT to the experiments.
0.00 0.05 0.10 0.15 0.20 0.25 0.30 0.35 0.40
Test#1 Test#2 Test#3 Test#4 Test#5 Test#6 Test#7 Test#8 Test#9 Test#10 Test#11 Test#12
A v er ag e A cc u ra cy ( -) R5 - Primary Pressure R5 - Total C2 - Primary Pressure C2 - Total A1 - Primary Pressure A1 - Total K - Primary Pressure K - Total
R5 (T2-imp) - Primary Pressure R5 (T2-imp) -Total
Acceptability limit AAtot<0.4
Acceptability limit AAp<0.1
100 sec.
Fig. B - 1. PSB-VVER post test analyses: summary of results obtained by application of FFT
by RELAP5, CATHARE2, ATHLET and KORSAR – first 100s.
0.00 0.05 0.10 0.15 0.20 0.25 0.30 0.35 0.40
Test#1 Test#2 Test#3 Test#4 Test#5 Test#6 Test#7 Test#8 Test#9 Test#10 Test#11 Test#12
A v er ag e A cc u ra cy ( -) R5 - Primary Pressure R5 - Total C2 - Primary Pressure C2 - Total A1 - Primary Pressure A1 - Total K - Primary Pressure K - Total
R5 (T2-imp) - Primary Pressure R5 (T2-imp) - Total
Acceptability limit AAtot<0.4
Acceptability limit AAp<0.1
500 sec.
Fig. B - 2. PSB-VVER post test analyses: summary of results obtained by application of FFT
by RELAP5, CATHARE2, ATHLET and KORSAR – first 500s.
Ph. D. Thesis in Nuclear Safety - XIX Cycle
Alessandro Del Nevo
- January 2007 -
Page 254 of 258
0.00 0.05 0.10 0.15 0.20 0.25 0.30 0.35 0.40
Test#1 Test#2 Test#3 Test#4 Test#5 Test#6 Test#7 Test#8 Test#9 Test#10 Test#11 Test#12
A v er ag e A cc u ra cy ( -) R5 - Primary Pressure R5 - Total C2 - Primary Pressure C2 - Total A1 - Primary Pressure A1 - Total K - Primary Pressure K - Total
R5 (T2-imp) - Primary Pressure R5 (T2-imp) - Total
Acceptability limit AAtot<0.4
Acceptability limit AAp<0.1
1000 sec.
Fig. B - 3. PSB-VVER post test analyses: summary of results obtained by application of FFT
by RELAP5, CATHARE2, ATHLET and KORSAR – first 1000s.
0.00 0.10 0.20 0.30 0.40 0.50 0.60
Test#1 Test#2 Test#3 Test#4 Test#5 Test#6 Test#7 Test#8 Test#9 Test#10 Test#11 Test#12
A v er ag e A cc u ra cy ( -)
R5 - Primary Pressure
R5 - Total
C2 - Primary Pressure
C2 - Total
A1 - Primary Pressure
A1 - Total
K - Primary Pressure
K - Total
R5 (T2-imp) - Primary Pressure
R5 (T2-imp) - Total
Acceptability limit AAtot<0.4
Acceptability limit
2500 sec.
Fig. B - 4. PSB-VVER post test analyses: summary of results obtained by application of FFT
by RELAP5, CATHARE2, ATHLET and KORSAR – first 2500s.
0.00 0.05 0.10 0.15 0.20 0.25 0.30 0.35 0.40
Test#1 Test#2 Test#3 Test#4 Test#5 Test#6 Test#7 Test#8 Test#9 Test#10 Test#11 Test#12
A v er ag e A cc u ra cy ( -)
R5 - Primary Pressure
R5 - Total
C2 - Primary Pressure
C2 - Total
A1 - Primary Pressure
A1 - Total
R5 (T2-imp) - Primary Pressure
R5 (T2-imp) - Total
Acceptability limit AAtot<0.4
Acceptability limit AAp<0.1
5000 sec.
Fig. B - 5. PSB-VVER post test analyses: summary of results obtained by application of FFT
by RELAP5, CATHARE2, ATHLET and KORSAR – first 5000s.
0.00 0.05 0.10 0.15 0.20 0.25 0.30 0.35 0.40 0.45 0.50
Test#1 Test#2 Test#3 Test#4 Test#5 Test#6 Test#7 Test#8 Test#9 Test#10 Test#11 Test#12
A v er ag e A cc u ra cy ( -) R5 - Primary Pressure R5 - Total C2 - Primary Pressure C2 - Total C2v13L - Primary Pressure C2v13L - Total A1 - Primary Pressure A1 - Total
R5 (T2-imp) - Primary Pressure R5 - Total
Acceptability limit AAtot<0.4
Acceptability limit AAp<0.1
10000 sec.
Fig. B - 6. PSB-VVER post test analyses: summary of results obtained by application of FFT
by RELAP5, CATHARE2, ATHLET and KORSAR – first 10000s.
Ph. D. Thesis in Nuclear Safety - XIX Cycle
Alessandro Del Nevo
- January 2007 -
Page 256 of 258
0.00 0.10 0.20 0.30 0.40 0.50 0.60 0.70 0.80 0.90 1.00 Test# 1 Test# 2 Test# 3 Test# 4 Test# 5 Test# 6 Test# 7 Test# 8 Test# 9 Test #10 Test #11 Test #12 Test #13 Test #14 Test #15 A v er ag e A cc u ra cy ( -) R5 - Primary Pressure R5 - Total C2 - Primary Pressure C2 - Total
R5 (Imp-BIC) - Primary Pressure R5 (Imp-BIC) - Total C2v13L - Primary Pressure C2v13L - Total A1 - Primary Pressure A1 - Total K - Primary Pressure K - Total Acceptability limit
Acceptability limit AAp<0.1
HIGH-PRESS
HIGH-PRESS LOW-PRESS LOW-PRESS NC LOW-PRESS
HIGH-PRESS LOW-HIGH-PRESS