3. FUSION CROSS-SECTION MEASUREMENT
In this chapter the experimental setups and techniques used to measure the fusion cross section for the 6,7Li+64Zn systems will be described. Since one of the experimental goals is to extend the energy range well below the coulomb barrier, the technique used to measure the fusion cross-section is the activation method briefly described in paragraph 1.4. This technique avoids problems of energy thresholds in the direct detection of the ERs but presents its own difficulties that will be described and tackled in this chapter.
The experiment consists of three parts: the activation of the targets; the offline activity curve measurement of the activated targets and finally the analysis of such activity curves in order to extract the fusion cross-sections. The two experimental setups used for both the activation and the activity curve measurements will be described in this chapter.
3.1 Activation: experimental setup
The activation method consists in collecting the ERs produced by the collisions in the target and in the catcher next to the target itself in order to measure their quantity by measuring their own activity. Necessary condition in order to measure the fusion cross-section is that the ERs are unstable nuclei decaying by emission of a detectable radiation. A preliminary calculation by the statistical model shows that for the
6,7Li+64Zn systems of present interest most of the produced ERs decay by electron
capture. Their presence can be therefore measured detecting the characteristic atomic X-rays of the daughter nuclei following the electron capture decay. In table 3.1 [78] are shown all the possible ERs that could be found in the stack, according to statistical model predictions and following the decay chain of produced elements.
70As and 71As are the respective compound nuclei of the 6Li+64Zn and 7Li+64Zn
complete fusion. The isotopes marked in red have a too short half-life and cannot be detected after the time necessary to open the chamber and place the stack in front of the Si-Li drifted detector. Their contribute is not lost because the respective daughter nuclei still decay by electron capture and have larger half-lives (yellow, green and blue marked isotopes).
The activation step of the measure has been performed in the CT2000 scattering chamber at LNS with the 6Li and 7Li beams delivered by the SMP Tandem Van de
Graaff accelerator. The experimental setup is sketched in fig. 3.1 and it is the same for the measurements of both systems.
For each of the bombarding energies it has been prepared a thick target called “stack” formed by a thin 64Zn target and a thick catcher foil. At the highest energies the catcher foil is made of niobium and both the catcher and the 64Zn target have been obtained by a rolling procedure.
TABLE 3.1
The possible ERs that can be found in the stack. 70As and 71As are the respective compound nuclei of the 6Li+64Zn and 7Li+64Zn complete fusion. The isotopes marked in red have short
half-but their contribute is not lost because the respective daughter nuclei still decay by electron capture and have larger half-lives (yellow, green and blue marked isotopes).
67As 42.5” 68As 2.53’ 69As 15.23’ 70As 52.6’ 71As 65.28h 65Ge 30.9” 66Ge 2.26h 67Ge 18.9’ 68Ge 271d 69Ge 39.05h 70Ge stable 71Ge 11.43d 60Ga < 1” 62Ga < 1” 63Ga 32.4” 64Ga 2.63’ 65Ga 15.2’ 66Ga 9.49h 67Ga 3.26d 68Ga 67.71’ 69Ga stable 71Ga stable 59Zn < 1” 60Zn 2.38’ 61Zn 1.49” 62Zn 9.26h 63Zn 38.5’ 64Zn stable 65Zn 243d 66Zn stable 67Zn stable 68Zn stable 59Cu 1.35’ 60Cu 23.7’ 61Cu 3.33h 62Cu 9.67” 63Cu stable 64Cu 12.7h 65Cu stable 59Ni >100y 60Ni stable 61Ni stable 62Ni stable 64Ni stable
Fig. 3.1: Sketch of the experimental setup for the activation
procedure. The beam passes through a thin Au foil in order to perform the Rutherford scattering. A thick catcher follows the 64Zn target in order to block the
recoiling ER.
To reduce the beam energy indetermination due to the energy loss in the target at the lowest energies the 64Zn layer has been reduced in thickness and it has been
evaporated on a gold catcher. The energy loss at lower energies is important because a little variation in the bombarding energy where the energy dependence of the fusion cross-section is steep introduces a large error in the measured data.
The target and the catcher thicknesses have been chosen by performing a calculation of the produced ERs range in the target and catcher materials in order to completely stop all of them. The target and the catcher thicknesses have been measured by energy loss of 5.48 MeV alpha-particles. The used stacks are listed in table 3.2. In the reaction chamber the stack-holder has been placed over a rotating plate to allow the stack-holder removal from the beam line to focus the beam on the Faraday cup. During the activation the plate is in the central position and the stack-holder is along the beam line. In the stack-holder, beside the stack, is placed a beam stopper in order to prevent the scattered particles emerging from the stack to be detected by monitors.
TABLE 3.2
Summary of the target stacks used in the activation step
Beam Energy [MeV] 64Zn thickness [μg/cm2] Catcher element Catcher thickness [μg/cm2] 6Li 9 200 Au 560 6Li 11 240 Au 560 6Li 13 245 Au 550 6Li 15 265 Ho 3170 6Li 17.5 620 Nb 680 6Li 20 580 Nb 700 6Li 24 550 Nb 685 6Li 31 370 Nb 2420 6Li 40 550 Nb 2400 7Li 10.14 255 Ho 3090 7Li 11.2 250 Ho 3140 7Li 13.2 265 Ho 3100 7Li 15.2 275 Ho 3260 7Li 20.3 380 Nb 2330 7Li 24.3 397 Nb 2290 7Li 31.4 370 Nb 2420
As it will be shown in the next chapter, to extract the production cross section it is necessary to measure the beam current as a function of time for the entire duration of the activation step. This operation has been performed using two silicon detector monitors collecting the particles scattered by a thin gold foil placed before the stack
extracted. At the center of the chamber has been placed a multiple target holder vertically movable. At three different positions on the holder have been placed: an empty frame for beam focusing, a graduated fluorescent target in order to precisely center the beam spot using a camera and a 229 μg/cm2 thick Au foil for the Rutherford scattering during the activation procedure. The scattered particles have been detected by two 1000 μm thick silicon detectors symmetrically placed at 30° with respect to the beam line and at a distance of 87 cm from the Au foil. In front of each monitor detector has been placed a ϕ = 7 mm collimator. With the two symmetrical monitors it is possible to reduce systematic errors due to mechanical misalignments. The extraction of the beam current profile over the time is important especially in the case of ERs with a half-life little than or comparable to the duration of the activation step. In fact, at the end of the activation, the total amount of short-lived elements is the result of the competition between the formation of new ERs by the fusion process and their decay during the activation step.
The beam has been defined by the combination of a circular collimator with a diameter of ϕ = 3.5 mm and a rectangular aperture of 4×4 mm2. This rectangular aperture has been realized by a system of slits located 156 cm upstream the target. The circular collimator has been placed 4.9 cm upstream the Au thin foil. A ϕ = 6.8 mm anti-scattering collimator has been placed at 19 mm upstream the Au thin foil.
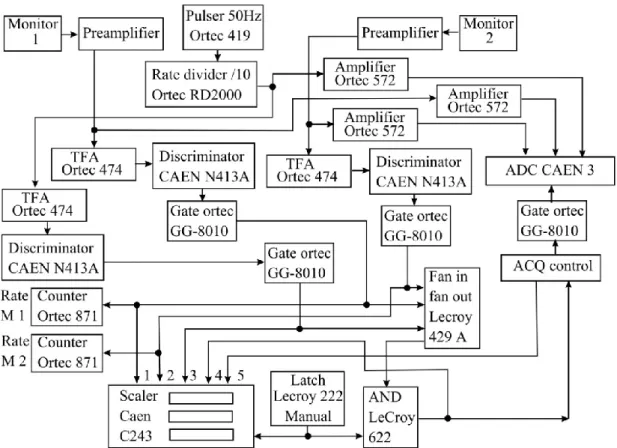
The acquisition electronic chain is sketched in fig. 3.2. The signals from the monitors have been treated by charge preamplifiers then shaped and amplified by Ortec 572 amplifiers. The Ortec 474 timing amplifiers provided a timing signal for each channel. The two timing signals have been discriminated and a total OR of the outputs has been built to give the valid event signal. Two counters have been used to check the beam intensity by the scattered particles detected by monitors. In order to provide a relation with the elapsed time a pulser with 50Hz frequency has been acquired. During the long activations the pulser frequency has been divided by a factor 10. A scaler has been used to check the acquisition dead time by the difference between the total number of valid events (5) and the acquired ones (6). The scaler has been furthermore used to count all the events from the pulser (1,4) and the monitors (2,3). The manual latch has been used to start and stop the acquisition and the scaler at the same time.
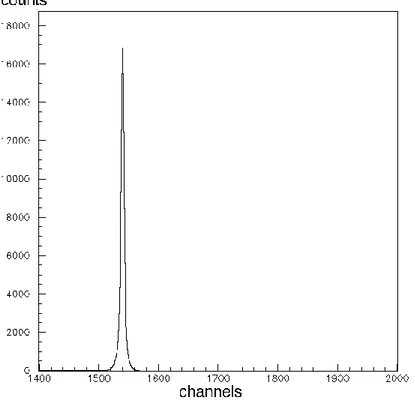
In order to obtain a good statistics especially at low energies, where the fusion cross-section is expected to be small, the beam has been optimized and the lower was the bombarding energy the longer was the activation run duration. The activation step durations are summarized in table 3.3. In figure 3.2.1 is shown a sample spectrum from a monitor at the end of the activation run.
Fig 3.2: The electronic chain used to process and acquire the signals from the
detectors. In the scaler: 1) monitor 1; 2) monitor 2; 3) pulser; 4) valid events; 5) acquired events. See the text for details.
Fig. 3.2.1: A sample spectra in the monitor detector. The Rutherford
scattered particles are, in this spectrum, integrated for the entire activation run.
TABLE 3.3
Summary of the activation runs performed. The bombarding energy and the approximate run duration are listed.
Beam Energy [MeV] Run approximate duration
6Li 9 2d 15h 6Li 11 19h 30’ 6Li 13 10h 6Li 15 3h 6Li 17.5 1h 30’ 6Li 20 1h 30’ 6Li 24 1h 6Li 31 1h 6Li 40 1h 7Li 10.14 1d 3h 7Li 11.2 9h 7Li 13.2 3h 7Li 15.2 2h 7Li 20.3 1h 30’ 7Li 24.3 1h 7Li 31.4 1h
3.2 Activity measurement: experimental setup
In order to measure the activity of a few KeV X-ray source like the activated stack, detectors with a large active layer are needed in order to maximize the probability for the photoelectric absorption of X-rays. The Si-Li drifted detectors are suitable for this purpose thanks to their thick depletion layers that are from 5mm to 1cm thick. Moreover their response for low energy X-rays is linear and their energy resolution is sufficiently high (~250 eV). In the laboratory for the activity measure there are two Si-Li drifted detectors and their technical details, provided by the constructor, are summarized in table 3.4. Table 3.5 shows the energy of the Kα and Kβ lines of the
elements in table 3.1 that can be found in the activated stacks [78].
Reminding that the characteristic X-ray energy is the same for different isotopes having the same charge Z, the identification of the ER mass require the measurement of the half-life that is different for different isotopes A of the same element Z, as can be seen in table 3.1 [78].
TABLE 3.4
Technical data of the two Si-Li detectors
Parameter name Ortec
SLP-10180-P
Ortec SLP-16220-P
Radius 5 mm 8 mm
Active layer depth 4.92 mm 5.66 mm Distance
crystal-external surface 8 mm 8 mm Window thickness 0.05 mm 0.05 mm Resolution (55Fe 5.9 KeV) 180 eV 220 eV
TABLE 3.5
Kα and Kβ lines of the elements expected in the stack
Father
Element Kα [KeV] Kβ [KeV]
Relative intensity Kβ /Kα Ni 6.925 7.649 0.121 Cu 7.469 8.265 0.120 Zn 8.038 8.905 0.119 Ga 8.627 9.572 0.122 Ge 9.238 10.26 0.124 As 9.87 10.98 0.127
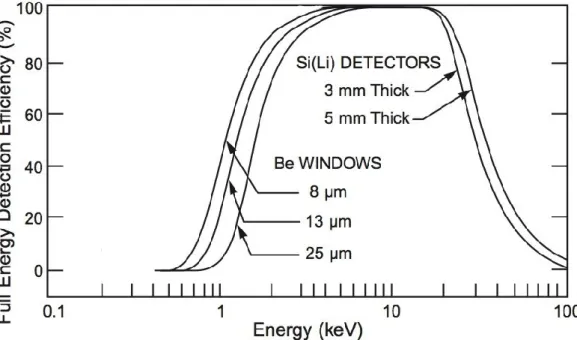
Fig. 3.3: Si-Li drifted detector intrinsic efficiency versus incident X-ray energy.
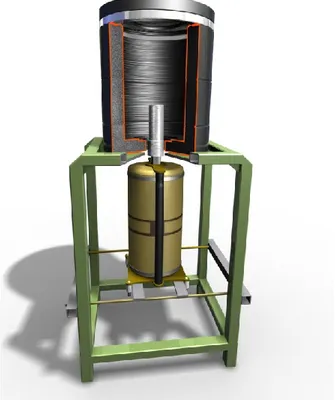
Observing figure 3.3, in the explored energy range of 7÷11 KeV the intrinsic detector efficiency slightly changes as a function of both the active depth and the X-ray energy and is close to 100%. The Si-Li drifted detectors are cooled down to 77°K by liquid nitrogen and are insulated from the surrounding ambient by vacuum in order to avoid the damage due to the high Li ion mobility at room temperature. Moreover the detectors are surrounded by a lead shield to reduce the background as shown in figures 3.4, 3.5.
Immediately after the end of activation the stack is taken from the reaction chamber and is moved to the laboratory for the activity measurement where it is placed in front of a Si-Li detector.
The activated stack is placed in a plastic stack holder in order to fix its position with respect to the detector and reduce all possible uncertainties due to geometric factors. The exact knowledge of the entire apparatus geometry is fundamental in order to correctly normalize the data by determining the detector geometric efficiency, related to the covered solid angle. This issue will be discussed in the paragraph 3.4. The incident X-rays penetrates into the detector active layer through a thin beryllium window at the top of the detector. At the top of the stack-holder has been placed an X-ray stopper to prevent high energy X-rays and γ-rays hitting the internal surface of the shield, which is of copper, and produces characteristic X-rays that can be confused with the ones emitted by the stack.
Fig. 3.4: Schematic view of the experimental apparatus. The activated
stack is positioned above the beryllium window at the detector top using the stack holder in figure 3.8. A lead shield surrounds the detector in order to reduce the background.
Fig. 3.5: The experimental apparatus for the X-ray detection of the
X-ray following the ER electron capture in the stack.
Each detector is provided by a dewar and an internal preamplifier. The acquisition electronic chain is sketched in fig. 3.6.
Fig. 3.6: The electronic chain used to process and acquire the signals from the
detectors. In the scaler: 1) pulser; 2) detector 1; 3) detector 2; 4) divided pulser; 5) valid events; 6) acquired events. See the text for details.
The energy signals from the detectors preamplifiers have been shaped and amplified by the Ortec 672 and acquired by an 8-channels CAMAC ADC. The same signals from the detectors preamplifiers have been treated by a timing Amplifier in order to generate a timing signal for the pulser and each detector. All timing signals have been discriminated and a total OR of the outputs has been built to give the valid event signal for the acquisition. A scaler has been used to check the acquisition dead time by the difference between the total number of valid events and the acquired ones. A latch in manual mode has been used to start the acquisition and the scaler at the same time by vetoing both of them.
A 5 Hz pulser has been used to generate the reference for the elapsed time. Using the pulser acquisition allows to easily correct the measured activities for the dead-time. The activity in counts/minute can be measured as the ratio of the number of decays
ΔN over the time Δt:
A N
but the elapsed time can be written as the ratio between the number of pulser counts
ΔP and the pulser frequency that is 50/10 = 5 Hz that is 60•5 = 300 cycles/minute:
t P
300 (3.2)
Since the measured ΔPm and the measured ΔNm are affected by some dead-time
correction factor H the resulting activity, introducing the dead time and substituting the eq. 3.2 in the eq. 3.1, results:
A N 1 t N 300 P Nm H 300 H Pm Nm 300 Pm (3.3)
that does not depend on the dead-time.
Using two detectors it has been possible to measure the activity for two stacks simultaneously. Each stack has been placed both in detector 1 and detector 2 by turns. In order to normalize data from different detectors, the relative efficiency between the detectors has been measured. The relative efficiency is the ratio between the activity measure for a stack placed in detector 1 and the activity, measured immediately after, of the same stack on detector 2. The relative efficiency between the two detectors is 3.7 with an indetermination of 2%.
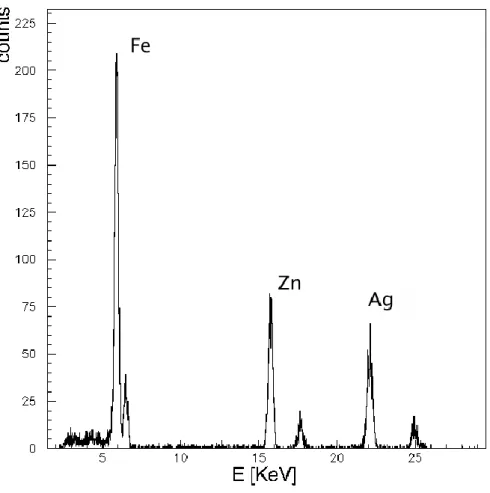
The Si-Li drifted detectors have been calibrated using a 109Cd (Kα 22 KeV; Kβ 25 KeV) source and the fluorescence induced on zirconium (Kα 16 KeV; Kβ 18 KeV), copper (Kα 9 KeV; Kβ 10 KeV), iron (Kα 7 KeV; Kβ 8 KeV) and molybdenum (Kα 18 KeV; Kβ 21 KeV) by the source, obtaining:
E KeV
0.012 ch 1.49 (3.4)for the detector 1 and
E KeV
0.011 ch 1.32 (3.5)Fig. 3.7: Calibrated spectrum for the detector1. In this spectrum
the peaks correspond to the Kα and Kβ lines of iron, zirconium and silver.
3.3 Si-Li drifted detectors geometric efficiency
As introduced in paragraph 3.2 the geometric characteristics of the whole experimental apparatus is fundamental in order to correctly calculate the absolute detection efficiency.
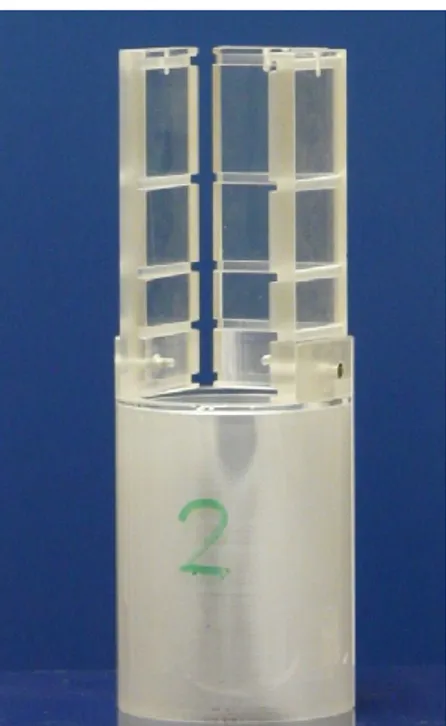
The stack holder used to place the stack in front of the detector is shown in figure 3.8 and allows five distances between the activated stack and the beryllium window: 4.2 mm; 22.2 mm; 42.2 mm; 72.2 mm; 112.2 mm. For all the activity measurements only the lower position of the stack holder, corresponding to a distance of 4.2 mm from the beryllium window, has been used whereas the upper position has been used for the X-ray stopper.
Montecarlo simulations have been performed in order to estimate the geometric efficiency and its indetermination. These values depend on the geometry of the activated region in the stack, the relative position between the stack and the detector and the indetermination in the distance measurement. For this reason a study of the
geometric efficiency dependence by each parameter has been done. In the following, detector 2 is taken as reference since the relative efficiency between the two detectors is known.
As a first step four different geometries for the activated region in the stack have been considered: a point (P), a circular uniform distribution (CU), a circular Gaussian distribution (CG), a square uniform distribution (SU). In all the calculations the square side in SU and the diameter in CU have been fixed at the same value that is equal to 2σ in CG.
Fig. 3.8: The stack holder used for placing the activated
stack in front of the Si-Li detector 2. Of the five possible positions only the lower has been used. See the text for details.
Fixing the distance from the beryllium window and σ both at 1 mm, the geometrical efficiency variation by changing the activated region geometry can be seen in figure 3.9. The excursion from the highest value to the smallest is 3.8% of the average geometrical efficiency.
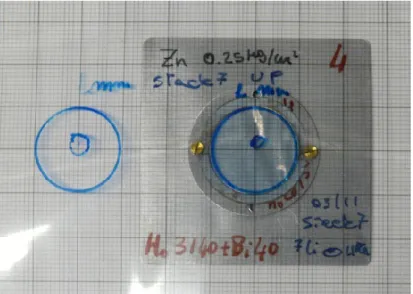
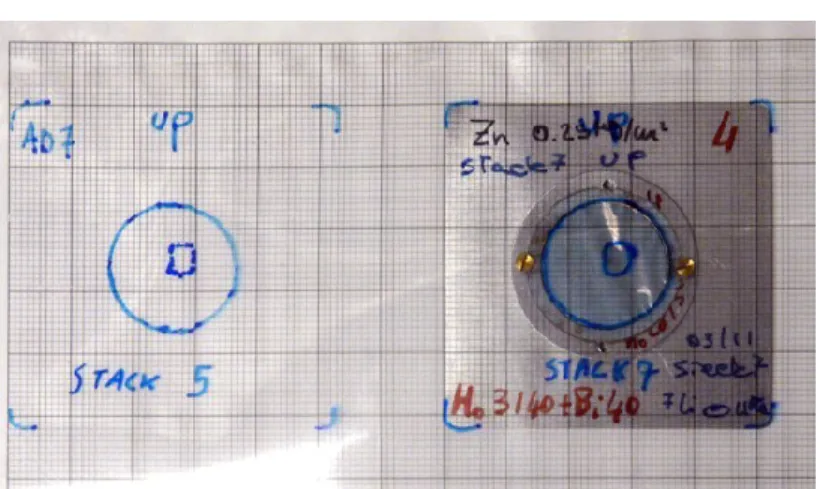
Especially for stacks activated for a long time, the activated region was visible to the eye. Information on the activated areas is useful in order to reconstruct the correct geometry in the geometrical efficiency calculation. A graph transparent paper has been placed over the stack in order to evidence the visible irradiated zone with a marker and measure its dimension. Looking at the stacks, a circular diffused spot
individuated. A less visible square 4×4 mm region surrounding the spot has been individuated. Figures 3.9.1 and 3.9.2 show these evidenced areas for some stacks. The P and SU distributions can hence be discarded.
Fig. 3.9: Geometric efficiency dependence by the geometry of the
activated region in the stack. The distance from the beryllium window and σ are both 1 mm.
Fig. 3.9.1: Study of the activated spot dimension using a
transparent graph paper. On the right the spot is evidenced; on the left is evidenced the irradiated region surrounding the spot.
Fig. 3.9.2: Study of the activated diffused region that surrounds
the activated spot. The same as fig. 3.9.1 (left) for other two staks.
Fig. 3.10: Detector geometric efficiency variation with the activated
region radius in the stack. This test allows associating an efficiency indetermination to the error in the activated region extension measure.
The spot radius and position with respect to the center of the stack also affect the geometric efficiency. Figure 3.10 shows the geometric efficiency variation with the activated region radius for both the CU and CG geometries. In the CG case the radius value corresponds to the σ of the Gaussian radial distribution. With this calculation it is possible to associate the indetermination in the measure of the activated region spatial extension with a geometric efficiency indetermination.
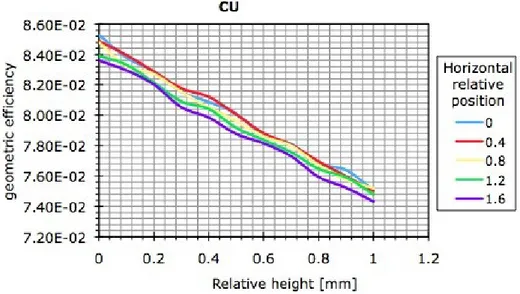
Even the relative position of the activated region with respect to the detector active layer affects the geometric efficiency. In figures 3.11 and 3.12 are shown the results
and vertical directions. Observing the results one can conclude that the geometric efficiency depends strongly on the relative distance between the stack and the target (since the detector is placed in vertical position this distance can be called “height”). As in the case of the radius test, this calculation allows to associate an efficiency uncertainty to the geometrical indeterminations. As can be seen a little indetermination in the relative height corresponds to a considerable indetermination in the geometric efficiency.
The total indetermination on the geometric efficiency is the combination of the spot radius indetermination ΔεS, the spot horizontal position indetermination ΔεH and the
spot vertical position indetermination ΔεV.
S2 H 2 V 2 (3.6)
The indetermination on the stack height is the most relevant of the three, in fact height indetermination of 1 mm gives ΔεV≅10% whereas the same indetermination on
the horizontal position of the spot leads to a ΔεH≅1% and a 1 mm indetermination on
the spot radius leads to a ΔεS≅6%.
Fig. 3.11: Geometric efficiency variation by changing to the relative position
of the activated region with respect to the detector active layer in the case of a circular uniform activated region (CU). The start distance from the beryllium window (height) position (0) is at a distance of 2mm. The start horizontal position (0) is at the center of the detector. The geometric efficiency depends more by the relative height.
Fig. 3.12: Geometric efficiency variation by changing to the relative position
of the activated region with respect to the detector active layer in the case of a circular activated region with a Gaussian radial distribution (CG). ). The start distance from the beryllium window (height) position (0) is at a distance of 2mm. The start horizontal position (0) is at the center of the detector. The geometric efficiency depends more by the relative height.
Looking at the stacks, the activated region has been reproduced as a Gauss circular spot with a 1 mm radius shifted by 1 mm in both x and y directions, and a 4×4 mm boundary surrounding it (figure 3.13).
The calculated efficiencies have been compared with the one measured using a 55Fe calibrated source having a very little active spot (~1mm). Studying the efficiency variation as the open diameter of an iris diaphragm the effective detector surface has been reconstructed (200 mm2). Moreover, placing the 55Fe source in different positions of the stack holder the efficiency variation has been studied and the distance between the beryllium window and the detector crystal has been cross-checked (8 mm). Considering that the distance between the 55Fe source and the beryllium window is 3 mm the measured geometric efficiency, which is 0.051 ± 4%, agrees with the calculated value of 0.054 ± 5% for a point source, assuming that the dominant source of indetermination is in the stack-beryllium window distance, which is measured with a 0.5mm indetermination.
With the experimental tests and the calculations above discussed, in the case of the activated region in fig. 3.13, which is at a distance of 2 mm from the beryllium
The estimated error of 7% is linked to ah height indetermination (V) of 1mm, a
radius indetermination of 0.5mm (S) and a horizontal position indetermination
(H) of 0.5mm. This value has been used for the procedures described in the next
chapter.
Fig. 3.13: The simulated stack activated region in order to better
