A
A
l
l
m
m
a
a
M
M
a
a
t
t
e
e
r
r
S
S
t
t
u
u
d
d
i
i
o
o
r
r
u
u
m
m
–
–
U
U
n
n
i
i
v
v
e
e
r
r
s
s
i
i
t
t
à
à
d
d
i
i
B
B
o
o
l
l
o
o
g
g
n
n
a
a
DOTTORATO DI RICERCA
Biologia e Fisiologia Cellulare
Ciclo XXI
Settore/i scientifico disciplinari di afferenza: BIO/18
TITOLO TESI
Insulin and Nutrients signaling regulate cellular and
organismal growth through the myc proto oncogene in
Drosophila
Presentata da: Dott.ssa Federica Parisi
Coordinatore Dottorato
Relatore
Prof.ssa Michela Rugolo
Prof.ssa Annalisa Pession
Correlatore
Prof.ssa Paola Bellosta
TABLE OF CONTENTS
General Introduction
...5
Larval and Pupal development...6
How multicellular organisms get their size: the
importance of cell growth
... 9
Regulation of size: variation in ploidy...10
Measuring Dimensions: the standing of numbers...12
Extrinsic and Intrinsic regulation of size
...14
Nutrients availability influences growth rates...15
Insulin/Insulin-like growth factors signaling...16
TOR (Target Of Rapamycin) and
the Nutrients Sensor cascade...18
Crosstalks between InR and TOR signaling...22
The well documented role of myc in growth control...24
dMyc and cell cycle regulation...31
dMyc and Cell Competition...32
Thesis Outline
...38
Materials and Methods
...41
Cell culture and western blot...41
Quantitative Real-time PCR...42
Microarray analysis...42
Fly lines...43
Clones generation and transgene induction...44
Analysis of cell size and number in the adult eye...45
Immunofluorescence analysis...45
Genetics
...47
UAS-Gal4 system...47
FLP-FRT...48
FLP-out...50
MARCM system...51
Results
Chapter
1:
dMyc
phosphorylation
regulates
its
stability
...53
CKIα and GSK3β induce dMyc ubiquitination and degradation
through the proteasome pathway...54
In vivo reduction of GSK3β, CKIα or CKIε results in dMyc protein
accumulation...59
In vitro characterization of dMyc phosphorylation mutants reveals
that dMyc-PII and Acidic Box mutants are resistant to CKIα and
GSK3β degradation...64
Increased dMyc stability inhibits ommatidial differentiation and
induces cell death during eye development...65
Chapter 2: dMyc protein expression is sensitive to Insulin
and TOR activity
...70
In vitro and in vivo treatments with Insulin increase dMyc protein
level...71
TORC1 modulates dMYC post-transcriptionally ...76
dRheb expression increases dMyc protein level through GSK3β
inactivation………..………78
PTEN, TOR and Rheb show significative epistatic interactions
with dmyc……….81
Genetic interaction of dmyc with members of the InR-TORC1
signaling in wing imaginal discs………...……86
TORC1 and dMyc regulation………90
Discussion
……….93
GENERAL INTRODUCTION
Drosophila melanogaster has from nearly a century a fundamental
role in the understanding of the basis of genetic mechanisms, due to the relative semplicity of its genome, to the short life cycle, to the abundance of the progeny and to the great amount of genetic markers of its body wall.
From the pioneering studies of Thomas Hunt Morgan and the members of his laboratory, the fruitfly has early become the best characterized model organism for genetic studies. Moreover, the development of mutagenesis techniques by nobel prizes Christianne Nüsslein-Volhard and Eric Wieschaus has permitted the isolation and characterization of a large number of genes involved in each step of
Drosophila development. With the advancement of molecular biology
techniques and genome sequentiation, this animal represents today an excellent model to understand the genetic mechanisms at the basis of almost all metazoan development.
The fruitfly is a holometabolous organism, characterized by a life cycle that starts from an embryonic stage, made inside the egg, followed by three larval instars (L1, L2, L3), during which the larva increases its dimensions. At the end of the third larval instar, at the pupal stage, a catastrophic metamorphosis occurs characterized by the histolysis of the larval tissues and by imaginal tissues differentiation, responsible for the adult appendages definition.
The life cycle of a wild type organism is about ten days at 25°C.
LARVAL AND PUPAL DEVELOPMENT (M. Ashburner, K. G. Golic, R. Scott Hawley, Drosophila a laboratory Handbook)
After 23h AEL, L1 larva emerges; the three larval instars are spaced out by moults and followed by metamorphosis. Moults and metamorphosis are governed by ecdysone peaks, a steroid hormone produced by the ring gland. Larval body is composed of two cellular types: larval cells, that are polyploid, and imaginal cells, that are diploid.
Imaginal cells segregate precociously from the surrounding larval cells, forming small cell groups at 9-10h AEL and are organized in two fundamental groups, imaginal discs and abdominal histoblasts.
Imaginal discs begin an intense proliferative activity from the second larval instar until pupariation, while abdominal histoblasts proliferate later, during the pupal stage. At this moment the majority of larval cells are eliminated and substituted by imaginal cells that originate the integument and the adult appendages.
Imaginal discs originate the structures of the head, thorax external appendages, genitalia and adult muscles. The histoblats originate the abdomen structures with the exception of the 8th segment that derivates from the genital imaginal disc.
Each imaginal disc at the end of larval development is constituted by a pseudostratified columnar epithelial tissue, that represents the actual imaginal disc, and by a squamous epithelium that forms the peripodial membrane. The first one originates the integument and the appendages, the second one originates the epithelial veil that welds the structures derived from different imaginal discs.
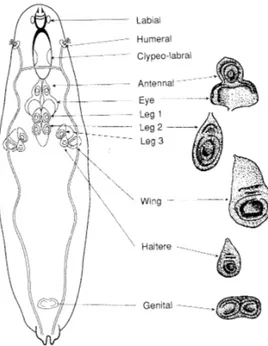
Imaginal discs location in the larval body is peculiar for each one of them (Fig.1).
Figure 1 - Localization of the imaginal discs in the larva at the L3 instar (Bate e
Martinez-Arias, 1991).
One interesting feature of imaginal discs is their ability to survive, metamorphose and differentiate after transplantion in adult flies’ abdomen, (Schubiger et al, 1969; Simcox et al., 1989). Fragments of imaginal discs
can regenerate the entire disc structure and experiments in this direction allowed the characterization of “fate maps” of regeneration (Bryant, 1978).
The wing imaginal disc is an excellent model for the elucidation of organogenesis and proliferation mechanisms; at the end of L3 it is subdivided into a series of folds (Fig. 2). The centrifugal regions of the imaginal disc originate the thorax structures: notum and pleura. The middle region originates the hinge region while the central region is the presumptive territory from which the wing lamina differentiates. Imaginal tissues are virtually two-dimensional structures, but they originate adult appendages with three axes (AP, DV, PD); this is due to a mechanism of eversion during methamorposis, in which the most central regions of the disc originate the distal structures, while the external regions originate the most proximal structures of the appendage.
Figure 2 - Schematic representation of the wing imaginal disc at L3 instar (A) and of the
adult wing (B). Different colors in the figure A indicate the presumptive territories of the structures visualized in B [from Bate and Martinez-Arias, 1991].
HOW MULTICELLULAR ORGANISMS GET THEIR SIZE: THE
IMPORTANCE OF CELL GROWTH
In addition to being the unit of life, the cell is also the unit of growth. Growth is an increase in mass over time, and the term can describe mass increase of individual cells (“cell growth”) as well as tissues, organs or entire animal growth (“growth”). Understanding what regulates the overall growth of a cell and how cell growth is coordinated with progression through the cell cycle are important problems in biology.
Recently, converging studies of cell growth and proliferation, pattern formation, endocrine regulation and evolution have generated new perspectives to these problems. Progress in the insect model systems has been particularly noteworthy, as genetic studies in Drosophila melanogaster have converged with classical endocrinological studies in other insects to generate a hypothesis to explain body size, if not shape and form. The physiology of growth control in insects is, of course, different to that in mammals, but the genes and signalling pathways that are involved are surprisingly similar.
Insects do not grow as adults, and so their final size can be considered, to a first approximation, as a product of their growth rate during the larval phases and the duration of this growth period.
REGULATION OF SIZE: VARIATION IN PLOIDY
The first evidence that animals can monitor dimension came from haploids and polyploids. For a given cell type, cell size is usually proportional to ploidy. Hence haploid cells are about half the volume of diploid cells, diploid cells are about half the volume of tetraploid cells, and so on.
The ploidy of newts and salamanders can be manipulated to produce animals with chromosome complements ranging from haploid to pentaploid (Humphrey et al., 1957). In all cases, animals with unusual ploidy grow to the normal (diploid) size but contain very different numbers of cells. Thus mature tetraploid salamanders (Amblystoma mexicanum) look little different from diploid ones despite having half the number of cells.
Mammals are not so robust; tetraploid mice usually die in utero. However, they compensate for the larger size of their cells by a reduction in cell number (Henery et al., 1992). After birth, these mechanisms of compensation seem not to operate in mammals. Knockout mice that lack p27, an inhibitor of the cyclin D- and cyclin E-associated kinases which are required for entry into S phase, are born normally sized but subsequently grow considerably larger than littermates (Fero et al., 1996; Kiyokawa et al., 1996; Nakayama et al., 1996). The increase is a result of increased cell proliferation. In these knockout mice, increased cell proliferation does not result in a compensatory decrease in cell size.
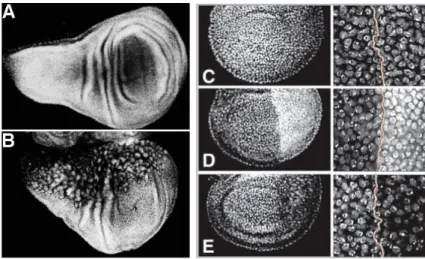
In Drosophila the growth and final size of diploid/haploid mosaics is about normal (Santamaria, 1983), the haploid regions of such flies containing more numerous but smaller cells. The ploidy of Drosophila cells can be increased by loss of function of the cyclin-dependent kinase Cdc2. Cdc2 is required for mitosis in Drosophila and when the Cdc2 gene is inactivated in cells of the wing imaginal disc, cells switch from a mitotic cycle to cycles of endoreduplication without division (Fig 3 A-B) (Weigmann et al., 1997).
Figure 3. Pattern can be conserved indipendently of cell numeber or size. Left:
Inactivation of Cdc2 by the use of a temperature sensitive allele (Cdc2E1-24)specifically in the anterior compartment of the wing disc (upper part) does not change shape and size of the wing, even though the affected region contains fewer but much larger, polyploid cells. Cell size is visualized by DNA staining. Wild-type (A). Cdc2E1-24, en-Gal4; UAS-Cdc2+ (B) [from Weigmann et al., 1997].
Right: Wing imaginal discs in which the cell density of the posterior compartment has been
manipulated. There is no change in the shape and size of the compartments or the wing. The interface between A and P cells was drawn with a dotted line. C is entirely wild type. In (D) the P compartment has many more cells; in (E) many fewer cells than normal. The A compartment in (D) and (E) has normal cell densities [from Neufeld et al., 1998].
The effects of polyploidy argue that there is a strong positive relashionship between genome size and cell size. However, different cell types within a multicellular organism often vary in size, despite containing identical genomes of the same ploidy. Thus, there is not a strict adherence
to a DNA:Cytoplasm ratio, indicating that amount of DNA is not the sole determinant of cell size.
However these experiments seems to demonstrate that changes in cell number can be compensated for by changes in cell size, both locally in groups of cells, or more globally in the whole compartment.
MEASURING DIMENSIONS: THE STANDING OF NUMBERS
During the growth of most organs, rates of cell growth and cell division are coordinated so that cell size does not change much over time, in other words growth is normally accompanied by an increase in cell number. The mechanisms that match rates of cell growth with cell division are mysterious, and are only recently being addressed in metazoans.
Whereas mitotic cells often coordinate growth with division, in many natural processes the two phenomena can be separated. Early embryogenesis, for example, involves several rounds of division without growth and endoreplication, by the other side, it consists in growth without cell division.
In the developing Drosophila wing discs, growth can be uncoupled from cell division (Fig.3 C-E). For example, when cell division is slowed or blocked, cells continue to accumulate mass (cell growth) and hence increase in size. Conversely, when division rates are accelerated by overexpression of specific cell-cycle regulators, cell growth rates are
unaffected and cells divide at smaller size (Neufeld et al. 1998). These observations demonstrate that, in metazoans, cell division rates do not drive cell growth. It is still unclear whether the opposite is true and cell growth is sufficient to drive cell division.
EXTRINSIC AND INTRINSIC REGULATION OF SIZE
The identity of a particular organ, the position of a cell within this organ and its interactions with neighboring cells all play important roles in determining cellular growth rates. Although different models have been put forward to explain this local, organ-intrinsic control of growth, its molecular basis has remained elusive. In addition to local control, cells also experience more global signals that control their growth rates. Temperature and nutrient availability, for example, strongly influence growth rates and can affect the final size of many animals.
It seems that, generally, extrinsic mechanisms are concerned with a link between growth and nutrition; they are not involved in proportion and pattern, but do affect the rate of growth and also the final size of the fly. Edgar and colleagues (Johnston et al., 1999) have argued that nutrition-based and pattern-nutrition-based regulation of growth operate in distinct ways: nutrition regulates the cell cycle via myc-dependent cyclin E regulation, acting at the G1/S checkpoint, and pattern acts through cdc25/string which intervenes at the G2/M checkpoint.
Our emphasis in this essay is on the nutrition-based regulation of growth and myc role in size determination.
NUTRIENTS AVAILABILITY INFLUENCES GROWTH RATES
Body and organ size are related to nutrition: poorly fed Drosophila larvae develop more slowly and can produce smaller flies. The wings of such flies are smaller because they contain smaller and fewer cells. Apart from this reduction in size, wing pattern is unaffected (Robertson, 1972; Bryant and Simpson, 1984).
Dietary protein restriction has been shown to extend Drosophila development from 5 days to several weeks under constant temperature conditions. Not surprisingly, larval growth can be arrested by removing dietary proteins completely. This treatment rapidly arrests cell growth and DNA replication in most of the differentiated larval-specific tissues, but if the
minimum viable weight (weight at which larvae can develop into adults if
food is completely withdrawn) has been attained, the progenitor cells that will form the adult continue to grow and proliferate (Britton et al., 1998), eventually generating a small but otherwise normal fly.
The fact that cells can grow within a starved animal indicates that the haemolymph (blood fluid) in such animals is not critically depleted of nutrients. Indeed, D. melanogaster and other insects are known to maintain haemolymph nutrients when they are starved by mobilizing triglycerides and glycogen stored in the fat body, a mesoderm-derived energy-storage organ that fulfills the functions that are assumed by the liver and adipose tissues in mammals (Bradley and Leevers, 2003; Mirth and Riddiford, 2007) .
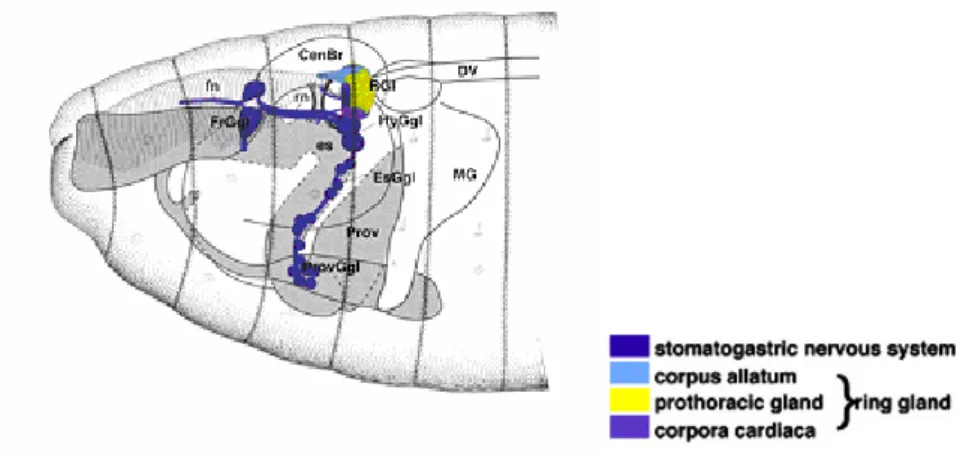
Nutrient mobilization from the fat body is mediated by the induction of metabolic neuropeptides called adipokinetic hormones (AKH), which are produced by the Corpora Cardiaca, a region of the neuroendocrine Ring Gland (Fig.4). AKHs function analogously to vertebrate glucagons and, together with insulin-like peptides (ILPs), are part of an endocrine signalling system that allows the animal to coordinate rates of cell growth and changes in diet, with minimal disruption of the developmental programme.
Figure 4. Schematic representation of Drosophila stomatogastric Nervous System and
Ring Gland.
INSULIN/INSULIN-LIKE GROWTH FACTORS SIGNALING
The insect Insulin/Insulin - like growth factors system (IIS) (Fig.5) is highly homologous to that found in mammals. IIS activity promotes glucose import and nutrient storage in the fat body and other organs, fulfilling the homeostatic function of vertebrate insulins (Shingleton et al., 2005). In this capacity, it affects feeding behaviour, lifespan and reproduction. During
development, IIS also regulates cell growth, fulfilling the developmental function of the mammalian insulin-like growth factors (IGFs) (Efstradiatis 1998).
IIS activity has been manipulated in various ways in D. melanogaster, using the Gal4–UAS system (Brand and Perrimon, 1993) to overexpress genes in specific tissues, and the Flp–FRT system (Xu and Rubin, 1993) to delete gene functions in specific tissues at defined times.
These manipulations show that many IIS components not only are essential for cell and organ growth, but are also sufficient to autonomously increase the growth rate of about any cell type in D. melanogaster. In whole animals, increased expression of several of D. melanogaster’s seven Insulin-like peptides (ILPs), a class of peptide hormones homologous to vertebrate insulins and insulin-like growth factors, can increase both larval growth rates and adult size (Brogiolo et al., 2001; Ikeya et al., 2002), whereas ablation of the small cluster of medial neurosecretory cells (mNSC) in the brain, which are the principal source of ILPs, reduces growth rates and final body size (Ikeya et al., 2002).
ILPs bind the insulin receptor and promote cellular glucose import, energy storage in the form of glycogen and triglycerides, and cell growth.
Drosophila melanogaster has seven paralogous genes (dILPs 1-7)
expressed in different clusters on mNSCs (Ikeya et al., 2002).
Activation of the InR/PI3K by dILPs increases macromolecular synthesis and this is most likely responsible for the potent effects of InR/PI3K on cell size. The ability of different cell types to respond to insulin
(or other growth factors) could be regulated by their accessibility to the ligand(s), or by their expression of the receptors or downstream components. Different expression levels of these components could dictate cell-type-specific size control.
Figure 5. Drosophila Insulin pathway. Upon binding its ligand (ILPs), dInr activates an
evolutionarily conserved signal transduction cascade. PI3K is recruited to an activated insulin receptor (InR) through an insulin receptor substrate and an adaptor protein, p60. In turn, the membrane localization of PI3K allows it to phosphorylate phosphatidylinositol-4,5-P2 (PtdIns[4,5]phosphatidylinositol-4,5-P2), producing phosphatidylinositol-3,4,5-P3 (PtdIns[3,4,5]P3). This second messenger then recruits and activates protein kinase B (PKB), in cooperation with phosphoinositidedependent kinase (PDK). A negative regulator of this pathway is the phosphatase PTEN, which converts PtdIns(3,4,5)P3 back into PtdIns(4,5)P2. Together with the pathway acting through dTOR and the ribosomal protein S6 kinase (dS6K), the dInr pathway controls the activity of the protein translation machinery. [modified from Edgar 2006]
TOR (Target of Rapamycin) AND THE NURIENTS SENSOR CASCADE
Given a cue to grow, such as insulin signaling, a cell needs a nutrient-rich environment to execute the command. One proposed
mechanism for a cell to sense its environment involves the target of rapamycin, TOR. TOR was first identified in yeast as a mediator of protein synthesis in response to nutrients (reviewed in Schmelzle and Hall, 2000) and has been shown to regulate translation, ribosome biogenesis and uptake of amino acids.
The first genetic analyses of TOR in a multicellular animal were performed by two laboratories using Drosophila (Oldham et al., 2000; Zhang
et al., 2000). The researchers found that cells mutant for TOR were reduced
in size at all stages of the cell cycle. In addition, TOR mutant animals had a growth arrest phenotype reminiscent of amino acid withdrawal (Zhang et al., 2000). Genetic epistasis tests demonstrated that in TOR/Pten double mutants, the phenotype of the TOR mutation was dominant, implying that TOR is required for the increased growth resulting from elevated insulin signaling.
Further observations support the argument that TOR does not function downstream of InR/PI3K in a simple, linear pathway. First of all, careful examination of cell-size defects in endoreplicating cells revealed that cells mutant for TOR were phenotypically different from cells mutant in the Insulin Receptor Substrate (IRS)/chico: loss of TOR demonstrated a more pronounced decrease in cytoplasmic volume relative to the nuclear compartment (Oldham et al., 2000). Second, in contrast to the cell-enlargement phenotypes seen following increases in InR/PI3K activity, overexpression of TOR reduced cell size. This contraddictory effect of TOR on growth has been repeatedly documented (Hennig et al., 2002) but has
no obvious molecular explanation and will be addressed later on in this dissertation.
TOR has been well documented as responsive to nutrients in yeast and tissue culture, but despite intensive study, it is still unclear how it senses environmental conditions and how this pathway relates to the InR/PI3K pathway in multicellular organisms.
Recent work on the two effectors of TOR signaling, S6K and 4EBP has supported the role of TOR in maintenance of cell size. S6 kinase (S6K) is implicated in promoting translation of proteins involved in ribosomal assembly, and requires TOR (Oldham et al., 2000) and PDK (Radimerski et
al., 2002) for activation. 4E-BP is a negative regulator of the translation
initiation factor, eIF4E.
A mutant version of 4E-BP, which binds to eIF4E more strongly than wildtype, was used to perturb eIF4E function in Drosophila (Miron et al., 2001). Overexpressing the modified 4E-BP in transgenic animals resulted in a cell-size decrease. However, co-overexpression of eIF4E was not sufficient to bypass the effect of 4E-BP. The failure of TOR overexpression to promote cell size and the inability of eIF4E to counter 4E-BP inhibition suggests regulation beyond total levels of TOR and its effectors. Modification by phosphorylation could be this additional level of control. For example, coexpression of the kinase PDK greatly enhances S6K-directed growth (Radimerski et al., 2002) and mutation of phosphorylation sites of eIF4E impedes normal growth (Lachance et al., 2002) .
Proteins of the TSC complex (TSC1 and TSC2) have been identified as potential upstream negative regulators of TOR (McManus and Alessi, 2002), and may also play a role in nutrient sensing. In cells lacking TSC1 or TSC2, phosphorylation of S6K is resistant to amino acid deprivation; conversely, increased levels of TSC1 and TSC2 prevent S6K phosphorylation even in the presence of abundant amino acids (Gao et al., 2002).
Recent studies in Drosophila have identified the small GTPase Rheb as a link between TSC1/TSC2 and TOR (Saucedo et al., 2003; Stocker et
al., 2003). Rheb, which is inhibited by the GTPase activating protein (GAP)
activity of TSC2 (Zhang et al., 2003), appears to be a proximal activator of TOR, although its mechanism of action remains to be elucidated.
S. pombe mutants for rheb (rhb1) arrest in G0/G1 as small, rounded
cells (Mach et al., 2000; Yang et al., 2001), suggesting a role for Rheb in cell cycle progression and cell growth.
Highly conserved Rheb genes have been described throughout the metazoa (Yamagata et al., 1994; Reuther and Der, 2000; Urano et al., 2000; Urano et al., 2001; Im et al., 2002; Panepinto et al., 2002). Drosophila Rheb (dRheb) has both GTP binding and GTPase activities (Patel et al., 2003).
Overexpression of dRheb results in tissue overgrowth and increased cell size in the whole organism, and transition into S phase and cell growth in culture. Conversely, reduction of dRheb activity results in reduced tissue growth and smaller cell size in the whole organism, as well as G1 arrest and smaller cell size in culture (Patel et al., 2003; Stocker et al., 2003).
dRheb overexpression is sufficient to counteract the effects of
aminoacid deprivation, since, despite the lack of aminoacids, larval cells expressing dRheb reach normal size (Stocker et al., 2003).
The results of treating S2 cells and flies with Rapamycin, an inhibitor of TOR, suggest that the effects of dRheb are probably mediated by dTOR.
At this regard, our data (see Results) show for the first time a growth effect, enhanced by Rheb, which seems to be, at least in part, indipendent from TOR, opening the possibility for the existence of another level of size regulation in response to nutrients availability.
Finally, TOR has recently been shown to form a nutrient-dependent complex with a WD40 and HEAT repeat-containing protein, raptor, which appears to have both positive and negative effects on TOR activity, perhaps depending on nutrient levels (Hara et al., 2002; Kim et al., 2002; Loewith et
al., 2002).
Although the dissection of the activity of TOR presents some complexities, TOR is clearly required for maintaining normal cell size and permitting growth-factor-mediated cell hypertrophy.
CROSSTALKS BETWEEN InR AND TOR SIGNALING
Apparently cells are instructed to grow according to two different extracellular inputs: growth factors on one hand, activating a PI3K-mediated signaling, and nutritional cues on the other triggering a TOR-mediated
signaling response. These two signaling pathways are known to send branches to each other.
Inhibition of TOR with rapamycin can potently block activation of S6K in response to growth factors, and thus TOR function is required for effective growth factor signaling (Jacinto and Hall, 2003). However, immunokinase assays have found that TOR activity increases only slightly in response to growth factors (Burnett et al., 1998). Furthermore, mutant forms of S6K have been isolated that are resistant to rapamycin and amino acid withdrawal, but remain sensitive to wortmannin, a PI3K inhibitor (Hara
et al., 1998; Weng et al., 1995b).
Thus TOR and PI3K appear to regulate essentially parallel signaling pathways which may ultimately converge on common targets. In this sense, TOR signaling can be thought of as a nutrient-dependent checkpoint on growth factor signaling. The modest increase in TOR activity that does occur in response to growth factors was initially thought to be mediated through phosphorylation of TOR by Akt, which can directly phosphorylate TOR in vitro on sites whose phosphorylation is serum sensitive in vivo (Scott et al., 1998). However, mutation of these sites to alanine does not diminuish signaling downstream of TOR (Sekulic et al., 2000); furthermore, these sites are not conserved in the fly, worm or plant TOR homologs.
Recent experiments suggest that a link between PI3K and TOR may occur through Akt-mediated phosphorylation of TSC2, which was found to disrupt and inactivate the TSC1/TSC2 complex (Dan et al., 2002; Inoki et al., 2002; Potter et al., 2002). It will be important to determine whether
phosphorylation by Akt is a critical factor regulating TSC function during normal development.
An additional level of cross-talk between the PI3K and TOR pathways occurs through a negative feedback loop involving TOR-mediated inhibition of IRS1/chico, an adapter protein required for PI3K activation by the insulin receptor. Activation of TOR results in phosphorylation and subsequent proteasomal degradation of IRS1, leading to reduced PI3K signaling (Haruta et al., 2000). Similarly, mutations in S6K have been found to increase the kinase activity of Akt in Drosophila (Radimerski et al., 2002).
These trans-pathway interactions are likely to play an important role in coordinating cell growth with other metabolic programs.
THE WELL DOCUMENTED ROLE OF myc IN GROWTH CONTROL
Myc proteins are members of the basic-helix-loop-helix-zipper class of transcription factors and are deregulated in several human cancers (Nesbit et al. 1999). c-Myc expression is quickly induced in response to many mitogens but the promoter elements directing induction are not well characterized.
Numerous reports have indicated that Myc family members activate transcription of genes involved in protein synthesis and cellular metabolism (Coller et al., 2000; Guo et al., 2000; Boon et al., 2001). These functions
correlate well with Myc’s ability to promote cell size increases in tissue culture and in vivo (Johnston et al., 1999) when overexpressed.
A recent publication of an allelic series of c-myc-hypomorph/null mice demonstrated that Myc regulates body size in mice by controlling cell number without detectable changes in cell size (Trumpp et al., 2001).
Animals with reduced levels of c-Myc weighed less than normal counterparts and the weight loss was distributed among all organs. The researchers performed flow cytometry on dissociated cells from several organs and found no decrease in cell sizes as measured by forward scatter. Additionally, no differences in cell size were seen in haematopoietic cells or primary embryo fibroblasts. However, cell number was lower in the spleen, lymph nodes, and bone marrow of mutant mice.
This observation, along with the discovery that primary fibroblasts of embryos with decreased c-myc have an elongated cell cycle, led the authors to conclude that c-Myc is not required for cellular growth but rather that c-Myc controls the decision to divide or not divide. Another interpretation of these data is that cell growth and proliferation are coupled in these animals. In this case, a defect in cell growth would, by default, result in fewer cells.
Two other groups used tissue-specific deletion of c-myc to examine its role in haematopoetic cells (de Alboran et al., 2001; Douglas et al., 2001). In these studies, absence of myc prevented activation of B- and T-cells, which involves a growth transition from small to large cells. This result differs from Trumpp et al., who reported normal T-cell activation in the
absence of myc, leaving the necessity of Myc for growth-coupled maturation of B and T-cells uncertain.
There are three myc family members in mammals, and it remains to be examined whether L- or N-Myc has a role in maintaining cell size.
Years of research on c-Myc in mammalian systems have led to a dauntingly diverse range of potential genetic and functional targets. Yet it has remained difficult to evaluate Myc’s function in its entirety due to redundancy among family members, tissue specificity, and complex phenotypes.
These problems spurred the search for Myc in genetically tractable animal models, and led to the identification of Myc family members in zebrafish, in the nematode Caenorhabditis elegans, and in Drosophila.
The relatively simple genome and the highly developed genetics that
Drosophila offers have made it the model of choice for the study of Myc
family members. In fact, the very first myc mutant of any was identified as a spontaneous mutation in Drosophila in the 1930s by Eleanor Nichols-Skoog and Calvin Bridges, which they called diminutive (dm), for its smaller body size. dm was identified as a mutation in the Drosophila myc (dmyc) gene in 1996, and since then more than a dozen mutations of dmyc have been characterized (Gallant et al., 1996; Schreiber et al., 1990).
In the last several years, work on dMyc has clarified some of the protein’s more enigmatic functions and also led to the identification of new functional roles.
The single myc gene of Drosophila can partially rescue the proliferation defect of fibroblasts from c-myc mutant mice, suggesting shared functional targets (Trumpp et al., 2001).
One of the greatest advantages Drosophila provides to Myc biology is the ease with which growth can be studied in a living animal. All dmyc mutations show profound growth defects. Null mutant embryos hatch into larvae at the same time as wildtype animals, but fail to grow and die early in the second larval instar (Pierce et al., 2004).
Hypomorphic alleles are lethal at progressively later stages of development, depending upon their severity (Pierce et al., 2004; Maines et
al., 2004). In animals bearing the weakest alleles, such as the original dm1
mutation and dmycP0, development is delayed and yields small flies – the result of smaller cells – with short, thin bristles (Johnston et al., 1999). Animals carrying the slightly stronger dmycP1 allele also have a significant reduction in cell number.
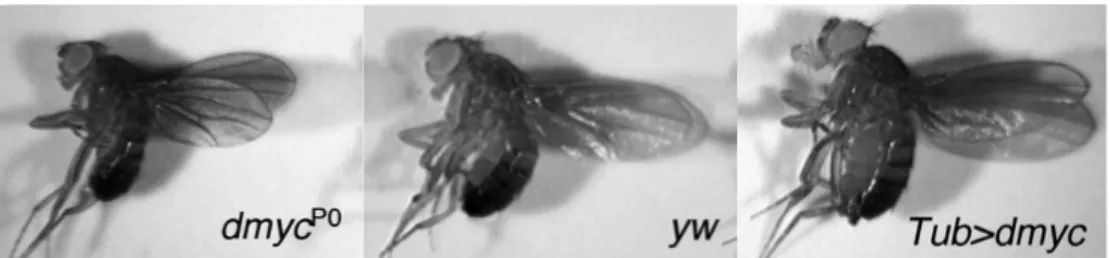
Interestingly, although the hypomorphic mutant flies are smaller than normal, they appear normally proportioned (Fig. 6) (Johnston et al., 1999; Moberg et al., 2004). Many of these same defects are characteristic of flies with growth deficits, and also appear in flies with mutations in genes encoding ribosomal proteins (the Minute class of mutations) and other components of ribosome biogenesis (Lambertsson, 1998).
Figure 6. dMyc controls animal growth. Flies expressing less dmyc, such as a viable
dmyc hypomorph (dmycP0), are smaller in overall body size than wildtype flies (yw), and wing size is reduced approximately 15%. Conversely, flies with increased dmyc expression, from a Tubulin promoter-dmyc transgene (Tub>dmyc), are approximately 30% larger in overall body size than wildtype flies. [Modified from: de La Cova and Johnston, 2006]
The existence of a broad dmyc allelic series with a range of phenotypes suggests that some developmental processes in the fly require
dmyc more than others. dmyc is expressed in numerous tissues throughout
fly development, and its expression occurs in a dynamic pattern (Gallant et
al., 1996). It is expressed in both endoreplicating cells, which oscillate
between G1 and S phase but do not divide, and in mitotic tissues (Pierce et
al., 2004; Johnston et al., 1999).
Use of the FLP/FRT technique of mitotic recombination to generate somatic dmyc mutant cells in an otherwise normal animal demonstrated that in all tissues examined, clones of dmyc mutant cells result in pronounced defects in cellular growth. This defect is manifested by a small cell size and by impaired progress through the cell cycle (Johnston et al., 1999).
In endoreplicating larval cells that can normally achieve a DNA content upwards of 2000C, dmyc null cells fail to increase in size as development progresses, a defect that is directly related to the number of endocycles a cell undergoes (Pierce et al., 2004). Since the dramatic growth
of these cells is required to sustain the overall growth of a fly larva, the impaired growth of dmyc mutant endoreplicating tissue probably accounts for the growth arrest and subsequent death of these null mutant larvae (Pierce et al., 2004). dmyc is also required for growth of polyploid cells within the female germline, and in the diploid imaginal cells that give rise to the adult body structures of the fly (Maines et al., 2004; Johnston et al., 1999).
Proliferating dmyc mutant imaginal cells are markedly reduced in size and spend a disproportionate amount of the cell cycle in the G1 phase; these cells are also smaller in S, G2, and M phases (Johnston et al., 1999).
Conversely, overexpression of dMyc in imaginal cells increases cell size by accelerating cellular growth, and when expressed throughout the animal the size of the fly is increased by nearly 30% (Fig. 6) (Johnston et al., 1999; de la Cova et al., 2004). Collectively, these mutant phenotypes provide solid evidence that dMyc is required in vivo for cellular growth, and that it acts in a dose-sensitive manner.
The vast majority of dmyc targets encode factors used in ribosome biogenesis (Orian et al., 2003, Hulf et al., 2005; Grewal et al., 2005). These targets include RNA Polymerase I and II transcribed genes, and many appear to be directly responsive to dMyc activity. dMyc overexpression is accompanied by a dramatic increase in nucleolar size and in pre-rRNA expression. Bigger nucleoli are usually a good indicator of increased ribosome activity (Grewal et al., 2005). This effect is not observed when
other growth regulating factors, such as the PI3K, Dp110, or Cyclin D/Cdk4 are overexpressed (Grewal et al., 2005).
Fibrillarin expression is also increased in these larger nucleoli, and the cytoplasm of larval salivary gland cells expressing dMyc are packed with ribosomes and polysomes, with a dense network of rough endoplasmic reticulum (Fig. 7).
By contrast, in dmyc mutant larvae, pre-rRNA levels are low compared to controls. Levels of rDNA and nucleolar size are reduced (Grewal et al., 2005). As a whole, the data indicate that modulation of ribosome biogenesis is an important effector of dMyc during normal growth, with dMyc-dependent transcriptional regulation of ribosome biogenesis resulting in greater translational activity within the cell.
Figure 7. dMyc regulates nucleolar size and ribosome biogenesis in vivo. Cells of the
fly salivary gland overexpressing dMyc have increased ribosome content (dark dots in a and b), and larger nucleolar size (c and d) as visualized by Fibrillarin (red), and nuclear size (c and d) as seen by DAPI (blue). (Modified from: Grewal et al., 2005)
dMYC AND CELL CYCLE REGULATION
Given its pivotal role in human cancer and in developmental control of growth, understanding how Myc regulates the cell cycle has historically been of great interest. Like vertebrate Myc, dMyc is required for efficient transit through G1 into S phase, as dmyc mutations stall cells in G1, and overexpression of dMyc accelerates G1 (Pierce et al., 2004; Maines et al., 2004; Johnston et al., 1999).
However, dMyc is not essential for cell cycle progression. This is clearly demonstrated in the female fly germline, where mitotically dividing cytoblast cell clones carrying a strong hypomorphic allele of dmyc still undergo all the normal divisions, producing the expected 16 cells of a normal germline cyst (Maines et al., 2004). On the other hand, as mentioned above, endoreplicating cells mutant for dmyc undergo significantly fewer rounds of S phase. The molecular nature of the defect in endoreplication is unclear, as dmyc cells still periodically express the G1 regulators Cdk2, CyclinE and Dacapo, the fly p27cip/kip homolog, and are able to complete the entire endocycle (Maines et al., 2004).
One possibility is that dMyc regulates the frequency of S phase entry in these cells. Consistent with this idea, overexpression of dMyc increases the rate of endoreplication in cells of the Drosophila fat body, and this effect is accompanied by (and dependent upon) oscillating activity of Cyclin E/Cdk2 (Pierce et al., 2004).
Moreover, dMyc expression in endocycling cells can partially reverse a growth arrest imposed by expression of the phosphoinositol-3-kinase
(PI3K) adaptor p60, rescuing both endoreplication and cellular growth (Pierce et al., 2004; Maines et al., 2004).
By controlling cellular growth and cell proliferation, dMyc has a major impact on the regulation of animal size. In contrast to the growth-regulating network of Insulin/PI3K and dTOR, dmyc expression is regulated by at least two of the major developmental signaling pathways that regulate pattern in
Drosophila, Wingless (Wg)/Wnt, and Decapentaplegic (Dpp)/BMP/TGFβ.
While Insulin/PI3K/dTOR signaling controls growth in response to nutrients, the responsiveness of dMyc to Wg and Dpp, which are also required for growth of many fly organs, suggests a model wherein developmental signals contribute to tissue growth, and ultimately body size and proportion, by regulating dMyc activity.
dMYC AND CELL COMPETITION
Recently, work in Drosophila has revealed a new aspect of dMyc function: high levels of dMyc provide cells with a competitive edge that allows them to kill nearby cells that have less dMyc. In the fly, cell competition is a process that is operationally defined by the progressive elimination of normally viable (but less “competitive”) cell types.
When cell clones overexpressing dMyc are generated in the developing wing, such clones grow faster than the surrounding wildtype
cells, which in turn actually grow less than expected and die more frequently (de la Cova et al., 2004; Moreno et al., 2004).
The ability of dMyc to induce cell competition is a remarkable property that is not shared by all growth regulators. Competition can be induced whenever neighboring cells differ in levels of dMyc. Wildtype cells, containing endogenous dmyc, are only killed when they reside near cells overexpressing dMyc.
Likewise, although dmyc hypomorphic cells are viable when surrounded by each other, when they exist in somatic clones surrounded by wildtype cells, they are eliminated from the wing (Johnston et al., 1999).
Similar competitive outcomes result from other manipulations that allow some cells to have higher dMyc levels than their neighbors. For example, loss of archipelago (ago), which encodes a Drosophila F box protein homologous to human Fbw7, results in elevated dMyc protein levels and a competitive advantage that allows ago mutant cells to overtake whole body structures while wildtype cells are eliminated (Moberg et al., 2004).
Cells with mutations in receptors for patterning factors, such as Dpp, Wg, or EGF, or those deficient in ribosome biogenesis, such as Minutes, a large class of mutations in genes encoding ribosomal proteins, are also subject to competitive elimination (Burke et al., 1996; Johnston et al., 2003; Baker and Yu, 2001; Morata and Ripoll, 1975).
Cells lost in competition die by apoptosis, but how the apoptotic program is initiated is not clear (de la Cova et al., 2004; Moreno et al., 2004; Moreno et al., 2002).
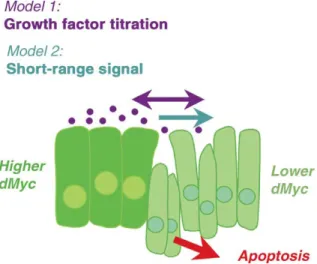
Two models have been proposed to explain how cell competition occurs (Fig. 8). In one model, less competitive cells are deprived of growth factors due to the capture of such factors by their more competitive neighbors (Milan et al., 2002). The elimination of cells unable to receive Dpp, Wg, or EGF is certainly consistent with this idea, as is a report that some
Minute cells are deficient in responding to Dpp (Moreno et al., 2002).
However, the predictions that this model makes do not always hold. For example, dMyc expression neither enhances a cell’s response to signals such as Dpp or Wg, nor alters the response of neighboring cells, as would be predicted from a ligand-capture model (de la Cova et al., 2004).
A second model posits that competition is due to secretion of a factor that initiates an apoptotic program in neighboring cells. This model comes from the observation that although physical contact is not necessary for wildtype cells to be killed, they must be in close proximity to dMyc-expressing cells (de la Cova et al., 2004). Thus, dMyc may allow cells to sense each other’s presence, and induce competition via a short-range signal.
Interestingly, many of the Minute genes, as part of the large number of genes involved in ribosomal biogenesis, are dMyc transcriptional targets. Also, as mentioned above, dMyc expression is influenced by Wg and Dpp. These observations might imply that cell competition involving dMyc, a reduction in ribosome biogenesis, or lack of patterning factors, operate by the same mechanism. However, this has not been demonstrated, and the molecular mechanism of cell competition remains to be established.
Figure 8. Two models to explain dMyc induced cell competition. (1) cells expressing
more dMyc deprive their neighbors of growth and/or survival factors and (2) dMyc expressing cells induce a short-range signal that kills nearby cells that express less dMyc [Modified from: de la Cova and Johnston 2006].
dMYC PROTEIN STABILITY AND DEGRADATION
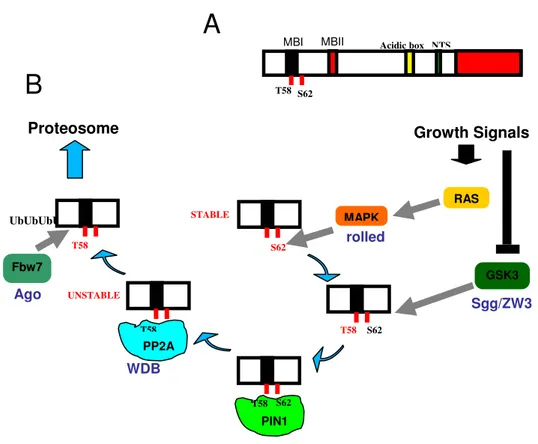
Given myc importance in the regulation of many different aspects of a cell’s life, like growth, proliferation and apoptosis, its expression is tightly regulated by multiple signaling events acting at transcriptional, translational and post-translational levels (Bernard and Eiles, 2006; Vervoorts et al., 2006). Phosphorylation is one of the most relevant post-translational mechanisms by which Myc stability is regulated and has been described in depth for the mammalian c-Myc isoform (Fig. 9)
c-Myc protein is rapidly stabilized in response to Growth Factors, since Ras-dependent MAPK activation is associated with c-Myc phosphorylation at Serine 62 in mammalian cell lines (Sears, 2004). At the
same time, this first event is ment to keep c-Myc presence in the cell under strict control because it triggers a second phosphorylation at Threonine 58, mediated by the Glycogen-Synthase Kinase 3β (GSK3β) (Sears et al., 2000) and subsequently the Serine 62 de-phosphorylation by the phosphatase PP2A. This mono-phosphorylated form of Myc is then recognized and bound by the ubiquitin-ligase Fbw7 that promotes its degradation by the proteasome pathway (Yeh et al., 2004). It must be noticed that GSK3β phosphorylation requires a priming event (Dajani et al., 2001) which, for some proteins such as β-catenin/Armadillo or Cubitus interruptus (Ci), is carried out by members of the CKI family (Jia et al., 2002; Liu et al., 2002; Price et al., 2002; Yanagawa et al., 2002).
Mutations of the Drosophila ubiquitin-ligase archipelago (ago), homologous to the mammalian Fbw7, result in dMyc protein accumulation suggesting that coordination between phosphorylation and ubiquitination is a conserved feature between species (Moberg et al., 2004).
In addition to phosphorylation at its N-terminus, c-Myc protein stability is regulated by phosphorylation in the PEST domain (amino acids 253-266), located near the conserved Acidic Box. Deletion of the Myc PEST domain enhances its protein stability (Gregory et al., 2000).
Although the Drosophila Myc protein (dMyc) is only 26% identical to human c-Myc (the most represented form of the family) over its length, the homology increases up to 57% in critical functional regions such as the Acidic Box and the PEST domain (Gallant et al., 1996). Moreover, dMyc and c-Myc proteins share similar functions; human c-Myc can rescue lethal
dmyc mutations to viability (Benassayag et al., 2005) and dMyc is able to
partially substitute for the proliferation defect of c-myc-deficient mouse embryo fibroblasts (Trumpp et al., 2001).
Taken together all these data promped us to question if Growth Factors and Nutrients ability to control size could be mediated by Myc regulation either at its transciptional or at its protein level.
Figure 8. Regulation of Myc protein stability by phosphorylation. Schematic
representation of Myc protein domains important for its stability (A). RAS/MAPK signaling activated by Growth Factors triggers Myc phosphorylation at Ser62 which results in its stabilization. At the same time the presence of this phosphate allows GSK3β binding and phosphorylation at Thr58. This second event targets Myc for degradation through the proteasome since PP2A is now able to remove the phosphate group on Ser62. Thr58 mono-phosphorylated Myc protein bound to the ubiquitine ligase Ago is sent to proteasome for degradation.
Sgg/ZW3
dodo UbUbUbUb
PP2A
MBI MBII Acidic box NTS
T58 S62 T58 S62 T58 T58 S62 STABLE T58 S62 PIN1 rolled Growth Signals RAS MAPK GSK3 UNSTABLE Proteosome Fbw7 Ago WDB
B
A
Thesis outline
Throughout development cellular and organ growth are regulated in a coordinated manner. Each cell and organ integrates hormonal signals, nutrients availability and intrinsic developmental programs to gain the correct final size.
Description of pathways involved in these processes and the way they are integrated is important to understand how the growth control is achieved during development and provides new insights into mechanisms that cause aberrant growth in diseases as cancer.
In recent years, biochemical analysis in cell culture and genetic dissection of growth control in model organisms allowed the identification of two evolutionarily conserved signaling pathways devoted to size determination: TOR signaling that responds to nutrients availability, and Insulin signaling involved in growth control in response to hormonal stimuli. Genetic studies suggest that a fine coordination between these two cascades exist that prevent a cell to divide prior it has reached a critical weight.
Molecular mechanisms involved in this coordination are still poorly understood, nevertheless TOR and Insulin signalings are well conserved between Drosophila and vertebrates making the fruit fly an excellent model for studying the relative role of these two pathways in growth regulation.
With regard to Myc protein, its involvement in size control has long been known. Mice and flies carrying a hypomorphic mutation of the myc
gene are smaller in size. Moreover, genomic and functional analysis suggests an involvement of a great percentage of genes transactivated by dMyc in metabolism regulation, ribosome biogenesis, protein synthesis and cell cycle progression.
Growth Factors have been shown to rapidly stabilize Myc protein in mammalian cells, subsequent to activation of the Ras-ERK/MAPK cascade (Sears et al., 1999). At the same time our previous data clearly demonstrated dMyc protein up-regulation subsequent to Insulin and EGF subministration in Drosophila S2 cells.
These results prompted us to further investigate, in an in vivo model, growth controlling mechanisms that show a dependence on Myc. Our analysis ranges from the characterization of dMyc protein stability to the dissection of InR/TORC1 pathway in order to understand Myc contribution to Growth Factors and Nutrients mediated growth.
In fact, although a direct modulation of myc expression and/or protein stability from signaling controlling cellular and organismal growth could be predicted, until now it has never been observed in vivo due to the instability of Myc protein. To overcome this issue it is now available a new method of inducible gene expression that renders the UAS-Gal4 system conditional to the presence of a steroid in the culture medium (Rogulja and Irvine, 2005). This way it became possible to induce the transgene expression when the clone reached the appropriate size and, at that time, to check for the gene of interest.
In this work we were able to highlight the mechanism that leads to dMyc protein stabilization and to demonstrate a synergic behaviour of Insulin/TORC1 pathways on Myc proto-oncogene both in vitro and in vivo. Moreover we observed for the first time a genetic interaction between Myc and Rheb that seems to be TOR independent, opening new interesting perspectives toward the understanding of growth regulation.
Materials and Methods
Cell culture and Western blot
Drosophila Schneider S2 cells were grown at 25° C using Schneider
medium (GIBCO) supplemented with 10% heat-inactivated FCS and 100 U.I. of penicillin/streptomycin (GIBCO).
Treatment with Insulin and inhibitors: S2 cells were serum starved in 0.1 % serum for 12 hrs then various chemical inhibitors were added to the medium together with 1 um/ml of Insulin (from porcine Sigma) for 4 hrs at 25 °C. Cells were washed in PBS and lysed using a buffer containing 50 mM HEPES pH 7.4, 250 mM NaCl, 1mM EDTA, 1 % Triton and protease inhibitors. After measurement of the protein concentration, using the Biorad-kit, proteins were separated by SDS-PAGE, electrotransferred to a nitrocellulose membrane, subjected to Western blot analysis with specific antibodies, and visualized by ECL-Plus (Amersham Pharmacia Biotech). Chemical Inhibitors were 10 µM for Wortmannin, 100 nM for Rapamycin 10 µM for LiCl, 50 µM for MG132, 10 mM for Okadaic Acid, 10 µM for CHX (Sigma), 10 µM CKI-7 (US-Biological).
Primary antibodies were: anti-dMyc mAb (Prober et al., 2004 1:5); anti-actin mAb and anti vinculin mAb (1:3000 Sigma), anti HA (1:1000 Sigma).
Quantitative real-time PCR
Drosophila S2 cells were reared at the indicated condition (see Results)
and total RNA was extracted using the RNeasy kit (Qiagen) and on-column DNase digestion to eliminate genomic DNA contamination. Reverse transcription was carried out with oligo-dT primers on 1 µg of RNA per sample using the Omniscript RT kit (Qiagen). For quantitative real-time PCR we used SYBR green PCR mastermix (Applied Biosystems) on a ABI 7900HT machine, and the following primer pairs:
rp49 (ref): 5’- AAACGCGGTTCTGCATGAG -3’ (reverse), 5’- GACGCTTCAAGGGACAGTATCTG -3’ (forward); dmyc: 5’- CATAACGTCGACTTGCGTG-3’ (reverse),
5’- GAAGCTCCCTGCTGATTTGC -3’ (forward); fibrillarin (ref): 5’- ATGCGGTACTTGTGTGGATG -3’(reverse),
All PCR reactions were carried out in triplicate, and control PCR-reactions on “no RT” templates (i.e. templates which had been mock reverse-transcribed) confirmed that genomic DNA had been efficiently removed.
Microarray analysis
S2 cells were seeded in 6 wells plates, washed, and 15 µg of dsRNA against dmyc or lacZ in 3 biologically independent replicates were added in each well in serum free medium. After for 12 hrs cells were treated with
Insulin for 4 hrs, then washed and lysated as described (Hulf et al., MCB 2005). Total RNA was harvested from the different samples and processed for analysis on Affymetrix whole-genome microarrays v 2.0
Fly lines
Fly stocks were obtained from the Bloomington stock center, with the exception of: • yw; UAS-Dp110 • yw; UAS-PTEN • UAS-Rheb • tor2l1/TM3 • w; FRT82>Rheb7A1/TM6b
kindly provided from H. Stocker ETH-Zurich;
• yw, dmycPL35, tub>FRT>(dmyc-cDNA)>FRT>GAL4, ey-Flp / Y • w, dmP0 tub-FRT>(dmyc-cDNA)>FRT GAL4 ey-Flp / Y
• yw, dm+ tub-FRT>(dmyc-cDNA)>FRT GAL4 ey-Flp / Y characterized in Bellosta et al., PNAS 2005
• hs-Flp; tub-Gal4, UAS-GFP; FRT82>tub-Gal80 [Hs-CD2] were a gift from M. Zecca, Columbia Medical Center, NYC; • UAS-dco3
• FRT82B dco3/TM6B stocks were a gift from M. Noll;
from our collaborator J. Jiang, UT Southwestern Med Center, Dallas, TX, USA
Clone Generation and Transgene Induction
For generation of Flp-out clones, flies of the genotypes • w, hs-Flp;UAS-dp110
• yw, hs-Flp;UAS-PTEN, • yw, hs-Flp; UAS-Rheb/CyO, • yw, hs-Flp; UAS-Tor
• yw, hs-Flp; UAS-TorTED
were crossed to UAS-GFP; Act-Gal4:PR/TM6b flies (Rogulja and Irvine, 2005). Flp-out clones were then generated by heat shock for 30 min at 37°C. Heat shocks were performed 48h AEL.
Gal4:PR was activated by transferring larvae to instant food (Instant
Drosophila Medium, Connecticut Valley Biological) containing RU486
(Mifepristone, Sigma). Two grams of instant food was mixed with 7 ml of water previously supplemented with RU486, resulting in a final concentration of 20 µg/ml of Mifepristone.
For generation of MARCM clones, flies of the genotype: • w; UAS-dMyc; FRT82>Rheb7E1/TM6b
were crossed to a hs-Flp; tub-Gal4, UAS-GFP; FRT82>tub-Gal80 [Hs-CD2]. Mitotic clones were then generated by heat shock for 1 hr at 37 °C, 48 and 72hrs AEL and detected with an α-CD2 staining (M. Zecca) and GFP visualization.
Analysis of cell size and number in the adult eyes
Flies were reared at 25 °C under reproducible growth conditions and were age matched (3 days old males) before determin the ommatidial size and number. Ommatidia were counted from scanning electron micrographs (SEM) pictures. From the same photographs, the size of the ommatidia was calculated by measuring the area of 20 ommatidia located in the center of the eye using Adobe Photoshop as previously reported (Bellosta et al, PNAS 2005).
Immunofluorescence analysis
Third instar larvae were dissected in PBS 1X. Imaginal wing or eye discs collected were fixed in 4% paraformaldehyde/PBS for 20 min at room temperature, washed twice in PBS 1X then permeabilized by repeated washes in 0.3% Triton X-100/PBS prior to incubation with specific antibodies.
All antibodies incubations were performed in 3% BSA/PBT. Primary antibodies used were mouse dMyc (Probe and Edgar 1:5); mouse anti-CD2 (a gift from M. Zecca 1:1000) rat anti-caspase-3 (DHSB 1:200); rat anti-ELAV (DHSB 1:1000). Secondary antibodies were anti-mouse Alexa Fluor 555 (Invitrogen 1:200); anti-rat FITC (Invitrogen 1:200). After washing, discs were mounted in Mowiol and analyzed in a confocal microscope. Images were processed using LSM Image browser (from Zeiss) and Adobe PhotoShop software at 20X and 40X magnification.
GENETICS
UAS-Gal4 system (Brand and Perrimon, 1993)
The UAS-Gal4 is a binary system that allows, in the fly, to study the effects of the ectopic expression of a gene of interest.
Gal4 is a powerful transcriptional activator of Saccharomyces
cerevisiae, that recognizes and binds to specific regulatory sequences
called UAS (Upstream Activating Sequences).
In Drosophila it is possible to construct two separate transgenic lines. A first line contains the Gal4 sequence under the control of a regulatory element of a Drosophila’s gene, that can induce the expression in specific moments of development and in specific body districts. The second line contains a construct in which the cDNA sequence of the transgene of interest is put downstream one or more UAS elements.
By crossing those 2 lines it is possible to originate a progeny containing both constructs, and this allows the expression of the Gal4 transactivator, that in turn activates the gene put under the UAS control in a pattern-specific manner (Brand and Perrimon, 1993).
A large series of promoters exists stored in stock centers (the most important is the Bloomington Stock Center) that can drive Gal4 expression in defined types of cells or tissues; it is also possible to drive Gal4 expression by a heat shock promoter, that permits a temporal control of induction.
The use of UAS-hairpin constructs further allows to silence post-transcriptionally the expression of certain genes (UAS-RNAi).
FLP-FRT (Xu and Rubin, 1993)
In Drosophila the yeast binary sistem FRT-Flp that allows site-specific recombination is broadly used.
The Flippase (Flp) recombinase induces recombination at the level of specific sequences called FRT (Flippase Recognition Targets) (Golic and Linquist, 1989).
This system can be used to generate genetic mosaics to study LOF mutations.
Stocks are available with the FRT sequence in the pericentromeric region of all the chromosome arms, this allows the exchange of the entire chromosome arm by mitotic recombination.
Mitotic recombination by Flp activation can be induced in heterozygous mutants for a gene of interest; as a result it is possible to obtain a clone homozygous for the mutation and a wild type twin clone (Xu and Rubin, 1993).
The possibility to generate homozygous mutant clones is very useful in the study of lethal recessive conditions and to investigate cell-cell specific interactions. Most commonly, Flp is expressed under the control of a heat-shock promoter (hsFLP) as it ensures the possibility to control either the developmental stage in which to induce recombination or the clone number that is related to heat pulse length; the distribution of clones is instead random within the animal.
Flp - Out (Neufeld, 1998)
The FLP-Out technique permits the overexpression of a UAS controlled sequences in a clone of cells. A FLP-Out construct consists of a constitutive promoter (i.e. actin or tubulin) followed by an FRT sequence, a marker with a polyA terminator, a second FRT sequence and a Gal4 sequence.
The Flippase expression can induce the excision of the DNA fragment between two FRT sites, and the constitutive promoter can thus transcribe the Gal4 sequences. This, in turn, permits the expression of all the UAS-transgenes present in the line. Most of the time, a FLPout line also carries a cell marker (GFP or LacZ) under the UAS control.
In this essay (see results) we made wide use of this technique. In particular we worked with a FLP-Out line, in which the Gal4 transcriptional activity is rendered conditional to the presence of an hormone (Mifepristone)
in the medium. This allowed us to limit the UAS-transgene expression to a shorter window of time late in development in order to analize its effect on dMyc protein right away (Rogulja and Irvine, 2005)
MARCM system (Lee and Luo, 1999)
The MARCM system (Mosaic Analysis with a Repressible Cell Marker) (Lee and Luo, 1999) allows to generate homozygous mutant cells uniquely in mosaic tissues.
To achieve this goal, the yeast GAL80 protein was introduced into the GAL4-UAS binary expression system in Drosophila (Brand and Perrimon, 1993). The MARCM system initially contains cells that are heterozygous for
a transgene encoding the GAL80 protein, which inhibits the activity of the GAL4 transcription factor.
Following FLP/FRT-mediated mitotic recombination, the GAL80 transgene is removed from one of of the two daughter cells, thus allowing expression of a GAL4-driven reporter gene specifically in this daughter cell and its progeny (see figure). If a mutation is present on the chromosome arm in trans respect to the GAL80 transgene, the uniquely labeled GAL80-negative (GAL80-/-), Gal4 expressing cells should be at the same time homozygous for this mutation. Therefore, using the MARCM system, it is possible to specifically label clones of cells homozygous for any mutation in a mosaic tissue.
In particular the MARCM system has shown to be useful in the study of genetic interactions because of its ability to generate LOF clones for recessive mutations in which it is possible to overexpress any other gene under the control of a UAS element.