Chapter 7
Rheological formulation and characterization for soft ice cream emulsions
7.1 Introduction
Foam has been used in food production since ancient times. Ranging in texture from light and airy (beer or soufflé) to dense and solid (bread and ice cream), foams create unique textures and sensations [Campbell and Mouget, 1999]. When the gas phase volume is low, the bubble remains spherical and these are called bubbly foams. As the gas phase exceeds a critical packing volume, the bubbles press together generating polyhedral (honeycomb) shapes and these are called polyhedral foams [Dickinson, 1992]. The incorporation of air into a food product imparts lightness as well as provides better texture and mouth feel [Bee R. D et al., 1987]. Some products that benefit from air incorporation are ice cream, confectionery, salad dressings and mayonnaise.
Foams are also classified on the basis of rheological properties, such as being solid or liquid [Weaire and Hutzler, 1999]. Noda and Shiinoki (1986) investigated the mechanism of foam formation during whipping by observing change in rheological properties. They concluded that whipped cream exhibited viscoelastic behaviour, and almost all air was introduced in the early stages of whipping.
In the last few years the study of aerosol whipped products has been the subject of increasing interest. The term “instant” is used in relation to products which, compared to an analogous product, are prepared relatively quickly and easily. Among these food products are some instant foam like whipped cream, which can be freshly whipped and aerosol whipped. Some aspects of these two products are often compared, because both foams are characterised by specific properties. For example, aerosol whipped cream is characterised by a high overrun of approximately 400-600%, whereas the overrun of fresh whipped cream is about 100-150%. However, the advantages of whipped fresh cream is the firmness provided by bridges of aggregated fat globules connected to adjoining air bubbles and by adsorption of single globules or groups of globules onto more than one bubble [Anderson and Brooker, 1988].
Emulsions and foams are systems often present in foods having specific organoleptic and structural characteristics, their relevant element is the presence of air, incorporated as small bubbles, to provide specific texture [Stanley et al., 1996; Campbell and Mougeot, 1999; Kloek et al., 2001]. A specific type of foam, largely adopted in the food industry, is characterized by cells having walls built by a
pre-existing emulsion [Stanley et al., 1996]. Those foams are quite common in dairy products and they can be consumed either in the frozen state, ice cream, or in the unfrozen state, whipped cream; both products are characterized by the presence of gas introduced in a different way. As previously stated, aerated systems are quite common in the food industry owing to their characteristic properties related to gas cells entrapped into a viscoelastic medium. Special attention is often paid to dairy foams: three-phase systems where the liquid matrix is an emulsion. An interesting novel application of dairy foams is based on products similar to instant whipped creams, in appearance, but with an ice cream taste: soft ice cream. This type of new product is stored and consumed at low temperatures, and in this case an “optimal” rheological behaviour is necessary to obtain the desired products: consisting in an aerated food containing the proper amount of gas. In fact, high elasticity is required to improve gas retention and to give the typical texture, but low viscosity at low temperature is necessary to allow the foam flow through a nozzle under a usually quite low driving force.
Ice cream production is usually obtained by pressure beating [Campbell and Mougeot, 1999], i.e. dissolution of air or gas under pressure, followed by a freezing process and a hardening period [Friberg and Larsson, 1997]; the foamed structure, obtained by this procedure, is very fine and it is usually stabilized through the combined action of ice crystals, fat globule network and highly viscous aqueous phase. Whipped cream can be produced both by partial aeration of the liquid phase during whipping or, most commonly, by gas injection, [Campbell and Mougeot, 1999] i.e. expansion of gas bubbles initially introduced, under pressure, into the liquid matrix (instant whipped cream), in both cases the product is stabilized only by a network made of fat particles, coalesced because of the shearing action of the whipping, and no ice crystals are present [Stanley et al., 1996]. The two products, therefore, have different properties, related to the different formation and stabilization mechanisms, but similar void fractions that are approximately 50% (v/v).
Industrial ice cream is prepared by aeration and extrusion at high pressures, and it is not possible to adopt the same machine for a “seller point” or “home made” production for safety reasons. A “simple” solution is based on aeration at atmospheric pressure: air is entrapped by a vigorous mixing of the liquid phase and then cells are retained by freezing the emulsion. In this case the amount of entrapped gas is quite low (poor overrun) but it is stabilized by a frozen structure. The obtained product does not have good organoleptic properties because of the low amount of entrapped gas, giving a “hard” texture close to a frozen food. A different solution involves the aeration of the liquid phase under low pressure (i.e. 4-8 bar), using also gases different from air, the foam is, then, extruded either by mechanical systems (e.g. at seller points) or by using the same gas introduced for the aeration (e.g. for home
production). In both cases low pressures are used, bubble expansion is due to the change of the external pressure during extrusion and gives a larger overrun and a particular smooth texture. However, gas retention is mainly due to emulsion film properties because the presence of an unfrozen structure even if temperatures, usually, range between 0°C and -18°C. Therefore an “optimal” rheological behaviour is necessary to obtain the desired product consisting in an aerated food, containing the proper amount of gas, still liquid at a given temperature, i.e. with a low freezing point. In fact, usually, high elasticity, particularly at the interface, is required to improve gas retention [Fyrillas et al., 2000] and to give the typical texture, but low viscosity at low temperature is necessary to allow flowing inside the nozzle under a relatively small pressure drop. Even though aerated foods are largely diffused, only the chemistry of these systems has been reasonably extensively studied, relatively neglecting the dynamic physical behaviour of the foam [Campbell and Mougeot, 1999].
The rheological properties, or most commonly the texture, of a product depend both on ingredients (i.e. formulation) and on process conditions (i.e. temperature and pressure); these “variables” are strictly related and it is not possible to study them separately.
This chapter aims to study the rheological properties of different formulations and the influence of the process conditions to obtain a proper match between them. Emulsions having different compositions were prepared and characterized in order to evaluate the effects of some ingredients on the foam properties and with the purpose of finding the better formulations for the extruding by aerosol system.
7.2 Materials and methods
The main ingredients of emulsions in dairy applications (like whipped cream or ice creams) are fats, water, sugars, emulsifiers, proteins and stabilizers [Friberg and Larsson, 1997]. It is well-known that stabilizers play a key role for their capability to increase emulsion life and to entrap air cells, giving the desired texture [Stanley et al., 1996], emulsifiers and proteins are surface active components reducing the surface tension and affecting droplet size and size distribution [Campbell and Mougeot, 1999, Wilde et al., 2004], fats (usually added as cream milk) build the three-dimensional network that stabilize the structure [Stanley et al., 1996; Friberg and Larsson, 1997; Dalgleish, 2006], sugars decrease the freezing point and, together with fats, give typical organoleptic properties to ice creams [Friberg and Larsson, 1997]. In this work the effects of some of these ingredients were experimentally investigated, with the aim of preparing emulsions for cold applications; samples were prepared on a lab scale starting from a common recipe, often adopted for commercial dairy emulsion, based on milk and
powdered skimmed milk (79.5% w/w), hydrogenated vegetable fats (4% w/w), a mixture (16% w/w) of glucose syrup and dextrose, a mixture (0.5% w/w) of emulsifiers (fatty acids mono and diglycerides) and stabilizers (carrageen and guar gum) having a 3:1 weight ratio. The base recipe (indicated as sample E1) was modified by replacing some ingredients or by changing the emulsifiers/stabilizers ratio, as shown in table 7.1, according to empirical information and a practical knowledge concerning different cream formulations. Dextrose in sample E2 was replaced by the less expensive sucrose it also having a taste better accepted by consumers and higher sweetness rating [Friberg and Larsson, 1997]; cream milk was added in sample E3 to increase the fat content and to stabilize the structure while decreasing the freezing point; the amount of stabilizer was increased in E4 to enhance the stability and “consistency” of the emulsion. All ingredients (kindly supplied by Codap S.p.A., Marcianise, Italy) are commercial products, commonly adopted in industrial processes, and used without further purification because the present work aims to describe the behaviour of commercial dairy emulsions and not “simulating systems”.
ID Base emulsion
Replaced ingredient Replacing ingredient Homogenisation device FP [°C] E1 - - - Ultra Turrax, sonifie -9 E2 E1 50% (w/w) of dextrose Sucrose Ultra Turrax,
sonifie
-6 E3 E2 22% (w/w) of milk Milk Cream Ultra Turrax,
sonifie -10 E4 E1 Emulsifier/ Stabilizers=3 Emulsifier/ Stabilizers=1 Ultra Turrax, sonifier -9 E5 E3 4.5% (w/w) of milk Glycerol Pressure
homogeniser
-12
E6 E5 - - Pilot Plant -12
E7 E6 - New emulsifier Pilot Plant -14
Table 7. 1 – Sample description and freezing point (FP) values
Samples were prepared by mixing all the ingredients, according to a predefined order, at 70°C for 55 min by Ultra Turrax (T50 Basic, IKA-Werke, Germany) to pre-emulsify the sample; the mixture was held at 0°C allowing 15 min rest time and then put in an ultrasound bath (Transsonic T310, ELMA, Germany) for 15 min to further decrease the particle size [Behrend & Schubert, 2000]. Finally, samples were held at 0°C for 3 hours and then stored at 4°C before testing. To evaluate the effect of different homogenisation procedures, some emulsions were prepared by using a similar procedure, but replacing the Ultra Turrax by a high shear mixer (Silverson, UK) and the ultrasound bath with a two-step
pressure homogenizer (APV Gaulin, APV, UK) available at Cremal laboratory, working at 150 bar (first step) and 30 bar (second step), no rest time between mixing and homogenisation was allowed; in this case the emulsification is achieved by forcing the liquid through a small valve opening [Friberg and Larson, 1997]. Sample E5 was prepared starting from sample E3 and replacing 4.5% (w/w) of milk with glycerol (to bind water decreasing the freezing point). Finally, sample E6 (having the same composition as E5) was prepared on a pilot plant, available at the Cremal laboratory, simulating a real industrial production, including the sterilization process, to check the effect of the thermal treatment on emulsion properties. In this procedure, after mixing, the liquid phase was sent to a thermal treatment unit, working at 150°C, to a cooler (90°C) and then to a pressure homogeniser working at previously described pressures. Finally, the last sample E7, is the same as sample E6 but with a new emulsifier. In order to make a quantitative analysis of the considered recipe changes, a rheological characterization was performed by using a controlled strain rheometer (ARES-RFS, TA Instruments, USA), equipped with parallel plate geometry (φ=50 mm) and Peltier temperature control. Frequency sweep tests were performed, increasing frequency from 0.1 Hz to 10 Hz, at 4, 0, -5 °C in the linear viscoelastic region (previously determined by strain sweep tests at 1 Hz). The viscosity was evaluated, at the same temperatures, increasing shear rate from 0.1 to 100 s-1, allowing the proper measurement time (determined by step shear rate tests) to reach the steady state conditions.
Finally, time cure tests at 1 Hz with a ramp rate of -1°C/min (from 4°C to emulsion freezing) and time sweep tests were used to detect a “dynamic” freezing temperature by rheological measurements [Hetzel et al., 2000]. All tests were not affected by water loss problems owing to the low temperatures adopted. Reported data are the average value of three repetitions.
7.3 Materials characterization: dynamic tests.
A typical frequency sweep is shown in Figure 7.1 for sample E1 at -5°C; it can be seen that, in the considered frequency range, both moduli have an almost linear trend in a log-log scale, with G’ greater than G”. A similar trend was found also at different temperatures and for different samples. According to the weak gel model [Gabriele et al., 2001], foods can be described as weakly structured systems having a three-dimensional network with rheological “units” connected by weak bonds. The network extent and the strength of these bonds can be evaluated by fitting dynamic data, in terms of complex modulus G*, by using a power law equation:
( )
z 1* ω A ω
G = ⋅ (7.1)
where z and A are interpreted as a measure of the network extent and strength respectively [Gabriele et al., 2001]. 1 10 100 0.1 1 10 Frequency [Hz] G', G'' [Pa]
Figure 7. 1 – Frequency sweep test for sample E1 at -5°C.
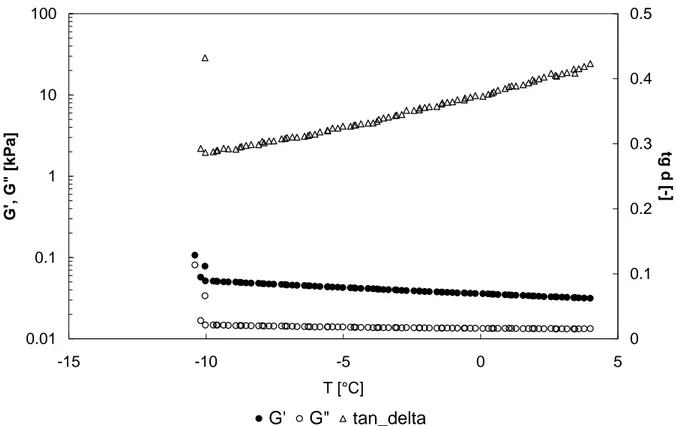
In table 7.2 values obtained for sample E1 at different temperatures, are shown; it can be seen that, in the considered range, the system is quite stable and only a slight structural change is exhibited as confirmed by the increasing values of both A and z. The time cure of sample E1 is reported in figure 7.2 and the increasing trend of the loss tangent with decreasing T, evidence that structure changes slightly and the sample becomes more “solid-like”; this is probably due to initial freezing effects like crystallisation centres forming. When a critical low temperature is reached, approximately at -10°C, both moduli diverge, owing to the possible formation of ice crystals, and rheological behaviour of the emulsion strongly changes, giving torque values usually higher than the rheometer upper limit (maximum torque 0.1N⋅m). This critical temperature, however, could be affected by the adopted operating conditions i.e. the temperature ramp rate, oscillation frequency and gap between plates; according to Hetzel et al. (2000) the dynamic freezing point shows no dependence on frequency and
gap, whilst an effect of the ramp rate was found for values greater than 5 °C/min. The ramp adopted in this work (1°C/min), lower than that limit, should be adequate, however, to ensure the measurement of a material property not dependent on the ramp rate. Time sweep tests were performed at different increasing temperatures, starting from the previously detected critical value; the freezing point was, finally, assumed as the temperature at which dynamic moduli diverge during time sweep in a time window of 10 minutes. Results obtained for sample E1 (Figure 7.3) show that at -8°C, loss and storage moduli are almost constant in the considered time range, whereas at -9°C a sharp increase is found, for both of them, after 40 s; therefore the value of -9°C was assumed as freezing temperature for this sample.
T [°C] A [Pa·s1/z] z [-] k [Pa·sn] n [-]
4 35±2 4.5±0.1 3.7±0.3 0.43±0.02
0 39±6 4.62±0.06 3.7±0.3 0.44±0.02
-5 44±9 5.1±0.1 4.3±0.3 0.44±0.02
Table 7. 2- Weak gel model parameters (A and z) and viscosity power law (k and n) for sample E1 at different temperatures
0.01 0.1 1 10 100 -15 -10 -5 0 5 T [°C] G' , G" [kPa ] 0 0.1 0.2 0.3 0.4 0.5 tg d [ -] G' G" tan_delta
10 100 1000 10000 100000 0 50 100 150 200 250 300 350 400 time [s] G' G '' [P a ] T=-8°C G' T=-8°C G'' T=-9°C G' T=-9°C G'' Figure 7. 3 – Time sweep tests at -9 and -8°C for sample E1
The values obtained by this rheological method are usually different from the classic freezing points determined in static conditions by thermal analysis [Hetzel et al. (2000)], probably because of the different test conditions (surface to volume ratio, sample amount) and to the transition criterion: a sharp change in enthalpy, owing to the melting latent heat, for thermal analysis, a sharp change in rheological properties in the present case. The latter, being related to mechanical properties, probably, better addresses the flowing conditions and could be more useful when the fluid dynamic behaviour of these materials is studied. In addition the dynamic freezing point should be less affected by crystal growth inhibition problems (small volume and extremely smooth clean surface in DSC) than the DSC transition temperature, therefore it should be much closer to the real situation and much more practice-oriented [Hetzel et al. (2000)].
All samples were subjected to the same rheological tests, the results obtained, in terms of weak gel parameters are shown in tables 1-6 in Appendix II and the freezing temperatures are reported in table 7.1. An evident effect of the different formulations is the freezing point (FP) change; it is well-known that dextrose is able to bind water, giving a higher cryoscopic depression than sucrose [Spiliotis and Tassios (2000), Friberg and Larsson (1997)], therefore sample E2 has a higher FP (-6°C) than sample
E1. On the contrary, the addition of fats (sample E3) or glycerol (E5), or the increase in stabilizers (E4) has the opposite effect, that of reducing the FP. It is worth remembering that sample E5 was prepared by using a pressure homogeniser, therefore the reduced FP could be also affected by a different structure and droplet and distribution size. The sample E6 exhibits the same value as E5, therefore the adopted thermal treatment did not affect this parameter. This is in good agreement with the literature concerning the freezing point of UHT heated milk, which seems not to be dependent on the thermal treatment [Rattray et al. (1997)]. Finally, for the sample E7 there is a very low FP of -14 °C owing to the change in emulsifiers.
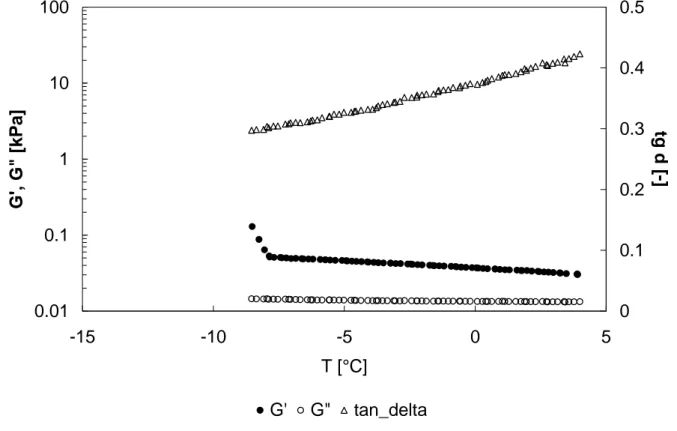
When rheological parameters are considered, it can be noticed that no significant difference is found between samples E1 and E2, in terms of both A and z parameters (Table 7.2 and 1 in appendix II), because they differ only for the type of sugar (a disaccharide instead of a monosaccharide) which does not strongly affect the rheological properties; for both samples an increase in z, at decreasing temperatures, was obtained, as confirmed also by the loss tangent behaviour during time cure (Figure 7.3-7.4). 0.01 0.1 1 10 100 -15 -10 -5 0 5 T [°C] G' , G" [k Pa ] 0 0.1 0.2 0.3 0.4 0.5 tg d [-] G' G" tan_delta
Figure 7. 4 – Time Cure at 1°C/min for sample E2
as shown by the z value (Table 2 in Appendix II), whereas no difference was found at -5°C; in addition the strength of the interactions (as shown by A values) is larger than in the previous sample probably owing to the increased amount of fat globules, as found in previous works in the literature [Adapa et al. (2000)]. Both frequency sweep tests at different temperatures and time cure (Figure 7.5) show a larger temperature stability, in the considered range, maybe owing to the increased content in fats that, increasing bulk protein concentration due to excluded volume, reinforce the gel strength [Reiffers-Magnani et al. (1999)]. 0.01 0.1 1 10 100 1000 -15 -10 -5 0 5 T [°C] G', G" [kPa] 0 0.1 0.2 0.3 0.4 0.5 tg d [-] G' G" tan_delta
Figure 7. 5 – Time Cue at 1°C/min for sample E3.
Larger differences were exhibited by sample E4, where carrageen and guar gum, used as stabilizers, show a strongly structuring effect, causing an increase of both z and A (Table 3 in Appendix II), because of their well-known jellying effects [Ross Murphy (1985)]. Only the strength of interactions, A, increases with decreasing T, probably owing to kinetic effects, this is also confirmed by the nearly constant loss tangent during time cure test in the considered temperature range (Figure 7.6).
0.01 0.1 1 10 100 -15 -10 -5 0 5 T [°C] G', G" [kPa] 0 0.1 0.2 0.3 0.4 0.5 tg d [-] G' G" tan_delta
Figure 7. 6 - Time Cue at 1°C/min for sample E4.
When sample E5 is compared to the previous ones, lower values of both A and z (Table 4 in Appendix II) were found at all tested temperatures, this could be due to both different formulations and preparations; indeed it is well-known that the homogenisation process had a relevant effect on droplet size and size distribution mainly depending on the effective amount of energy received by the sample that could be different from the energy supplied by the device [Friberg and Larsson (1997), Asua (2002)]. It was found that at equal power, applied per unit volume, the high pressure homogenizers are efficient devices giving the smallest droplets, whereas the sonifiers and the rotor-stator systems seem to be less effective [Asua (2002)]; however, for high pressure homogenizers, a dependence on the adopted valve was found and Behrend and Schubert (2000) found that the sonifier gives smaller droplets than pressure devices except when the Microfluidizer ® is adopted.
Comparing sample E3 and E5 (differing in formulation only for a reduced amount of milk replaced by glycerol) it can be seen that dynamic moduli are consistently lower for E5 as better shown by weak gel model parameters. According to Pal (1997) upon reduction of droplet size the emulsions become much more elastic and viscous and both the storage modulus and steady shear viscosity undergoes a substantial increase when droplet size is reduced. Starting from these considerations it can be supposed
that at the adopted pressure the homogenizer was less efficient than the sonifier, since it gives larger particles and, therefore, a lower structure extension. However, the same temperature stability as sample E3 was found ,as confirmed by an almost constant loss tangent (Figure 7.7), probably because it is more dependent on formulation than on drop size distribution, in the considered temperature range.
0.001 0.01 0.1 1 10 100 -15 -10 -5 0 5 T [°C] G', G" [k Pa ] 0 0.1 0.2 0.3 0.4 0.5 tg d [-] G' G" tan_delta
Figure 7. 7 - Time Cure at 1°C/min for sample E5.
Then sample E6 shows lower values of both A and z (Tab.7) than sample E5, probably owing to the thermal treatment that could have damaged the structure. Indeed, it is known that heat treatment causes casein denaturation and fat globule aggregation, forming large clusters [Friberg and Larsson (1997)], therefore the resulting three-dimensional network could be characterised by a lower number of rheological units having weaker bonds. However, also for this sample a good temperature stability, in the considered range, was found (Figure 7.8).
0.001 0.01 0.1 1 10 100 -15 -10 -5 0 5 T [°C] G', G" [kPa] 0 0.1 0.2 0.3 0.4 0.5 0.6 tg d [-] G' G" tan_delta
Figure 7. 8 - Time Cue at 1°C/min for sample E6.
Finally, because emulsion E6 showed better rheological parameters, a new emulsifier was inserted to improve the FP and the others parameters that have an influence on extrusion process, like viscosity. In fact, looking at table 6 in appendix II, it is possible observe an improvement in the FP, which passes from the value of -12°C for mix E6 to -14°C for emulsion E7. Moreover, the A value is lower than starting emulsion and the z value higher, showing better capability to expansion and bubble rupture because of higher degree of structuring.
0.001 0.01 0.1 1 10 100 -15 -10 -5 0 5 T [°C] G' G" [Pa ] 0 0.5 1 1.5 2 ta n_d [-] G' G" tan_delta
Figure 7. 9 - Time Cue at 1°C/min for sample E7.
7.4 Materials characterization: steady tests.
Flow curves were run at temperatures ranging between -5°C and 4°C for all the considered samples. All the investigated materials showed a marked shear thinning behaviour because, from a structural point of view, they can be considered as dispersions of liquid particles of fat in a medium of water; the increasing shear action destroys the weak bonds among the particles and a decreasing viscosity is found. Experimental viscosity data, for all samples, show a linear trend in a log-log plot, therefore they were fitted by means of a power law model [Barnes et al., 1989]:
n γ k
τ= ⋅& (7.2)
where k and n are consistency and flow index respectively.
Results obtained at different temperatures for sample E1 (Figure 7.10) and power law parameters (Table 7.2), do not show any significant difference, confirming the conclusion that small amplitude oscillations are involved.
Sample E2 is characterised by viscosity values slightly larger than E1, probably owing to the effect of sucrose that usually gives higher viscosity than dextrose at the same weight concentration in water
solutions [Chirife and Buera, 1997]; when k and n are computed (Table 1 in appendix II), a greater temperature dependence, when compared to E1, is found, probably owing to the different sucrose behaviour as confirmed by data obtained in water solution [Chirife and Buera, 1977].
0.1 1 10 100 0.1 1 10 100 Shear rate [s-1] Vi sco si ty [ P a. s] -5°C 0°C 4°C
Figure 7. 10 – Viscosity curves for sample E1 at three different temperatures.
Samples E3 and E4 are characterised by an increase in the consistency index (Tables 2-3 in appendix II) owing to the thickening effect of cream milk and stabilizers, and also by slightly higher flow index values, especially for sample E4; the flow index could be interpreted as a measure of the connectivity change, if it is close to one, it means that the shear rate has poor effects on the structure. Therefore, it seems that the additional ingredients lead to more structured (as shown by the previous dynamic data) and more stable networks during a shear flow.
Sample E5 (Table 4, appendix II), prepared by pressure homogenizer, shows lower consistency index values than previous samples, this could be due to the different preparation, more than to the formulation as discussed for the dynamic tests. Indeed, it is well-known that emulsion viscosity increases with decreasing droplet size [Friberg and Larsson, 1997] and that samples with a broader size distribution have lower viscosities than samples with narrow distributions [Barnes et al., 1989].
Therefore, viscosity data confirm the hypothesis that the pressure homogenizer adopted gave larger particles with a broader size distribution than the sonifier, as previously discussed
Finally, sample E6 (Table 5, appendix II) shows low values for both consistency and flow indices, probably owing to the less extended weak network that is easily broken by the shear action. finally, sample E7 has a consistency higher than reference formulation, but with a lower flow index, which makes the extrusion process from the aerosol can easy.
7.5 Conclusions.
An important conclusion from the presented results is that the best ideal formulation for the soft ice cream emulsion should have a low dynamic freezing point (to avoid ice crystal formation), enough elasticity to entrap gas, high viscosity (to enhance emulsion stability and gas retention) and low temperature dependence; however, it is worth noting that high viscosity and elasticity could make the emulsion flow inside the nozzle difficult, therefore, owing to these properties, a good compromise between two opposite needs is necessary. Among tested emulsions, sample E2 has high FP (usually cold applications range between -8 °C and -18 °C), sample E4 has too high viscosity and dynamic moduli, therefore they do not seem suited to this application; the remaining ones show good characteristics, however, in the following modelling step, interest was focused only on three emulsions, E3, E6 and E7, because they represent slightly different kinds of rheological behaviour and different preparation conditions.
7.6 References
− Adapa S., H. Dingeldein, K.A. Schmidt, and T.J. Herald, “Rheological properties of ice cream mixes and frozen ice creams containing fat and fat replacers”, J. Dairy Sci., 83, 2224-2229 (2000). − Anderson, M. and Brooker, B.E., Dairy foams. In: Advances ib food emulsions and foams.
Dickinson, E. and Stainsby, G. (eds), Elsevier Applied Science, London, 221-255 (1988).
− Barnes H.A., J.F. Hutton, and K. Walters, An Introduction to Rheology (Elsevier Science, Amsterdam, 1989).
− Bee, R. D., Clement, A., & Prins, A., Behavior of an aerated food model. In E. Dickenson (Ed.), Food emulsions and foams, London: the Royal Society of chemistry, pp. 128-143 (1987).
− Behrend O., and K.A.H. Schubert, “Influence of continuous phase viscosity on emulsification by ultrasound”, Ultrason. Sonochem., 7, 77-85 (2000).
− Bird R.B., W.E. Stewart, and E.N. Lightfoot, Transport phenomena (John Wiley and sons, New York, 1960).
− Campbell G.M., and E. Mougeot, “Creation and characterisation of aerated food products”, Trends Food Sci. Tech., 10, 283-296 (1999).
− Chirife J., and M.P. Buera, “A simple model for predicting the viscosity of sugar and oligosaccharide solutions”, J. Food Eng., 33, 221-226 (1997).
− Dalgleish D.G., “Food emulsions – their structure and structure forming properties”, Food Hydrocolloids, 20, 415-422 (2006).
− Dickinson E., An introduction to food colloids, Oxford: Oxford University Press. 207 p. (1992). − Friberg S.E., and K. Larsson, Food Emulsions (Marcel Dekker Inc., New York, 1997).
− Fyrillas M.M., W. Kloek, T. van Vliet, and J. Mellema, “Factors determining the stability of a gas cell in an elastic medium”, Langmuir, 16, 1014-1019 (2000).
− Gabriele D., B. de Cindio, and P. D’Antona, “A weak gel model for foods”, Rheologica Acta, 40, 120-127 (2001).
− Gardiner B.S., B.Z. Dlugogorski, and G.J. Jameson, “Rheology of fire-fighting foams”, Fire Safety J., 31, 61-75 (1998).
− Hetzel F., J. Nielsen, S. Wiesner, and R. Brummer, “Dynamic mechanical freezing points of cosmetic O/W emulsions and their stability at low temperatures”, Appl. Rheol., 10, 114-118 (2000).
− Kloek W., T. van Vliet, and M. Meinders, “Effect of bulk and interfacial rheological properties on bubble dissolution”, J. Colloid Interf. Sci., 237, 158-166 (2001).
− Lindal Group, http://www.lindalgroup.com/
− Marshall N., Enciclopedie des Gaz (Division Scientifique, Elsevier, Amsterdam, 1976).
− Noda, M., & Shiinoki Y., Microstructure and rheological behavior of whipping cream, Journal of texture Studies, 17 (2), 189-204 (1986).
J., 67, 37-44 (1997).
− Rattray W., P. Gallmann, and P. Jelen, “Influence of protein standardization and UHT heating on the furosine value and freezing point of milk”, Lait, 77, 297-305 (1997).
− Reiffers-Magnani, C.K., J.L. Cuq, and H.J. Watzke, “Composite structure formation in whey protein stabilized O/W emulsions. I. Influence of the dispersed phase on viscoelastic properties”, Food Hydrocolloid, 13, 303–316 (1999).
− Ross-Murphy S. B., “Structure-property relationships in food biopolymer gels and solutions”, J. Rheol., 39, 1451-1463 (1995).
− Spiliotis N. and D. Tassios, “A UNIFAC model for phase equilibrium calculations in aqueous and non aqueous sugar solutions”, Fluid Phase Equilibr., 173, 39-55 (2000).
− Stanley D.W., H.D. Goff, and A.K. Smith, “Texture-structure relationships in foamed dairy emulsions”, Food Res. Int., 29, 1-13 (1996).
− Tanner R., Engineering Rheology (Oxford University Press, UK, 2000).
− Weaire D., and Hutzler S., The physics of foams. Oxford, UK: Clarendon Press. 246 p. (1999).7 − Wilde P., A. Mackie, F. Husband, P. Gunning, and V. Morris, “Proteins and emulsifiers at liquid


![181Appendix II T [°C] A [Pa·s](data:image/gif;base64,R0lGODlhAQABAIAAAP///wAAACH5BAEAAAAALAAAAAABAAEAAAICRAEAOw==)