78 This chapter deals with the simulation results for the new BT – Enhanced Data Rate architecture, analysed in the previous sections. It is necessary to clarify when the simulations are running, the critical aspect is the statistic relevance1 of the results [8] [9]. In order to measure the performance of the modem parts, reference will always made to the BER (Bit Error Rate) related to a certain SNR. Thus, as the specifications require, the modem baseband function has been simulated with more than 50ּ104 bits, to obtain a BER value of 10-4 with a relevant precision. First, some simulations have been performed to check the entire functionality of C-simulator and the results are given in comparison of the required specifications. Finally, interesting simulation results are given in order to show the performance and to direct the possible future implementation on chip.
7.1 Preliminary
results
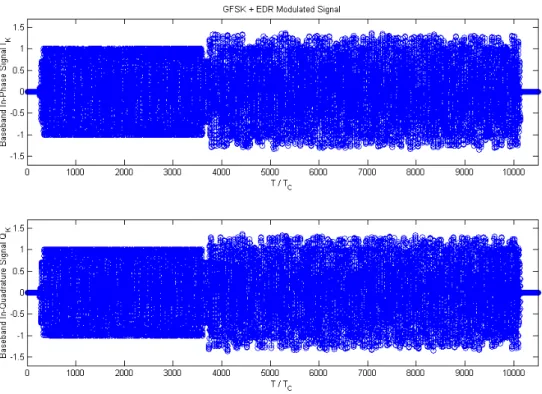
Thanks to an input parameter used inside the C-simulator, it is possible to set the dumping files for a Matlab interface. This has been used during the modifications of the C-program, in order to verify the new implemented algorithm. At this point, it is interesting to have a look to the complete GFSK+EDR modulated signal in order to clearly understand their differences (see Chapter 3). Inside the following figures, both the In-phase and In-quadrature signals are shown. Left side of both the graphs are composed by the GFSK modulated signals (with its known constant envelope), while on the right side the EDR signals are plotted. A critical aspect of
1 During simulation instances, when a BER value is expected with a N digit precision,
such as 0,A1A2A3 ...AN,
79 this kind of Bluetooth signals is the Guard Time, during which the modulation switches from GFSK to EDR. For the moment, the BT-specifications let to the chip producers the freedom to specify the modulator type used during the Guard Time.
Figure 7.1 – In-phase & In-quadrature GFSK+EDR modulated signals.
Surely, a mixed and more complex solution will be implemented on the future chip, the EDR modulator will therefore start inside the Guard Time, but the exact instant has not yet been fixed. Inside the C-simulator, a solution where the Guard Time is modulated through GFSK has been selected and the simulations have been conduced over 1000 independents slot data packets. Since the real behaviour, depending on the delay time of the digital circuits response, cannot be implemented within the C-program, the results are referred to an ideal no-delay case. Thus, simulation results report that the EDR demodulator may start at each T period inside the Guard Time obtaining the same performances. It should be
80 clear that if the EDR demodulation begins after the Guard Time’s end, degradations may occurs in term of worse Timing Recovery functionality.
As hinted in Chapter 5, two different filter implementation (through Look-up table ROM and Polyphase filter network) have been tested in comparison of the ideal case given by a digital convolution. After several simulations, the filter output data streams and all the other baseband signals are exactly the same in both cases. Therefore an implementation through Polyphase decomposition is preferred, employing a smaller chip area. Furthermore, simulation results show that the performances in terms of BER are unchanged if different packet types are investigated. This means that each EDR packet types, such as 2-DH1, 2-DH3 and 2-DH5 achieve the same BER value. This behaviour is also confirmed simulating the other 3-DH1, 3-DH3 and 3-DH5 packet types.
Another investigation has been performed in order to control the behaviour of several types of transmitted data. In second way, this simulation has been useful also to check the validity of the random data provided by the C-program. As shown in the following figure, if regular data types are transmitted, the BER value results smaller.
81
Figure 7.2.b – Simulation results obatained with various Data-Types @6.5MHz.
At this point, it is necessary to show the simulation results of interest in order to better quantify the performance achieved during this thesis, implementing the new EDR standard.
7.2 EDR specifications required
The EDR – Radio specifications define also some testing conditions in order to validate the results. Firstly, the required performances are reported and can be summarized as follows.
The actual sensitivity level is defined as the input level for which a raw Bit Error Rate of 0.01% is met (BER equal to 10-4). The requirement for Bluetooh π/4-DQPSK and 8DPSK Enhanced Data Rate receivers is an actual sensitivity level of –70 dBm or better. Furthermore, the receiver must achieve a BER less than 0.001% at 10dB above the reference sensitivity level. With regards of the Interference performances, the Co-channel (Mirror signal) and Adjacent (1 MHz
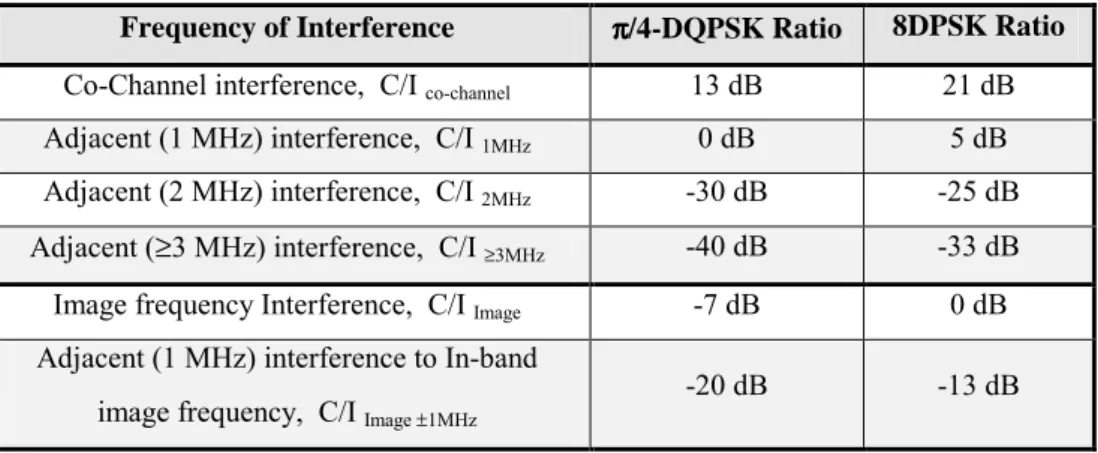
82 and 2 MHz signals) must be measured with the wanted signal 10dB above the reference sensitivity level. The interfering signal for Co-channel interference has to be similarly modulated as the desired signal. The interfering signal for other channels must be equivalent to a nominal BT-GFSK transmitter and must be composed by random data. A BER value of 0.1% or better is required for the Signal to Interference ratios defined in the following Table.
Frequency of Interference ππππ/4-DQPSK Ratio 8DPSK Ratio
Co-Channel interference, C/I co-channel 13 dB 21 dB
Adjacent (1 MHz) interference, C/I 1MHz 0 dB 5 dB
Adjacent (2 MHz) interference, C/I 2MHz -30 dB -25 dB
Adjacent (≥3 MHz) interference, C/I ≥3MHz -40 dB -33 dB
Image frequency Interference, C/I Image -7 dB 0 dB
Adjacent (1 MHz) interference to In-band image frequency, C/I Image ±1MHz
-20 dB -13 dB
Table 7.1 −−−− Interference Performance.
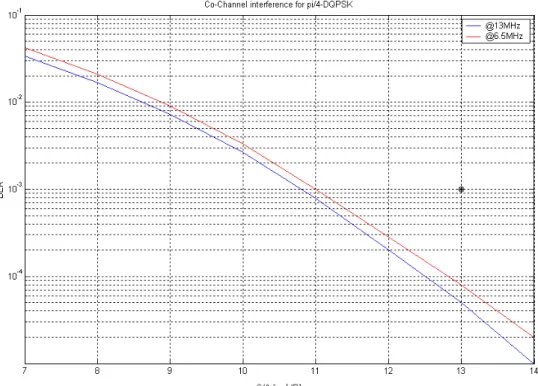
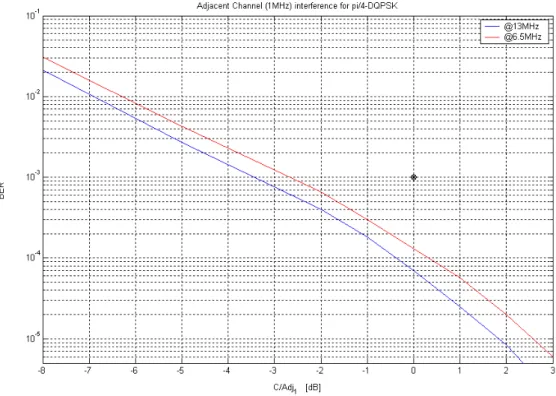
Simulations have been run in order to check each case of the previous table. As the following graphs show, the performance are still referred to the BER value, depending on the wanted to the various interference signals ratio.
Inside the four figures below, the requirements are shown by a dot and have been satisfy with acceptable margins. For both the Co-channel and Adjacent 1MHz interference signals a BER value less then 10-3 is achieved at the ratio value fixed. It should be clarified that these behaviour specially depend on the functionality of the Complex BP filter. During this work, the existing GFSK implementation of this complex filter has been reused, without to introduce any modification. Thus, some improvements could be employed in order to optimise also the EDR case. Referring to the Image Frequency Interference (Mirror signal), the simulations have been performed with a different method.
83
84
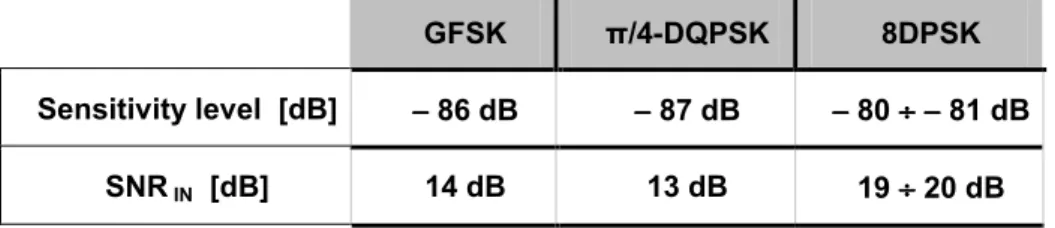
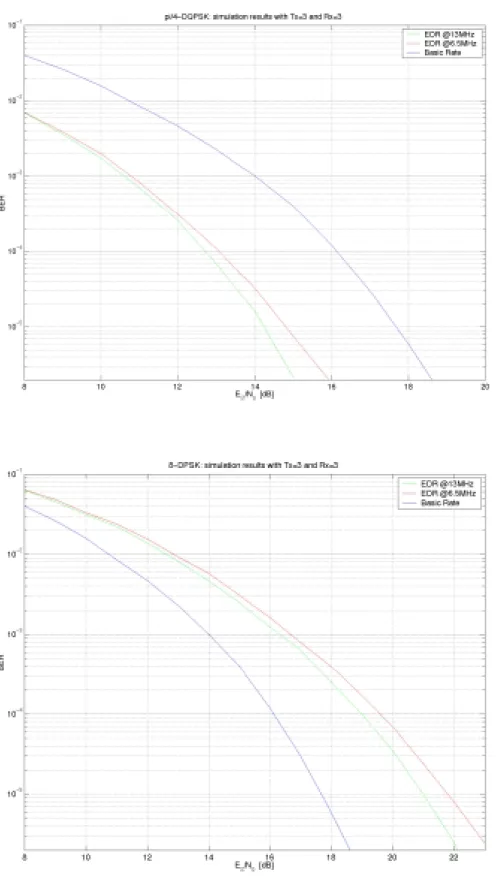
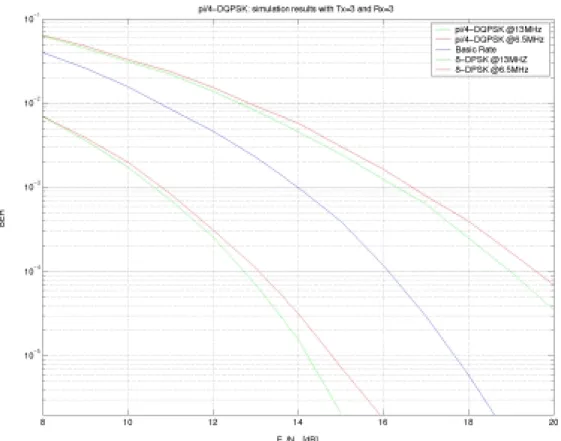
85 At this point it is necessary to establish the sensitivity level obtained during this work. At this aim, the most important graphs are reported in the following pages. Figure 7.6.a reports simulation results related to the π/4-DQPSK modulation in an ideal case; this means that any non-ideal effects have not been activated during these simulations. Both the sampling frequency cases are reported (13MHz and 6.5 MHz). While, Figure 7.6.b shows the simulation results related to the 8DPSK modulation, once again in an ideal case. In order to compare the performance of the three different BT-modulation types, also the Basic Rate (GFSK) performance are reported inside these graphs. Finally, a complete and exhaustive graphic compares the three kind of BT-modulations: π/4-DQPSK, GFSK and 8DPSK. In this way, it is necessary to remember that for the EDR case the sensitivity level is defined as the input level which the related BER value is equal to 10-4, while for the Basic Rate is 10-3. As described inside Appendix – 5, it depends on the SNR dB value and the resulting values can be reported inside the following table:
GFSK π/4-DQPSK 8DPSK
Sensitivity level [dB] −−−− 86 dB −−−− 87 dB −−−− 80 ÷÷÷÷−−−− 81 dB
SNR IN [dB] 14 dB 13 dB 19 ÷÷÷÷ 20 dB
Table 7.2 −−−− Sensitivity reference levels.
With regards of the Mirror signal requirement described in Table 7.1, some wanted to mirror channel (C/Mir) ratio values have been tested for both the EDR modulation types, only referring to the 13MHz case. Thus, BER value related to an input level 10 dB above the sensitivity level and to a specified C/Mir ratio, must be less than 10-3. These performances can be checked in the graphs of Figure 7.6.a and 7.6.b. For the π/4-DQPSK, the BER curve related to the –7dB C/Mir ratio is not plotted, but the nearest –5dB curve can be considered equable. Thus the required BER value is obtained at the sensitivity level equal to –85dB.
86
87
88
Figure 7.7 – BER performance for the Bluetooth Modulations.
Surely, the BER will be smaller than 10-3 at –77dB of sensitivity level, and therefore, the requisite is respected with a big margin. The same behaviour results with the 8DPSK case, with a 10-3 BER is performed by the 0dB ratio curve at a sensitivity level equal to –82. Therefore, the BER value at the sensitivity level of -70dB is smaller than the requirement, with a interesting margin.
The final results of interest for this report are provided by the simulations investigating all the Filter Length cases. There can be nine different combinations using the three truncation intervals:
[
−2T ,2T[
;[
−2.5T ,2.5T[
and[
−3T ,3T[
for both Transmission and Reception filters. The graphs in Figure 7.8 and 7.9 show that the gap between the best performance case, using a Tx-Rx filter length equal to 3x3, and the 2x2 case is smaller than 1dB. In this way, the use of the smallest chip area implementation is allowed. Moreover, the same behaviour is also confirmed by simulation results performed on the 3-bits Modem (8DPSK).89
90