6
2. POWER LINE NETWORK CHARACTERISTICS
In this chapter, we describe the characteristics of PLC networks using low-voltage power supply networks as a transmission medium. The major advantages of Power Line Communication are an already deployed infrastructure with very high household coverage in most of the countries worldwide and a home network with multiple access in most of the houses. Moreover, current generation of PLC offers broadband services at transmission rates equivalent to other access technologies. The low-voltage networks are characterized by their particular topology as well as by specific features if the supply networks are used as a transmission medium for communications.. Although PLC technology has its advantages, the major issue that prevents its widespread use for broadband communication is that the power line channel is highly dispersive and noisy. PLC networks are affected by disturbances from the network environment and also from the low-voltage network itself. In this chapter, the following PLC specific characteristics are considered: network topology in different realizations of PLC access networks, specific features of the PLC transmission channel (low-voltage supply network), and the characteristics of noise that cause the disturbances in PLC networks. Due to the fact that power lines were not conceived for communication purposes but to deliver electrical energy (what involves signals of much lower frequency and higher power), the medium characteristics are certainly adverse. The channel exhibits remarkable differences between locations, according to the network topology (often unknown), the type of wires installed and connected loads (of heterogeneous nature). Even in a specific power circuit the conditions change depending on the selected transmission path (i.e. sockets where the transmitter and receiver are plugged). Furthermore, having a priori knowledge of the cable parameter, an estimate of the power line channel and a selected transmission path, the response exhibits a time-varying behaviour with a twofold nature. The first one is the well-known long-term variation caused by the connection and disconnection of electrical appliances to the grid. The second one is a short-time variation, synchronous to the mains, whose origin is the dependence of the impedance presented by electrical devices on the mains voltage.
7
2.1 PLC TRANSMISSION CHANNEL
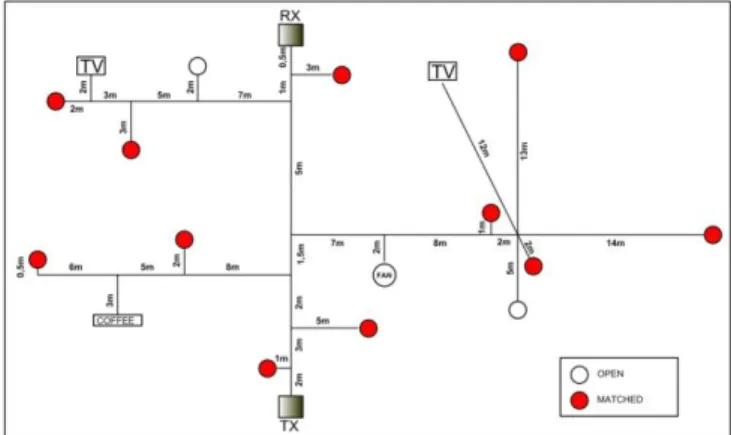
The powerline medium is an unstable transmission channel owing to the variance of impedance caused by the variety of appliances that could be connected to the power outlets. Because it is always time varying, the powerline can be considered a multipath channel that is caused by the reflections generated at the cable branches through the impedance discontinuities. The impedance of powerline channels is highly varying with frequency strongly depending on the location type and varying in a range between some few ohms up to a few kilo-ohms. The impedance is mainly influenced by the characteristic impedance of the cables, the topology of the considered part of network and the nature of the connected electrical loads. Different approaches have been proposed to describe the channel model of the powerline medium from the receiver (RX) to the transmitter (TX). Our approach consists of considering the PLC medium as constituted by a set of multiple transmission lines (TL) interconnected to produce a tree-like network containing many intersection nodes an indoor power line network is shown in Fig.1.
8 Each TL is described by its type of wire, length, frequency dependent per unit parameters r
,l ,g ,c and length L and by the parameters of the load connected. The transmission lines equations in the frequency domain are the following:
, V z r j l I z z I z g j c V z z (Equation 1)The voltage and the current V z I z
, in (1) are the phasors of the electrical quantities along the line for a specified frequency. Given an initial condition for the voltage and the current at the input port of the transmission line
11 0 0 V V I I (Equation 2)And the solution of (1) is:
1 1 , 0 ( ) 0 M V z V e I z I where r j l M g j c (Equation 3)In particular, in order to characterize the links in the frequency domain, we consider that each TL of length di and we consider the ABCD transmission
9
1 2 1 2 cosh sinh sinh cosh c M d c d Z d A B e d d C D Z V A B V I C D I (Equation 4)The characteristic impedance Zcband the propagation constant are related to
the per-unit-length parameters of the transmission line according to
, c r j l Z g j c and (rj l g)( j c ).
It is supposed that the per-unit parameters depend on frequency as shown above, according to rr l1; l1 l2 f g; g f c1 ; c1. Wherer g c l l1, 1, , ,1 1 2 , are constant
parameters whose values have been taken from the measured data reported in xx. As a result for the considered values, the characteristic impedance of the links is almost independent from the frequency, assuming a value of 40 Ohm, which is used for matching loads. In order to form the channel model for simulation an accurate frequency characterization of the loads connected to the grid is also necessary. The frequency response of the channel can be obtained, at each frequency, solving the algebraic linear system of equations obtained from the nodal analysis of the global network circuit. The two port admittance matrix representation of a single line corresponding is given by:
1 1 1 2 2 2 1 1 A I V B B V Y I V A V B B (Equation 5)
Considering that one wire is grounded for all the two wire transmission lines in the network only the first equation can be considered. It is straightforward to
10 show that the generic Kirckhoff current law equation at the Nnode , which is connected, by transmission lines, to other N nodes, can be written as:
0 1 1 0 i N N i k k i i i i A V V B B
(Equation 6) Where 0 kV is the phasor of node voltage of node kand i k
V are the node voltages of the N nodes that belong to the star centered in kand A Bi, i the elements of
the transmission matrix connecting the node 0 k
V to i
k
V . Considering loads
terminations as linear impedances at the nodes connected to lines terminated with a load the equation is modified considering the input admittance v
k Y : 0 1 1 0 i N N v i k k k i i i i A V V Y B B
(Equation 7)At the source node TX the trasmitted voltage phasor is Vtx1V and the frequency response of the network is
rxtx V H V .
2.2 NETWORK TOPOLOGY
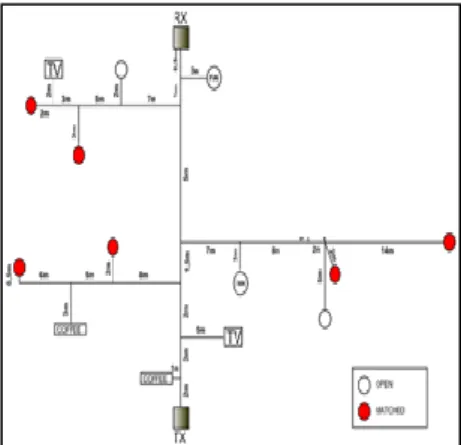
Low-voltage supply networks differ from each other and it is not possible to specify a typical network structure for them. There are generally several branches (network sections) connecting the transformer station with the end users. However, a PLC access network can be organized in different ways (e.g. different position of the base station, network segmentation, etc.), which can influence the network operation. For example considering the two different topology reported in fig.4 and in fig.5 and their different frequency response at fixed time t.
11 Figure 2: Topology Network A
Figure 4: Frequency response Network A Figure 5: Frequency response Network B
Different position of the base station, network segmentation, TV, FUN and COFFEE machine can influence the network transfer function. We also find various kinds of Transfer function in the low-voltage networks considering different time of observation but it will be discussed later.
12
2.3 DISTURBANCE CHARACTERIZATION
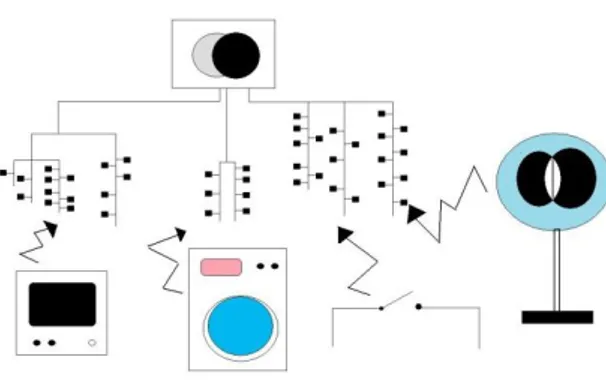
Figure 6: Disturbance in PLC
Due to the fact that power cables were where conceived only for energy transmission, no interest has been shown in the properties of this medium in the high-frequency range. PLC networks are characterized by their particular topology as well as by specific features if the supply networks are used as transmission medium for communication. On the other hand, the transmission capacity of most existing overhead transmission lines is limited by the widely varying unstable channel characteristics. Indoor power lines generally comprise several branches connecting the service panel with the end users. Each branch can have a different topology and different electrical devices connected to it. Although the power grid can be modeled as a set of interconnected transmission lines, formed by pairs of conductors, which have a quite linear behavior, furthermore, a wide variety of appliances, with different properties, are connected to the power network. Therefore, before using this medium for information transmission, an intensive investigation of the phenomena present in their environment has to be achieved. Besides the distortion of the information signal, owing to cable losses and multipath propagation, noise superposed on the utile signal energy make correct
13 reception of information more difficult. Unlike the other telecommunications channels, the powerline channel does not represent an Additive White Gaussian Noise (AWGN), whose power spectral density is constant over the whole transmission spectrum. An interesting description is given in [ZimmDo00a], which classifies the noise as a superposition of five noise types, distinguished by their origin, time duration, spectrum occupancy and intensity
Colored background noise, is essentially with the essence of random
appearance. From the power spectrum density (PSD) point of view, it is a slow time-variant random disturbance, ranging from the service frequency (50Hz or 60Hz) to 20 KHz. At higher frequency range, the value of power spectrum density continuously decreases with increasing frequency. Because of the difficulty of measurement and analysis, it can be viewed as part of the colored background noise, and be expressed through the background noise power spectral density.
Narrowband noise , this type of noise occupies several sub bands, which
are relatively small and continuous over the frequency spectrum, most of the time has a sinusoidal form, with modulated amplitudes. It is mainly caused by the ingress of broadcast stations over medium- and shortwave broadcast bands.
Periodic impulsive noise, asynchronous to the main frequency , this type of
noise is mostly caused by switching power supplies and has a form of impulses that usually has a repetition rate between 50 and 200 kHz, and which results in the spectrum with discrete lines with frequency spacing according to the repetition rate. Because of its high repetition rate, this noise occupies frequencies that are too close to each other, and builds therefore frequency bundles that are usually approximated by narrow bands.
Periodic impulsive noise, synchronous to the main frequency , is impulses
with a repetition rate of 50 or 100 Hz and are synchronous with the main powerline frequency. Such impulses have a short duration, in the order of microseconds, and have a power spectral density that decreases with the frequency. This type of noise is generally caused by power supply operating synchronously with the main frequency, such as the power converters connected to the mains supply.
14
Asynchronous impulsive noise, this impulses are mainly caused by
switching transients in the networks and are usually represented as a switch on-off . These impulses have durations of some microseconds up to a few milliseconds with an arbitrary inter arrival time. Their power spectral density can reach values of more than 50 dB above the level of the background noise, making them the principal cause of error occurrences in the digital communication over PLC networks.
The achieved measurements have generally shown that noise of the types 1, 2 and 3 remain usually stationary over relatively longer periods, of seconds, minutes and sometimes even of some hours. Therefore, all these three can be summarized in one noise class, that is seen as colored PLC background noise class and is called “Generalized background noise”. In this thesis we focus our attention on the noise of type 4 and 5.