Why is the volume of bank loans low in some countries and high in others? The role of government debt*
*
Abstract
We investigate determinants of the size of banking loans in 18 OECD countries in the period 1981-1997. The novelty of the paper is to show that the ratio of government debt to GDP has a negative effect on the level of banking credit. Second, countries with a German legal origin have higher ratios of loans to GDP with respect to common law nations. Our results are robust to the inclusion in the regressions of several variables such as per capita GDP, stock market capitalization, the banking reserve requirement, the inflation level and its volatility.
* This paper was written jointly with Riccardo De Bonis (Bank of Italy). We thank Giovanni Ferri, Silvia Magri, Franco Peracchi, Enrico Perotti, Lisa Rodano, Federico Signorini, Damiano Silipo, Robert Waldmann and two anonymous referees for discussions and helpful comments to previous versions of the paper. We also thank the participants to seminars held at the XIV International “Tor Vergata” Conference on Banking and Finance, Rome, 5/7 December 2005 and at the 39th Annual Conference of the Money Macro and Finance Research Group, 12-14 September 2007, held at the University of Birmingham. The views expressed here do not involve the responsibility of the Bank of Italy.
1. Introduction
Banks are a key element of financial structures all over the world, contributing to the financing of the economy and the management of the payment system. But, why are banks more important in some countries than others ? In 2004 the ratio of loans to GDP was around 46 per cent in the U.S., 77 per cent in France and 100 per cent in Germany. The ratio of deposits to GDP was 40 per cent in the U.S., 68 per cent in France and 86 per cent in Spain.
Different strands of literature studied how the level of banking loans is influenced by economic and institutional variables. Since the Sixties the financial repression approach rationalised the restrictions that affected the financial systems of industrialised countries (McKinnon, 1973; Show, 1973). These studies refer to policy instruments – such as high reserve requirements, implicit taxes levied through inflation, explicit taxation, the public debt – that might reduce the size of banking systems. On the contrary, path dependency theories of financial development stress the role of legal origin as the central factor driving the cross-country differences we observe today (La Porta et al, 1997). Other authors state antinomies between banks and stock markets. This is a very old debate, whereas other studies postulate a positive nexus between banks and equity markets.
The goal of this paper is to present new evidence on the determinants of banking loans in OECD countries, trying to discriminate between the different factors by nesting them in a general empirical model. The issue we address has not only a theoretical but also a policy relevance. If factors that limit banking development are detected, political authorities may introduce reforms to foster bank credit, whose link with economic growth is established by many contributions. As far as we know, the novelty of our paper is to underline the negative effect of government debt on the volume of bank loans.
We investigate factors driving those cross-country differences by exploiting a longitudinal dataset for 18 OECD countries that covers the years 1981-1997.
The paper is divided into 5 sections. Section 2 reviews the literature. Section 3 presents the data and introduces some stylized facts. Section 4 illustrates the empirical specification and discuss the econometric exercises. Section 5 contains some robustness checks. Section 6 concludes.
2. A review of the literature
Our paper is connected to different strands of the literature.
A first link is with the theory of financial repression. This approach emphasizes a supply side aspect of financial development. Governments may repress the size of the
financial and banking sectors to raise revenues from alternative channels that lie under their control. Financial repression artificially increases the private sector’s demand for those assets that are the basis of implicit taxes, e.g. the monetary base and the public debt. By the second half of the 1960’s, regulations, taxes, qualitative and quantitative controls, often introduced to pursue monetary policy goals, made it difficult for financial intermediaries to operate at their full technological potential (Roubini and Sala-i-Martin, 1995). These measures shrank the financial systems of many countries (Battilossi, 2003). Here we review some of the contributions on these subjects.
Following Fisher’s old intuition on debt deflation, Boyd, Levine and Smith (2001) assert that inflation causes lower rates of return of loans, thus leading to reduced credit. Smaller real returns can not only decrease the availability of financing but also draw lower quality borrowers into the pool of credit seekers. The authors find a negative relationship between inflation and banking sector size.
There are linkages among inflation, reserve requirement and governments bonds. Brock (1989) considers not only the inflation tax levied on currency but also that on banks’ non-interest bearing reserves. In addition, controls to the composition of the bank’s portfolio are complementary instruments of financial repression. Governments may impose portfolio constraints by setting public debt securities as the only assets eligible for meeting banks’ requirement. As a consequence, banks resources are channelled towards the purchase of government bonds. Further, the government may impose credit ceilings as demonstrated by many industrialised countries in the Seventies. Giovannini and De Melo (1991) explain how nominal interest rate ceilings combined with controls on international flows may generate an artificially low cost of domestic funding for the government and consequent revenues from financial repression. However the link between fiscal policy and banking is not entirely clear. Studying the Italian case, Piluso and Ricciuti (2008) find a pro-cyclical behaviour of public spending, taxes and bank variables, even if the causal links are not investigated.
Our paper is also linked with the law and finance view. This approach emphasizes the idea that early institutions and arrangements persist over time and determine current outcomes. The mechanism rests on two points: on the one hand, the basis of finance is the protection of investor and creditor rights; on the other hand, the legal origin of countries is the source of such basis. Legal systems are classified into four origins: Anglo-Saxon, French, German and Scandinavian. They emerged over the previous centuries, internationally spread through conquest and imitation and explain the differences in investor protection, contracting environment and financial development that industrialised countries exhibit today. La Porta et al (1997) show that countries with higher shareholders rights and common law traditions, by
and large nations of Anglo-Saxon legal origin, have relatively larger financial markets. The legal approach has been criticized because it overlooks structural breaks in history. Beck, Demirguc-Kunt and Levine (2003a) compared the legal traditions paradigm with the "adaptability channel of law": the authors find that legal origin matters for financial development because legal traditions differ in their ability to adapt efficiently to evolving economic conditions. They conclude that in terms of adaptability the German system is closer to the common law than the French legal system.
Other scholars criticized the legal origin approach, underlining the role of changing over time interest groups in explaining cross-country differences in financial systems. Rajan and Zingales (2003) say that preferences of influential interest groups were implemented through the century by the trade openness choice: they show how both in 1913 and in 1997, for any level given of demand, financial development was higher in countries that were more open to trade.1 The intuition is that international competition weakens the incumbents’ opposition to
financial development. Quy-Toan Do and Levchenko (2004) provide empirical evidence that trade openness affects financial systems of countries in a non linear way: among developed countries trade promotes financial systems while it has an opposite effect among the poorer ones. Chinn and Ito (2006) focus on the effects of capital account liberalisation for financial growth and conclude that financial openness matters only when a threshold level of legal and institutional development has been attained.
In Section 3 we present our empirical strategy.
3. The data and some stylized facts
We examine the effects of forms of financial repression and legal origin on the volume of bank loans, controlling for stock market capitalisation, per capita income and other indicators. We use both contemporaneous variables (such as the reserve requirement and public debt), lagged variables (such as per capita GDP) and time-invariant variables (such as legal origin) referred to 18 OECD countries. The analysis is based upon data originally recorded at an annual frequency, over the period 1981-1997. We chose this time interval because the first composition of the euro area was defined in 1998 and this institutional break might have affected both the behaviour of private credit and its statistical definition2.
With regard to our dependent variable, we use the definition adopted by Levine and Zervos (1998) and Levine, Loyaza and Beck (2000), i.e. the credit granted by the banking system to the private sector, relative to GDP.
1
Alcalà and Ciccone (2003) show how trade openness was a robust determinant of economic growth over the 1960-1996 period.
Moving to the independent variables, financial repression is measured through different indicators. The reserve requirement is proxied by the ratio of bank liquid reserves to bank assets. Inflation rates are measured as annual growth rates of the consumer price index. Also inflation volatility, which we measure with the annual standard deviation of the monthly inflation rate, might affect credit. Public debt is measured by the gross general government debt as a percentage of GDP. It is difficult to collect statistics on other financial repression instruments, such as quantitative ceilings or controls on deposit and lending rates. Moreover most of these measures were gradually suppressed in OECD countries in the 1980s. Legal origin is considered using the dummies introduced by La Porta et al (1997). The same source was exploited to assess the level of creditor rights protection. Trade openness is measured with the index suggested by Rajan and Zingales (2003), i.e. the sum of exports and imports of goods and services as a share of GDP.
According to a large, though still controversial, body of literature, there is a link between economic growth and finance3. We take this debate into account by using per capita GDP as a proxy of the demand side schedule which might influence the equilibrium level of banking credit. Per capita income is measured in terms of purchasing power parity.
Finally, other studies look at financial systems emphasizing the antinomy between bank based and market based countries. This approach implies that banks and markets are substitutes: households may prefer to invest in deposits rather than in shares; firms may favour shares over banking loans. In a different perspective, stock market capitalisation may promote banking activity if banks and markets play a complementary role (Levine and Zervos, 1998). In this view both intermediaries and markets matter for growth (see Demirguc-Kunt and Levine, 2001, for a synthesis). Given the existence of different opinions, we control how stock market capitalization, as a share of GDP, is linked to banking intermediation.
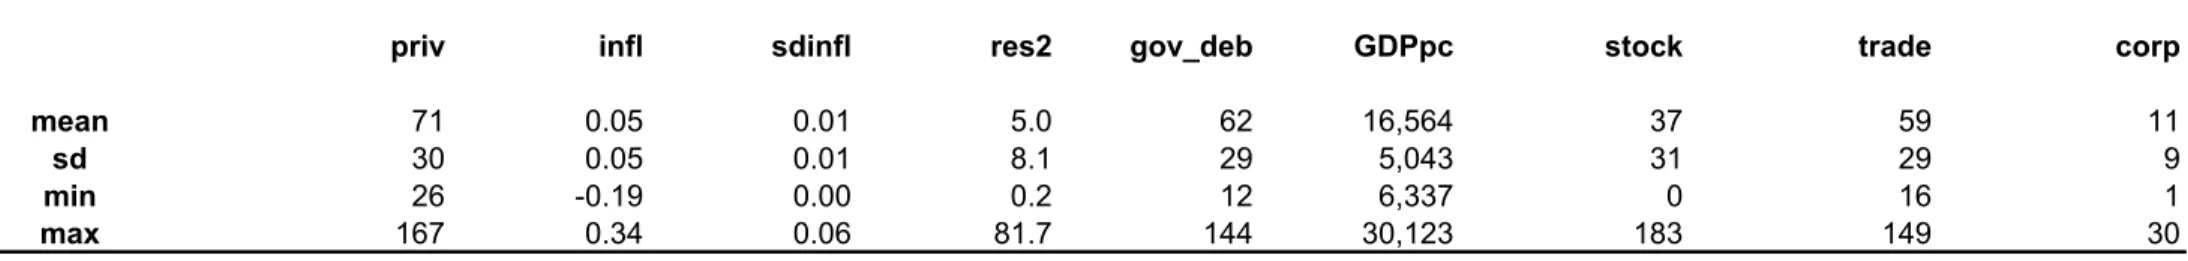
Table 1 reports the definitions and sources of the data, while Table 2 lists the countries we selected, mainly on the basis of the available long term time series. Table 3 presents some descriptive statistics. Over all periods and all countries, the average ratios of loans to GDP is 0.71. As indicated by minimum and maximum values, there are marked differences across countries and years for both banking loans and explanatory variables.
2
The creation of the euro area implied a new definition of many items of bank balance sheets in member States. 3
While the direction of causality is difficult to establish, the predominant empirical finding is that financial development causes economic growth (see Levine, 2003, for a survey). There is also an opposite view that probably was initiated by Joan Robinson’s claim that “finance follows”. Allen, Bartiloro and Kowalewski (2006) show that financial institutions and markets develop in response to the needs of firms and the characteristics of the real economy.
Figure 1: Private Credit (as a share of GDP, 1981-1997) in 18 OECD Countries
Figure 1 shows the link between private credit and the legal traditions of countries. Banking development is substantially greater in German tradition countries than in those with an Anglo-Saxon legal origin. Further, all Scandinavian countries are located below the overall average. The evidence is confirmed by the correlation matrix (Table 4): it shows a positive association between banking development and countries belonging to the German legal tradition while a negative correlation is detected for Scandinavian countries. The matrix also shows a negative correlation between government debt and the volume of bank loans. Negative linkages are observed for banking credit and both inflation rates and reserve requirement. Further, there is a positive association between banking credit, on the one hand, and both stock market capitalisation and per capita income, on the other hand.
In the following Section we turn to multivariate regressions.
4. The empirical specification and the econometric results 4.1 The empirical model
The panel nature of the dataset is exploited through a static model specified as:
1.49 1.04 0.94 0.85 0.82 0.76 0.75 0.66 0.53 0.45 0.39 0.83 0.65 0.50 0.50 0.66 0.50 0.43 0.00 0.20 0.40 0.60 0.80 1.00 1.20 1.40 1.60 Switzerland Japan Germany Austria France Spain Netherlands Portugal Italy Belgium Greece United Kingdom United States Australia Canada Finland Norway Sweden G E R M A N F R E N C H A .S A X O N S C A N D
t i
priv = α +
β
X
it +η
i +ε
itwhere privit are the loans to the private sector, the vector
X
it contains time-varying determinants (such as financial repression instruments, per capita GDP and stock market capitalisation) while the termη
i captures time-invariant country components.We follow the standard practice of taking five year-averages to remove the effects of business cycle from the analysis (see Islam, 1995). As a further control, we estimate our models over the original annual database (see paragraph 5.1). To tackle reverse causality between banking activity, on the one hand, and per capita income and stock market capitalisation, on the other hand, we re-estimate with variables lagged4. In such a way they are
predetermined with respect to the dependent variable.
Cross-country heterogeneity was taken into account through legal dummies, or by estimating both random and fixed effect models. Time-invariant country specific effects were also used as a way of capturing cross-country unobservable heterogeneity:5 we tried both
fixed-effects (LSDV estimator and first difference estimator) and random-effects (GLS estimator).
4.2 Determinants of the ratio of banking loans to GDP
In studying the determinants of the credit granted by the bank system to the private sector, as a share of GDP, we follow a step-by-step procedure, starting from a simple model and then adding new variables. Overall we present seven different regressions (Table 5). Beginning with the financial repression variables, the inflation rate has sometimes a negative impact on bank loans, but the coefficients are never significant. Also the volatility of inflation does not statistically affect the ratio of credit to GDP. The coefficient of the reserve requirement has a negative sign but it is significant only in two regressions. Haslagh and Koo (1999) found a negative impact of the reserve requirement on banking business.
On the contrary, whatever specification we adopt government debt has a negative and statistically significant influence on the ratio of loans to GDP. A 10 percent increase in the government debt to GDP ratio is expected to lower credit granted to private sectors by 3 (regressions 2-3) or 5 (regression 7) percentage points, respectively. Our result may be driven by two crowding-out effects, which are not independent. Firstly, as well as the supply side is
4
When we investigate years averages statistics, those explanatory variables are instrumented through five-years lagged terms, while as for annual data, the variables are instrumented through one-year lagged terms. 5
In general terms, if legal origin may capture variability across countries, not accounted by time-varying determinants, pooled estimators with legal dummies become more efficient than the fixed effect estimator. Several degrees of freedom may be earned if the variability is captured through four legal dummies instead of eighteen countries components.
concerned, government-imposed controls and quantitative ceilings on financial markets shrank the volume of credit granted by the banking sectors, on the one hand and increased artificially the demand of securities issued by governments, on the other hand. According to the public finance approach to financial repression, issues of public bonds are a way of collecting revenues by the State (Giovannini and De Melo, 1991; Battilossi, 2003; Roubini and Sala-i-Martin, 1995). Secondly, as well as the demand side is concerned, low volumes of bank loans are demanded by the private sector of countries having high shares of state-owned companies – which absorb part of loans made available by banking systems. Our results are consistent with those obtained by Hauner (2008), who finds a negative link between public debt held by banks and financial development in middle-income countries.
While the financial repression literature brings into prominence distortions that affected the banking systems from the Sixties on, the legal origin theory emphasises an older historical derivation of financial systems. Our exercises show that a share of cross-country variability is captured by the legal origin components. The significance of the legal origin variables is reached both in regression 6 (where individual random components are allowed) and in regression 7 (where legal origin captures all the variability not accounted by time-varying determinants). Countries based on the German and French laws have greater ratios of loans to GDP than common law countries. The German origin effect is the strongest. German origin countries have around 50 percentage points higher ratios of private credit to GDP with respect to the common law countries, while French origin countries have around 30 percentage points greater ratios of loans to GDP with respect to the common law countries. The role of legal origin in influencing capital market development has been recognized by Beck, Demirguc-Kunt and Levine (2003a), even if associated with the initial endowments of countries. While La Porta et al. (1997) state that common law countries are more favourable to financial development, we find that German and French laws conduce to higher ratios of loans to GDP. This possible puzzle is pursued in paragraph 5.3.
Moving to the control variables, per capita income has a positive impact on the ratio of loans to GDP. This is true using contemporaneous per capita income (regression 2 and 4) while the coefficients are positive but not significant using lagged per capita income in fixed and random models (regressions 3 and 5). When legal origin dummies are added to the random-effect model (regression 6), we obtain similar results.
The econometric exercises of Table 5 also show that contemporaneous stock market capitalization has a positive but not statistically significant influence on the loans to GDP ratio, while the predetermined stock market capitalization has a positive and significant coefficient in both fixed effect and random effect models (regressions 3 and 5). Results are
confirmed when legal origin dummies are added to the random-effects and pooled models (regressions 6 and 7). This positive nexus confirms the hypothesis of complementarity between stock market capitalisation and private credit highlighted in Levine and Zervos (1998).
Now we turn to some robustness checks of our econometric exercises.
5. Robustness checks
5.1 Do annual data regressions replicate the five-years average statistics results ?
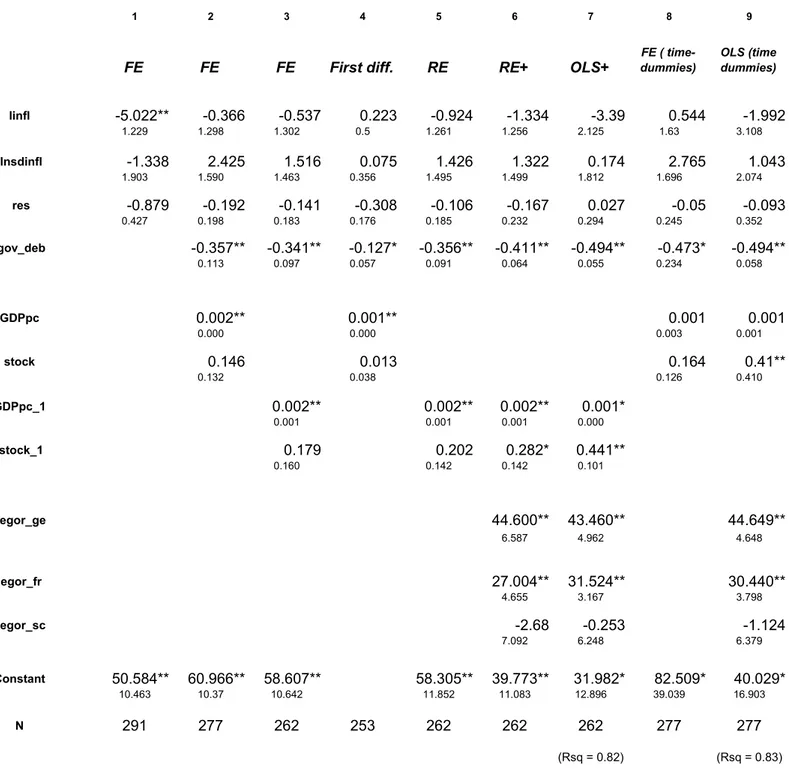
To increase the efficiency of our estimates, we run other 9 regressions by exploiting annual statistics (Table 6). We consider the same seven regressions of table 5 plus two other exercises that include yearly-time dummies. Estimated parameters confirm the previous results. Government debt maintains its negative and significant influence on the ratio of loans to GDP. A move from the sample mean of 62 per cent to a ratio of 52 per cent is associated with a 3.5 (regressions 2 and 3), or 5 (regressions 8 and 9) percentage points increase in the loans to GDP ratio. Current inflation, its volatility, and the reserve requirement do not have a statistically significant effect on banking credit. The legal tradition confirms its role in explaining differences in variability of banking business across countries: relative to common law countries, German and French legal origins are associated to higher ratios of loans to GDP. The German legal tradition dummy has the largest coefficients. Per capita GDP and stock market capitalization maintain a positive and often significant impact on the ratio of outstanding loans to GDP.
5.2 Splitting the period into two sub-periods
Banking deregulation and liberalization were much stronger in the Nineties than in the Eighties. European Directives liberalized banking markets but the same process took place in other OECD countries like the US.6 Also inflation, reserve requirements, and the level of government debt and capital account rules were different in the Nineties with respect to the Eighties. For this reason we split our sample in two periods, 1981-1989 and 1990-1997 to search for possible breaks in the determinants of the ratio of credit to GDP. The results, reported in tables 7 and 8, confirm our previous results. Government debt has a negative influence on private credit while the German legal origin keep its positive sign. The effect of the government debt to GDP ratio is stronger when the analysis is carried out over the period
1981-1989, as showed by the larger size of the coefficients. In this period, countries which reduce the government debt to GDP ratio by 10 percentage points, are expected to raise the credit to GDP ratio by 5.5 percentage points (see regressions 6 and 7) while as for the period 1990-1997, the same decrease of government debt is associated to a rise in the dependent variable by 4 percentage points.
5.3 Other robustness checks
Here we discuss other robustness checks of our regressions (for the sake of brevity results are reported only for the first exercise and are available upon request).
First, the size of the banking loans might be influenced by firms’ issuance of bonds. One might argue that banking credit is more important where firms’ securities issued are smaller (see Fink, Haiss and Hristoforova, 2005). To study the relevance of corporate bonds, we included in the model the ratio of bonds issued by non financial corporations to GDP. For 13 OECD countries data on corporate bonds are available in a time-series format. The econometric exercise (Table 9) shows that the corporate securities coefficient is never significant. The introduction of firms’ bonds does not affect the previous determinants of the ratio of credit to GDP.
Second, we verified if the negative link between government debt and private credit survives after controlling for the importance of the State in the ownership of banks. The test consists of two regressions and makes use of statistics reported by La Porta et al (2002) for the years 1970 and 19957. In the first test, a term capturing State ownership of banks is included as a determinant of private credit in a OLS equation running over a cross-section of statistics for 19958. In the second one, a time-invariant term on State ownership of banks, as observed in 1970, is included as a determinant of private credit in a set of models for panel data (random effect, ols with time-dummies, pooled regression). All the regressions show that Government debt maintains a negative and significant linkage with private credit, even controlling for State ownership of banks. The signs and significance of parameters mimic those estimated in the analysis of the previous Sections. The coefficient for State ownership of banks is mainly negative but not statistically significant, without affecting the sign and the significance of government debt.
6
On the transformation of the European banking system see Gual (1999), Belaisch, Kodres, Levy and Ubide (2001), Dermine (2000) and (2003). On the American banking system see Berger, Kashyap and Scalise (1995) and Bernard and Bisignano, (2006).
7
Other statistics on State ownership of banks are provided by Barth, Caprio and Levine in the World Bank web site, but refer to data collected from 2001 onwards.
8
Outcomes provided by OLS regressions exploiting a few, i.e. 17 observations referring to OECD countries, are reported by Bleaney (1996).
Third, as seen in the literature review some authors claim a positive connection between trade openness and banking development. Our results show that trade openness has in most of the cases a negative effect on bank loans but the coefficients are rarely statistically significant and do not alter the previous estimates.
Fourth, in last years some scholars improved the measurement of indicators of banking regulation and supervision to understand national characteristics of banking business (see Barth, Caprio and Levine, 2006). Exploiting a dataset built in the World Bank for many countries, these authors analyze how banking intermediation is influenced by measures such as barriers to entry and competition regulatory variables, restrictions on banking business, separation between banking and commerce, capital ratios, deposit insurance, official supervisory action variables, market discipline and transparency. This line of research is very interesting, but information on banking regulation and supervision is available in the form of cross-section statistics and refers only to very recent periods, while in this paper we study the development of banking loans over two decades. A harmonized picture of banking regulation is not available for the Eighties. For these reasons, the World bank cross-section database is not used in our paper, even if we are conscious that regulation is an important determinant of banking intermediation.
6. Conclusions
We investigate factors driving cross-country differences in the volumes of bank loans by exploiting a longitudinal dataset for 18 OECD countries which ranges over the period 1981-1997.
The novelty of the paper is to shed a light on the negative linkages between government securities issuance and the amount of credit granted by banks to private sector. We find a crowding–out effect that we interpret as an outcome of Financial Repression.
As well as Italy is concerned, restrictions to financial activity operated through credit ceilings and branch restrictions which may have shrunk bank supply of financing to private sector, on the one hand, and artificially channelled bank resources to domestic assets such as the public debt, on the other hand.
Secondly, we find that a part of cross-country variability of banking deepening is explained by the legal origin of countries. As we restrict the study to the size of banking market – and not to financial systems as defined by some more comprehensive indicators - we do not identify the Anglo-Saxon legal origin as the crucial factor for promoting credit systems. According to our evidence, the German legal origin happens to be the most effective.
References
Alcalá F. and A. Ciccone (2003), "Trade, Extent of the Market, and Economic Growth 1960-1996," Universitat Pompeu Fabra, Working Papers, 765.
Allen F., L. Bartiloro and O. Kowalewski (2006), “Does Economic Structure Determine Financial Structure ?”, AFA Chicago Meetings Paper.
Arestis P., P. Demetriades, B. Fattouh and K. Mouratidis (2002), “The Impact of Financial Liberalization Policies on Financial Development: Evidence from Developing Economies”, International Journal of Finance and Economics, 7(2), 109-121.
Barth J. R., G. J. Caprio and R. Levine R. (2006), “Rethinking Bank Regulation: Till Angels Govern”, Cambridge University Press.
Battilossi S. (2003), “Capital Mobility and Financial Repression in Italy, 1960-1990: A Public Finance Perspective”, Working Paper in Economic History, Universidad Carlos III De Madrid, 03-06, February.
Beck T. and R. Levine (2005), “Legal Institutions and Financial Development”, Handbook of New Institutional Economics, October, 251-281.
Beck T., A. Demirguc-Kunt and R. Levine R. (2003a), “Law, Endowments, and Finance”, Journal of Financial Economics, 70(2), 137-181.
Beck T., A. Demirguc-Kunt and R. Levine (2003b), “A New Database on Financial Development and Structure”, World Bank Research Dataset – updated in 2003.
Beck T., R. Levine R. and N. Loyaza (2000), “Finance and the Source of Growth”, Journal of Financial Economics, 58(1-2), 261-300.
Belaisch A., L. Kodres, J. Levy and A. Ubide (2001), “Euro-Area Banking at the Crossroads”, IMF Working Paper, 1/28, April.
Berger A.N., A.K. Kashyap and J.M. Scalise (1995), “The Transformation of the US Banking Industry: What Long, Strange Trip it’s been”, Brookings papers on economic activity, 26 (2), 55-218.
Bernard H. and J. Bisignano (2006), “Financial Intermediary Transformation. Risk Absorption, Transfer and Trading in the US Financial System”, in M. de Cecco and G. Nardozzi (Ed.), Banche e finanza nel futuro: Europa, Stati Uniti, Asia, Bancaria Editrice.
Bleaney M. (1996), “Central Bank Independence, Wage Bargaining Structure, and Macroeconomic Performance in OECD Countries”, Oxford Economic Papers, 48, 20-38.
Boyd J.H., R. Levine and B.D. Smith (2001), “The Impact of Inflation on Financial Sector Performance”, Journal of Monetary Economics, 47(2), 221-248.
Brock P. (1989), “Reserve Requirements and the Inflation Tax”, Journal of Money Credit and Banking, 21(1), 106-221.
Chinn M. D. and H. Ito (2006), “What Matters for Financial Development? Capital Controls, Institutions, and Interactions”, Journal of Development Economics, 81(1), 163-192. Demirguc-Kunt A. and R. Levine (2001), “Financial Structure and Economic Growth”, The
MIT Press.
Dermine J. (2000), “Eurobanking”, in M. Artis, A. Weber and E. Hennessy (Eds.), The Euro. A Challenge and Opportunity for Financial Markets, Routledge International Studies in Money and Banking.
Dermine J. (2003), “Banking in Europe: Past, Present and Future”, in V. Gaspar, P. Hartmann and O. Sleijpen (eds.), The Transformation of the European Financial System, European Central Bank, Frankfurt.
Djankow S., C. McLiesh and A. Shleifer A. (2007), “Private Credit in 129 countries”, Journal of Financial Economics, 84(2), 299-329.
Fink G., P. Haiss and S. Hristoforova (2005), “Credit, Bonds and Stocks in Seven large Economies”, available at http://fgr.wu-wien.ac.at/institut/ef/nexus.html.
Gerschenkron A. (1963), “Economic Backwardness in Historical Perspective”, Harvard University Press.
Giovannini A. and M. De Melo (1991), “Government Revenue from Financial Repression”, CEPR Discussion Paper, n. 489, January.
Gual J. (1999), “Deregulation, Integration and Market Structure in the European Banking”, CEPR Discussion Paper, n. 2288, November.
Haslag J. and J. Koo (1999), “Financial Repression, Financial Development and Economic Growth”, Working Paper, Federal Reserve of Dallas Research Department, 9902. Hauner D. (2008), “Public debt and financial development”, Journal of Development Economics, 88, 171–183.
Islam N. (1995), “Growth Empirics: A Panel Data Approach”, Quarterly Journal of Economics, 110(4), 1127-1170.
La Porta R., F. Lopez de Silanes, A. Shleifer and R W. Vishny (1997), “Legal Determinants of External Finance”, Journal of Finance, 52(3), 1131-50.
La Porta R., F. Lopez de Silanes F., A. Shleifer and R W. Vishny (1999), ”The Quality of Government”, Journal of Law, Economics, and Organization, 15(1), 222-79.
La Porta R., F. Lopez de Silanes F., and A. Shleifer (2002), ”Government Ownership of Banks”, The Journal of Finance, 72 (1), 265-301.
La Porta R., F. Lopez de Silanes, A. Shleifer and R W. Vishny (2000), “Investor Protection and Corporate Governance”, Journal of Financial Economics, 58 (1-2), 3-27.
Levine R. (2003), “More on Finance and Growth: More Finance, More Growth?”, Federal Reserve Bank of St. Louis Review, 85, 31–46.
Levine R. and S. Zervos (1998), “Stock Markets, Banks, and Economic Growth”, American Economic Review, 88(3), 537-558.
Levine R. N. Loyaza and T. Beck (2000), “Financial Intermediation and Growth: Causality and Causes”, Journal of Monetary Economics, 46(1), 31-77.
Mayer C. and O. Sussman (2001), “The Assessment: Finance, Law and Growth”, Oxford Review of Economic Policy, 17(4), 457-466.
Mitchell B.R. (2003), “International Historical Statistics”, Palgrave Macmillan, New York . McKinnon R. (1973), “Money and Capital in Economic Development”, Washington, DC,
Brooking Institution.
Quy-Toan Do and A. Levchenko (2004), "Trade and Financial Development", Policy Research Working Paper Series, World Bank, 3347, June.
Pagano M. and P. Volpin (2001), “The Political Economy of Finance”, Oxford Review of Economic Policy, 17(4), 502-519.
Perotti E. and E.L. Von Thadden (2005), “The Political Economy of Corporate Control”, mimeo.
Piluso G. and R. Ricciuti (2008), “Fiscal Policy and the Banking System in Italy. Have Taxes, Public Spending and Banks Been Procyclical in the Long-Run?”, Cesifo Working Paper, 2442, October.
Rajan R.G. and L. Zingales (1995), “What Do We Know From Capital Structure: Some Evidence From the International Data”, Journal of Finance, L(5), 1421-1460.
Rajan R.G. and L. Zingales (2003), "The Great Reversals: The Politics of Financial Development in the 20th Century", Journal of Financial Economics, 69(1), 5-50. Roubini N. and X. Sala-i-Martin (1995), “A growth model of inflation, tax evasion, and
financial repression”, Journal of Monetary Economics, 35(2), 275-301.
Shaw E. (1973), “Financial Deepening in Economic Development”, Oxford University Press, New York.
Table 1 Data Definition and Sources Sources of the statistics (key to abbreviations):
BDL: Beck, Demirguc-Kunt, and Levine (2003b). IFS: IMF, International Financial Statistics.
LLSV: La Porta, Lopez-de-Silanes, Shleifer, and Vishny (1997). WDI: World Bank, World Development Indicators.
BP: OECD, Bank Profitability. SC: OECD, Statistical Compendium. Dependent variable
priv - claims on private sector by deposit money banks as a share of GDP, BDL.
Independent variables
res – reserve requirement calculated as ratio of domestic currency holdings and deposits with the monetary authorities to claims on other governments, non financial public enterprises, the private sector, and other banking institutions, WDI.
infl – inflation rate calculated as annual growth rate of CPI, WDI.
sdinfl – standard deviation of monthly inflation observations for the year, WDI. gov_deb - gross government debt as a share of GDP, SC.
legor_ge - German legal origin, LLSV. legor _fr - French legal origin, LLSV. legor_uk - Anglo-Saxon legal origin, LLSV.
legor_sc - Scandinavian legal origin of country, LLSV.
trade – sum of exports and imports of goods and services measured a share of GDP, WDI.
GDPpc - per capita GDP (PPP, current international $), WDI. stock - stock market capitalisation as a share of GDP, BDL.
corp - securities other than shares issued by non financial corporations, European central bank and national financial accounts.
Table 2 Country list (18 High Income OECD Countries) 1 Australia 2 Austria 3 Belgium 4 Canada 5 Finland 6 France 7 Germany 8 Japan 9 Greece 10 Italy 11 Norway 12 Netherlands 13 Portugal 14 Spain 15 Sweden 16 Switzerland 17 United Kingdom 18 United States
Table 3 Descriptive statistics
priv infl sdinfl res2 gov_deb GDPpc stock trade corp
mean 71 0.05 0.01 5.0 62 16,564 37 59 11
sd 30 0.05 0.01 8.1 29 5,043 31 29 9
min 26 -0.19 0.00 0.2 12 6,337 0 16 1
max 167 0.34 0.06 81.7 144 30,123 183 149 30
Annual data for the period 1981-1997. Dependent variable (priv) is the amount of credit granted by the bank system to the private sector (as a percentage of GDP); infl is the annual change in consumer prices; sdinfl is the standard deviation of monthly inflation observations for the year; res2 is the bank liquid reserves to bank assets ratio; gov_deb is the gross government debt (as a percentage of GDP); GDPpc is the percapita GDP; stock is the stock market capitalisation (as a percentage of GDP); legal dummies are denoted by the prefix legor_; trade is the sum of exports and imports of goods and services (as a share of GDP).
Table 4 Correlation matrix
priv infl sdinfl res2 gov_deb GDPpc stock trade corp legor_ge legor_fr legor_uk legor_sc
priv 1 infl -0.31 1 sdinfl -0.15 0.61 1 res2 -0.26 0.49 0.34 1 gov_deb -0.36 -0.14 -0.12 0.02 1 GDPpc 0.42 -0.60 -0.49 -0.49 0.15 1 stock 0.50 -0.39 -0.27 -0.39 -0.03 0.59 1 trade -0.11 -0.08 -0.07 -0.15 0.36 0.02 -0.11 1 corp 0.01 -0.12 0.08 -0.25 0.01 0.46 0.54 -0.42 1 legor_ge 0.68 -0.30 -0.17 -0.19 -0.21 0.22 0.16 0.67 1 legor_fr -0.24 0.33 0.19 0.45 0.45 -0.36 -0.40 -0.08 -0.24 -0.43 1 legor_uk -0.16 -0.07 -0.03 -0.21 -0.08 0.16 0.42 0.29 -0.15 -0.29 -0.43 1 legor_sc -0.27 -0.02 -0.03 -0.14 -0.27 0.05 -0.12 -0.33 -0.27 -0.24 -0.36 -0.24 1
Annual data for the period 1981-1997. Dependent variable (priv) is the amount of credit granted by the bank system to the private sector (as a percentage of GDP); infl is the annual change in consumer prices; sdinfl is the standard deviation of monthly inflation observations for the year; res2 is the bank liquid reserves to bank assets ratio; gov_deb is the gross government debt (as a percentage of GDP); GDPpc is the percapita GDP; stock is the stock market capitalisation (as a percentage of GDP); legal dummies are denoted by the prefix legor_; trade is the sum of exports and imports of goods and services (as a share of GDP); corp is the stock of securities other than shares issued by non-financial corporations.
Table 5 - Determinants of loans to GDP ratio in OECD countries (five-year averages data)
Dependent variable: priv
1 2 3 4 5 6 7
FE FE FE First diff. RE RE+ OLS+
linfl -9.075 1.966 3.322 -0.430 -0.291 1.511 1.595 4.95 6.308 4.138 3.899 5.105 4.406 4.332 lnsdinfl -0.162 8.612 6.291 9.010* 2.151 2.556 -4.783 7.740 4.621 5.279 3.966 5.531 6.303 6.095 res -0.215 -0.170 -0.400 -0.188 -0.423* -0.680* -0.629 0.225 0.134 0.295 0.330 0.204 0.288 0.436 gov_deb -0.323* -0.278 -0.388* -0.364* -0.444** -0.482** 0.128 0.150 0.162 0.152 0.070 0.070 GDPpc 0.003** 0.003** 0.001 0.000 stock 0.114 0.012 0.120 0.086 GDPpc_1 0.002 0.001 0.001 0.001 0.001 0.001 0.001 0.001 stock_1 0.206 0.283* 0.408* 0.555** 0.144 0.130 0.161 0.148 legor_ge 48.903** 49.002** 9.176 7.798 legor_fr 29.915** 33.334** 8.286 5.898 legor_sc -4.115 -0.348 10.467 9.511 Constant 41.978 88.273** 108.132** 84.335** 73.606* 38.102 33.414 20.973 27.347 26.506 36.215 38.177 N 70 68 52 48 52 52 52 (Rsq = 0.86)
Five-years averages for the period 81-85, 86-90, 91-95, 96-00. Dependent variable (priv) is the amount of credit granted by the bank system to the private sector (as a percentage of GDP); linfl is the logarithm of the annual change in consumer prices; lnsdinfl is the logarithm of the standard deviation of monthly inflation observation for the year; res is the bank liquid reserves to bank assets ratio; gov_deb is the gross government debt (as a percentage of GDP); stock is the stock market capitalisation (as a percentage of GDP); legal dummies are denoted by the prefix leg_; the suffix (_1) denotes the lagged term of variables; (*) indicates marginal significance at the 5%-level, and (**) at the 1% -level; FE and RE, indicate fixed effect and random effect model; First diff. is th the first difference estimator. (+) (++) point estimates of legal dummies denote differential effects with respect to leg_uk. Robust standard error are below the estimated parameters.
Table 6 - Determinants of loans to GDP ratio in OECD countries (annual data)
Dependent variable: priv
1 2 3 4 5 6 7 8 9
FE FE FE First diff. RE RE+ OLS+
FE ( time-dummies) OLS (time dummies) linfl -5.022** -0.366 -0.537 0.223 -0.924 -1.334 -3.39 0.544 -1.992 1.229 1.298 1.302 0.5 1.261 1.256 2.125 1.63 3.108 lnsdinfl -1.338 2.425 1.516 0.075 1.426 1.322 0.174 2.765 1.043 1.903 1.590 1.463 0.356 1.495 1.499 1.812 1.696 2.074 res -0.879 -0.192 -0.141 -0.308 -0.106 -0.167 0.027 -0.05 -0.093 0.427 0.198 0.183 0.176 0.185 0.232 0.294 0.245 0.352 gov_deb -0.357** -0.341** -0.127* -0.356** -0.411** -0.494** -0.473* -0.494** 0.113 0.097 0.057 0.091 0.064 0.055 0.234 0.058 GDPpc 0.002** 0.001** 0.001 0.001 0.000 0.000 0.003 0.001 stock 0.146 0.013 0.164 0.41** 0.132 0.038 0.126 0.410 GDPpc_1 0.002** 0.002** 0.002** 0.001* 0.001 0.001 0.001 0.000 stock_1 0.179 0.202 0.282* 0.441** 0.160 0.142 0.142 0.101 legor_ge 44.600** 43.460** 44.649** 6.587 4.962 4.648 legor_fr 27.004** 31.524** 30.440** 4.655 3.167 3.798 legor_sc -2.68 -0.253 -1.124 7.092 6.248 6.379 Constant 50.584** 60.966** 58.607** 58.305** 39.773** 31.982* 82.509* 40.029* 10.463 10.37 10.642 11.852 11.083 12.896 39.039 16.903 N 291 277 262 253 262 262 262 277 277 (Rsq = 0.82) (Rsq = 0.83)
Annual data for the period 1981-1997. Dependent variable (priv) is the amount of credit granted by the bank system to the private sector (as a percentage of GDP); linfl is the logarithm of the annual change in consumer prices; lnsdinfl is the logarithm of the standard deviation of monthly inflation observation for the year; res2 is the bank liquid reserves to bank assets ratio; gov_deb is the gross government debt (as a percentage of GDP); stock is the stock market capitalisation (as a percentage of GDP); legal dummies are denoted by the prefix leg_; the suffix (_1) denotes the lagged term of variables; (*) indicates marginal significance at the 5%-level, and (**) at the 1% -level; FE and RE, indicate fixed effect and random effect model; First diff. is th the first difference estimator. (+) (++) point estimates of legal dummies denote differential effects with respect to leg_uk. Robust standard error are below estimated parameters.
Table 7 - Determinants of loans to GDP ratio in OECD countries (annual data, 1981-1989)
Dependent variable: priv
1 2 3 4 5 6 7 8 9
FE FE FE First diff. RE RE+ OLS+
FE ( time-dummies) OLS (time dummies) linfl -2.452 -1.811 -1.589 -0.419 -2.215 -1.096 -5.234 1.05 -4.506 1.331 1.081 1.767 0.845 1.808 1.722 2.759 1.96 2.823 lnsdinfl -2.397 1.798 1.031 0.342 2.026 1.568 2.313 1.392 2.671 1.518 1.097 1.372 0.447 1.613 1.621 2.521 1.023 2.776 res -2.040** -0.987** -1.150** -0.176 -0.346 -0.483** 0.462* -1.080** 0.702* 0.441 0.235 0.197 0.24 0.251 0.138 0.211 0.2 0.295 gov_deb -0.600** -0.584* -0.333** -0.515** -0.545** -0.563** -0.726* -0.588** 0.206 0.208 0.099 0.125 0.106 0.065 0.315 0.071 GDPpc 0.002* 0.001** 0.003 0.002** -0.001 0.000 0.002 0.001 stock 0.234 0.230** 0.196 0.445** 0.162 0.078 0.149 0.097 GDPpc_1 0.002* 0.002** 0.002** 0.001* 0.001 0.000 0.001 0.000 stock_1 0.307 0.315* 0.38 0.503** 0.233 0.15 0.201 0.086 legor_ge 48.541** 41.837** 41.321** 7.216 4.556 4.103 legor_fr 36.313** 28.543** 29.362** 9.6 5.585 5.55 legor_sc 3.102 2.597 1.139 8.919 4.662 4.847 Constant 53.714** 70.456** 71.018** 67.248** 45.296** 39.440* 73.640* 20.878 7.165 6.607 7.432 14.308 13.064 17.936 32.096 21.871 N 151 137 122 116 122 122 122 137 137 (Rsq = 0.83) (Rsq = 0.83)
Annual data for the period 1981-1989. Dependent variable (priv) is the amount of credit granted by the bank system to the private sector (as a percentage of GDP); linfl is the logarithm of the annual change in consumer prices; lnsdinfl is the logarithm of the standard deviation of monthly inflation observation for the year; res is the bank liquid reserves to bank assets ratio; gov_deb is the gross government debt (as a percentage of GDP); stock is the stock market capitalisation (as a percentage of GDP); legal dummies are denoted by the prefix leg_; the suffix (_1) denotes the lagged term of variables; (**) indicates marginal significance at the 5%-level, and (*) at the 1% -level; FE and RE, indicate fixed effect and random effect model; First diff. is th the first difference estimator. (+) (++) point estimates of legal dummies denote differential effects with respect to leg_uk. Robust standard error are below estimated parameters.
Table 8 - Determinants of loans to GDP ratio in OECD countries (annual data, 1990-1997)
Dependent variable: priv
1 2 3 4 5 6 7 8 9
FE FE FE First diff. RE RE+ OLS+
FE ( time-dummies) OLS (time dummies) linfl 0.793 -0.357 -0.201 0.192 -0.363 -0.737 -3.742 1.984 -3.25 1.522 0.685 0.683 0.633 0.744 0.729 2.6 1.361 3.761 lnsdinfl -1.281 -1.93 -2.025* -0.645 -2.059* -1.770* -1.389 -0.972 -0.008 0.852 1.011 0.847 0.601 0.848 0.786 1.983 0.992 2.359 res -0.841* -0.625* -0.536 -0.399 -0.583* -0.649** -0.818 -0.009 -0.985 0.344 0.281 0.313 0.261 0.28 0.241 0.423 0.293 0.512 gov_deb -0.331** -0.361** -0.011 -0.380** -0.402** -0.441** -0.771** -0.415** 0.104 0.108 0.074 0.11 0.09 0.089 0.196 0.088 GDPpc 0.002 0.000 -0.004 0.000 -0.001 0.000 0.002 0.001 stock -0.047 -0.018 -0.143 0.406** 0.07 0.047 0.08 0.094 GDPpc_1 0.002 0.002 0.002 0.000 0.001 0.001 0.001 0.001 stock_1 -0.082 -0.038 0.011 0.409** 0.095 0.09 0.08 0.109 legor_ge 38.313** 44.747** 47.603** 14.722 7.491 6.795 legor_fr 16.238 30.205** 30.301** 11.321 6.687 6.835 legor_sc -15.349 -2.627 -1.754 13.295 10.758 11.554 Constant 77.067** 63.061** 59.464** 59.124** 49.997* 45.204 205.922** 50.107 6.103 16.988 16.779 16.062 21.397 23.539 52.897 31.736 N 140 140 140 119 140 140 140 140 140 (Rsq = 0.83) (Rsq = 0.84)
Annual data for the period 1990-1997. Dependent variable (priv) is the amount of credit granted by the bank system to the private sector (as a percentage of GDP); linfl is the logarithm of the annual change in consumer prices; lnsdinfl is the logarithm of the standard deviation of monthly inflation observation for the year; res is the bank liquid reserves to bank assets ratio; gov_deb is the gross government debt (as a percentage of GDP); stock is the stock market capitalisation (as a percentage of GDP); legal dummies are denoted by the prefix leg_; the suffix (_1) denotes the lagged term of variables; (*) indicates marginal significance at the 5%-level, and (**) at the 1% -level; FE and RE, indicate fixed effect and random effect model; First diff. is th the first difference estimator. (+) (++) point estimates of legal dummies denote differential effects with respect to leg_uk. Robust standard error are below estimated parameters.
Table 9 - Determinants of loans to GDP ratio in OECD countries: do corporate bonds matter ? (annual data)
Dependent variable: priv
1 2 3 4 5 6 7 8 9
FE FE FE First diff. RE RE+ OLS+
FE ( time-dummies) OLS (time dummies) linfl -0.429 -0.932 -1.042 0.029 -1.707 -2.947* -4.045 1.27 -0.586 1.964 0.764 0.979 0.83 1.045 1.373 2.737 2.054 1.926 lnsdinfl -0.678 -0.51 -0.427 -0.548 -0.494 -0.148 0.639 -0.729 1.002 0.95 0.903 0.799 0.629 0.872 1.013 1.360 1.158 1.906 res -0.713** -0.473 -0.416 -0.448 -0.498* -0.673* -0.916* 0.293 -1.100* 0.13 0.233 0.248 0.301 0.247 0.331 0.417 0.403 0.423 gov_deb -0.268* -0.293* 0.017 -0.344** -0.388** -0.348** -0.806** -0.331** 0.111 0.108 0.092 0.074 0.075 0.058 0.241 0.068 GDPpc 0.002 0.000 -0.007 -0.001 0.001 0.001 0.004 0.001 stock -0.058 -0.034 -0.119 0.367** 0.106 0.057 0.104 0.073 GDPpc_1 0.002 0.002 0.001 0.000 0.001 0.001 0.001 0.001 stock_1 -0.067 -0.034 0.139 0.382** 0.144 0.122 0.107 0.077 corpbond 1.616 1.236 1.179 1.357 0.428 0.065 -0.498 0.768 -0.279 0.886 0.811 0.762 0.385 0.611 0.545 0.309 0.794 0.309 legor_ge 28.939* 30.084** 34.923** 13.511 5.129 4.777 legor_fr 18.632 15.569* 16.418* 13.368 5.935 6.726 legor_sc 4.692 6.358 9.424 13.431 5.655 5.009 Constant 59.390** 48.745 46.906 57.695** 54.668 77.449** 306.783* 98.929** 12.475 23.185 22.99 21.604 31.132 24.378 101.521 29.776 N 115 115 115 100 115 115 115 115 115 (Rsq = 0.78) (Rsq = 0.80)
Annual data for the period 1981-1997. Dependent variable (priv) is the amount of credit granted by the bank system to the private sector (as a percentage of GDP); linfl is the logarithm of the annual change in consumer prices; lnsdinfl is the logarithm of the standard deviation of monthly inflation observation for the year; res is the bank liquid reserves to bank assets ratio; gov_deb is the gross government debt (as a percentage of GDP); stock is the stock market capitalisation (as a percentage of GDP); trade is the sum of expoer and imports of goods and services (as a percentage of GDP); corp is the stock of securites other than shares issued by non-financial corporations; legal dummies are denoted by the prefix leg_; the suffix (_1) denotes the lagged term of variables; (*) indicates marginal significance at the 5%-level, and (**) at the 1% -level; FE and RE, indicate fixed effect and random effect model; First diff. is th the first difference estimator. (+) (++) point estimates of legal dummies denote differential effects with respect to leg_uk. Robust standard error are below estimated parameters.